• Aucun résultat trouvé

Tableau de Valeur de Position (de Milliers à des Millièmes)

N/A
N/A
Protected

Academic year: 2021

Partager "Tableau de Valeur de Position (de Milliers à des Millièmes)"

Copied!
1
0
0

Texte intégral

(1)

Tableau de Valeur de Position Decimal (A)

Nom: Date:

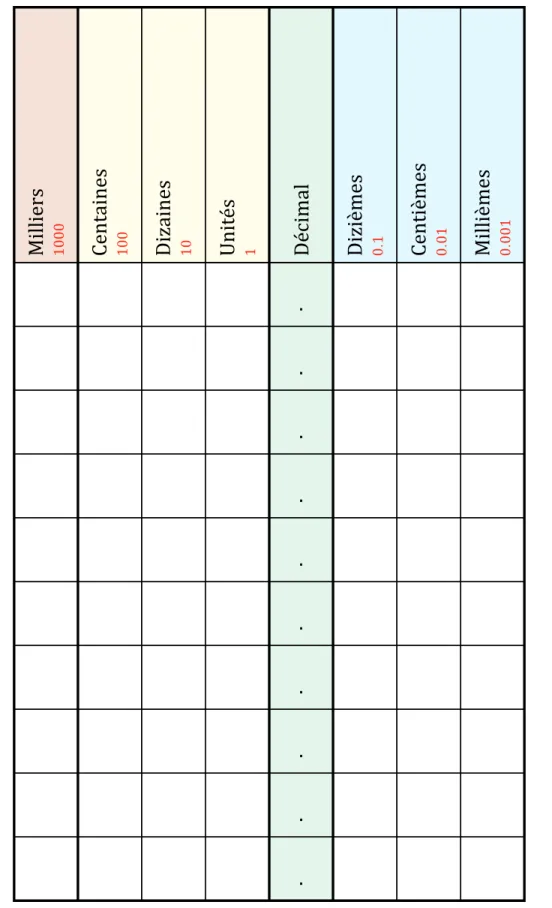
Milliers 1000 Centaines 100 Dizaines 10 Unit

és 1 De ́cimal Dizie ̀mes 0 .1 Centie ̀mes 0 .01 Millie ̀mes 0 .001 . . . . . . . . . . MathsLibres.com

Figure

Tableau de Valeur de Position Decimal (A)

Références

Documents relatifs

Whereas the 13:00–15:00 MLT sector is characterized by classical poleward moving auroral forms (PMAFs) asso- ciated with merging cell transients, the aurora in the 15:00– 17:00

In contrary to polar cap patches observed within the polar cap, the current paper reports on a sequence of patches at sub-auroral cusp latitudes, appearing as a segmentation of

Though the conceptual forced Lorenz model is too simple to be used directly for the study of monsoon predictability, the bifurcation analysis of the forced Lorenz model presented

A quadrupole type Aerodyne Aerosol Mass Spectrometer (AMS) (Jayne et al., 2000;.. Laaksonen et al. Title Page Abstract Introduction Conclusions References Tables Figures ◭ ◮ ◭ ◮

To check this quanti- tatively using our combined model, ®rst of all we scaled the photochemical reaction rates to follow the change in the solar production rate with zenith angle

The auroral features which the combination of two meridian scanning photometers and an all-sky imager made us able to illuminate are the following: (1) a three- phase evolution of

2, 3, 4 and 5 that the time series data of the 3-point running average of zonal, meridional and vertical velocities are in- creasing with increasing height in the troposphere and

We concluded from these simulation studies that, if QP echoes were the result of the projection movement of gravity wave packets along the radar beam, then we can identify the slope