ORIGINAL ARTICLE
Outcome after renal transplantation.
Part I: Intellectual and motor performance
Jutta Falger&Bea Latal&Markus A. Landolt& Phaedra Lehmann&Thomas J. Neuhaus& Guido F. Laube
Received: 18 October 2007 / Revised: 8 February 2008 / Accepted: 8 February 2008 / Published online: 4 April 2008
# IPNA 2008
Abstract Comprehensive information on neurodevelop-mental outcome in children and adolescents with chronic kidney disease is still limited. Intellectual performance (IP) and motor performance (MP) were systematically assessed in 27 patients at a median age of 14.1 years (range 6.5–17) and 6 years (range 0.5–12.7) after renal transplantation (RTPL). IP was analyzed with the Wechsler Intelligence Scale for Children-III (WISC-III) in 25 patients and by the Kaufman Assessment Battery for Children in two patients. MP was evaluated by the Zurich Neuromotor Assessment. Median full- scale intelligent quotient (FSIQ) was 97 (range 49–133). Twenty-one patients had an FSIQ ≥ 85 (i.e. ≥ mean–1 standard deviation). The five patients with neuro-logical comorbidity had a median FSIQ of 81 (range 49– 101). Verbal IQ (VIQ) (median 104; range 50–146) was significantly (p<0.01) higher than performance IQ (PIQ) (median 88; range 48–117). The PIQ was significantly lower compared with controls (p<0.007), and patients scored significantly lower compared with controls in five of 11 subtests of the Wechsler Scale. All MP tasks were significantly (p<0.01) lower than in controls, and also in
children without neurological comorbidity. Socioeconomic status was significantly correlated with FSIQ (p=0.03). IP after RTPL was within the normal range for the majority of children. PIQ was lower compared with VIQ, and MP was significantly affected in all children after RTPL.
Keywords Renal transplantation . Outcome . Intellectual performance . Motor performance . Neurodevelopmental outcome
Introduction
Comprehensive data on neurodevelopmental outcome, i.e. intellectual performance (IP) and motor performance (MP), in children with chronic kidney disease [1–6] and in particular after renal transplantation (RTPL) [2, 7–10] are still limited. Published studies have focussed either on IP [1–5, 7] or on MP [6, 8]. and only a few studies have assessed both [9,10].
The majority of the children on dialysis had IP scores in the lower normal range [1, 2]. Increased disease severity, longer disease duration, and younger age at onset of kidney disease potentially placed children with chronic kidney disease at increased risk of neurocognitive deficits [5]. Further associations of impaired IP were younger age at the start of renal replacement therapy and longer duration of dialysis [1, 5]. Children showed improvement in specific aspects of IP after RTPL (e.g. mental processing speed and sustained attention) compared with those on dialysis [4,7, 10]. In infants transplanted before the age of 30 months, comparison of individual cognitive and motor function revealed an improvement in both areas after RTPL [10]. However, mainly global measures of intelligence were used, and subdimensions of intelligence such as verbal
DOI 10.1007/s00467-008-0795-0
J. Falger
:
T. J. Neuhaus:
G. F. Laube (*) Nephrology Unit, University Children’s Hospital, Steinwiesstrasse 75,8032 Zurich, Switzerland e-mail: [email protected] B. Latal
:
P. LehmannChild Development Centre,
University Children’s Hospital Zurich, Zurich, Switzerland
M. A. Landolt
Department of Psychosomatics and Psychiatry, University Children’s Hospital Zurich, Zurich, Switzerland
intelligence quotient (VIQ) and performance IQ (PIQ) were not systematically analyzed [5,9].
Assessment of neuromotor function only included technical examinations, such as electroencephalograms, computed tomographic scan, magnetic resonance imaging, and nerve conduction velocity, indicating neurological deficits in up to 20% of transplanted children [9]. To date, no study has assessed MP in school-aged children using a standardized motor assessment battery. A preliminary study from our unit had shown that MP was significantly impaired in children starting renal replacement therapy before 5 years of age [11].
Some studies were based on a small number of patients [1,7] or focused only on special risk groups by including children suffering from chronic kidney disease at a young age (3 months to 5 years) [1,3,9,10]. Other authors [3,9] demonstrated that children may manifest a variety of major or minor neurological complications ranging from cerebro-vascular events to reduced head circumference size. It is thus conceivable that motor impairment may be found in children after RTPL also in the absence of major neurolog-ical events, reflecting milder neurologneurolog-ical injury. Addition-ally, we and others [12] have shown that IP and MP may be related in children at risk for neurodevelopmental impair-ments, such as prematurely born children. We thus aimed to determine this relationship in children after RTPL.
The aim of this study was to assess IP and MP in children and adolescents after RTPL using standardized and validated methods. Additionally, medical, socioeconomic, and family-related predictors (e.g. marital status, mother tongue, number of siblings) of IP and MP were evaluated.
Methods Patients
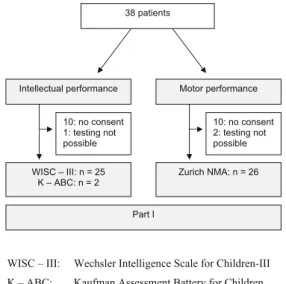
Forty patients underwent RTPL at our hospital between 1995 and 2005. Inclusion criteria were RTPL, age > 5 years at examination, and follow-up at our unit. Neurodevelop-mental outcome was evaluated in 27 (15 boys, 12 girls) out of 38 eligible patients (Fig. 1). The underlying diseases were acquired, congenital, or inherited in six, eight, and 13 patients, respectively. Five patients had neurological comorbidity: neonatal hypoxia (1), cerebral infarct (1), severe deafness (1), severe visual impairment (1), and Joubert syndrome (1). Three patients were born premature-ly. Thirteen patients did not participate: two had died with good graft function and one had severe neurological deficit (neonatal cerebral infarct) and could not be adequately examined, and parents did not provide consent for ten patients. Two of these children were born prematurely; none had a neurological comorbidity.
Immunosuppression at examination consisted of cyclo-sporine A (17; trough level 80–120 ng/ml) or tacrolimus (10; trough level 4–8 ng/ml), mycophenolate mofetile (19;
dose 1,200 and 900 mg/m2 body surface in patients on
cyclosporine A and tacrolimus, respectively) or azathio-prine (7; dose 1 mg/kg body weight), and low-dose alternate-day prednisone (range 2.5–5.0 mg per dose; 21). Six patients were off steroids.
Renal function was assessed as estimated glomerular filtration rate (GFR: ml/min per 1.73 m2body surface area) calculated by the Schwartz formula with a k-factor of 40 based on local comparison with Cr-EDTA clearance
measurements [13]. Casual blood pressure was measured
in the sitting position. Indication for antihypertensive treatment was a systolic blood pressure >95th percentile [14]. At the time of evaluation, systolic blood pressure of all patients was <95th percentile. Height, weight, and body
mass index (BMI: kg/m2) were correlated to normative
Swiss data [15].
Assessment of intellectual performance (IP) and motor performance (MP)
The examination of IP and MP took a full morning (09.00– 13.00). The order of examination was: Joining phase, IP testing, break, MP testing, and neurological examination. Wechsler Intelligence Scale for Children-III (WISC-III) The Wechsler Intelligence Scale for Children-III (WISC-III) is used in children aged 6–16 years (school age) and is organized into three IQ scores: full-scale IQ (FSIQ), VIQ, and PIQ, with a mean score of 100 and a standard deviation
WISC – III: Wechsler Intelligence Scale for Children-III K – ABC: Kaufman Assessment Battery for Children Zurich NMA: Zurich Neuromotor Assessment
38 patients Motor performance Intellectual performance WISC – III: n = 25 K – ABC: n = 2 Zurich NMA: n = 26 10: no consent 1: testing not possible Part I 10: no consent 2: testing not possible
Fig. 1 Algorithm of all 38 surviving patients transplanted between 1995 and 2005. Included in Part I: 27. Age at transplantation: 2– 15 years; age at evaluation: 6–17 years
(SD) of 15. In this study, children were examined with the WISC-III [16,17]. The WISC-III consists of VIQ and PIQ, which form the FSIQ. The VIQ is composed of subtest information, comprehension, arithmetic, similarities, and vocabulary; the PIQ consists of the subtests coding, picture completion, picture arrangement, block design, and object assembly. The subtest digit span is a separate subtest, which is not included in the verbal subtest. The VIQ and PIQ are combined into the FSIQ. In Switzerland, normal age at entry in primary school is 6–7 years, and an FSIQ>85, i.e. ≥ mean–1 SD, is mandatory to attend normal school. Kaufman Assessment Battery for Children (Kaufman-ABC) The Kaufman Assessment Battery for Children (K-ABC) is used in preschool children and is composed of two parts: the mental processing composite and the achievement scale [18,19].
Zurich Neuromotor Assessment (Zurich NMA)
The Zurich Neuromotor Assessment (NMA) is a standard-ized and reproducible testing procedure assessing timed performance and associated movement quality of a variety of motor tasks. Age- and gender-specific normative data are based on 662 healthy children and adolescents recruited from the local Zurich and aged between 5 and 18 years [20,
21]. The testing procedure includes assessment of pure
motor tasks, adaptive fine-motor tasks, adaptive gross-motor tasks, static balance, and stress gaits [20, 21]: Repetitive, alternating, and sequential movements were assessed by the performance of finger, hand, and foot movements, alternating hand pronation–supination and foot movements, and sequential finger movements. Pegboard examination was conducted according to age. Dynamic balance was analyzed by an elastic cord fixed 20 cm above the floor between two metal poles placed 4 m apart. The exercise consisted of two tasks: the first was side-to-side jumping keeping the feet together; the second was forward jumping. Static balance was assessed by asking the child to choose one leg and stand on it for as long as possible, time limit 60 s. For this analysis, only time performance was used. The child’s performance is videotaped and timed with a watch. The results of the Zurich NMA are expressed as four motor components: (1) the pure motor component combines the timed performance of all repetitive, alternat-ing, and sequential movements of both extremities; (2) the adaptive fine-motor component combines all timed per-formances of the peg board; (3) the adaptive gross-motor component combines the results of the dynamic balances; and (4) the static balance. Intraobserver reliability for timed performance of the components pure motor, adaptive fine motor, gross motor, and static balance is 0.95, 0.99, 0.99,
and 0.99, respectively [20,21]. The intraobserver reliability is derived from the normative sample. All Zurich NMA tasks are expressed as standard deviation score (SDS or Z score) derived from the age- and gender-related reference population.
Socioeconomic status (SES)
Socioeconomic status (SES) can be defined by a variety of factors. We used paternal employment and maternal education for defining SES. SES was defined and validated for Swiss children and is expressed by the sum of a six-point scale of paternal occupation and
maternal education [22]. The method has already been
used in other studies assessing the influence of SES on intellectual outcome [12].
Procedure
The study was approved by the Ethical Committee of the University Hospital of Zurich, and written informed consent was obtained from all parents and patients older than 10 years. All 27 patients were tested by one pediatrician, who was not involved in the patient care and was unaware of the current graft function. The examiner was supervised by video recordings.
Statistical analysis
The analyses were performed using the SPSS statistical software package (Version 11.5, SPSS Inc, Chicago, IL, USA). Data are presented as mean (± SD) or median (range) if data were not normally distributed. The null hypothesis tested against was that children with RTPL had no impairment of IP and MP in comparison with healthy children. Differences between groups were analyzed using Student’s t test or Mann–Whitney U test, depending on data distribution. To evaluate associations of IP and MP, Spear-man’s rank correlation coefficients were computed. Uni-variate analysis was followed by multiple regression analysis to determine the independent association between PIQ and MP. Proportions between the groups were compared by Fisher’s exact test. A p value of < 0.05 was considered significant.
Results
Clinical evaluation
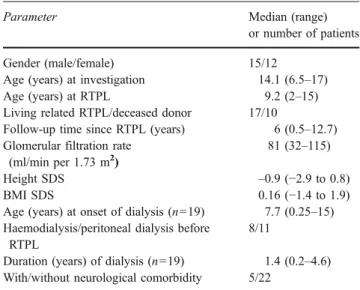
Twenty-seven patients were examined at an age of 14.1 years (range 6.5–17) and 6 years (range 0.5–12.7) after RTPL (Tables1and2). Estimated glomerular filtration
rate was 81 ml/min per 1.73 m2 (range 32–115), and 14 patients were on antihypertensive medication.
School performance
Median age at school entry was 7.3 years (6.3–7.8) and was comparable in patients with and without neurological comorbidity. Two children attended the nursery at the time of evaluation. Nine of 25 children had repeated a school grade, and three attended a special first class taking 2 years instead of 1 year. Four of five children with neurological comorbidity went to a special school, whereas all school-aged children without neurological comorbidity (n=20) attended normal school (Fisher’s exact test, p=0.0007). Intellectual performance (IP)
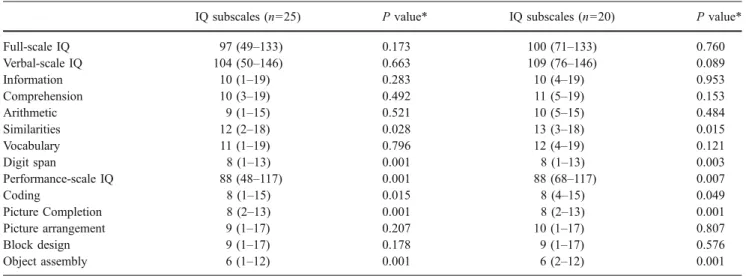
WISC-III was examined in 25 patients (Tables 2 and 3):
Median FSIQ in all tested children was 97 (49–133), with
Table 1 Clinical data of 27 patients
Parameter Median (range)
or number of patients Gender (male/female) 15/12
Age (years) at investigation 14.1 (6.5–17) Age (years) at RTPL 9.2 (2–15) Living related RTPL/deceased donor 17/10
Follow-up time since RTPL (years) 6 (0.5–12.7) Glomerular filtration rate
(ml/min per 1.73 m2 )
81 (32–115)
Height SDS –0.9 (−2.9 to 0.8)
BMI SDS 0.16 (−1.4 to 1.9)
Age (years) at onset of dialysis (n=19) 7.7 (0.25–15) Haemodialysis/peritoneal dialysis before
RTPL
8/11
Duration (years) of dialysis (n=19) 1.4 (0.2–4.6) With/without neurological comorbidity 5/22
RTPL renal transplantation, SDS standard deviation score, BMI body mass index
Table 2 Diagnosis, intellectual performance, and risk factors of all 27 patients
Patient Diagnosis Full scale IQ Verbal IQ Performance IQ Risk factors
1 Renal dysplasia 81 86 80 –
2 Renal dysplasia and PUV 95 108 84 –
3 Renal dysplasia 109 110 104 –
4 Denys-Drash-syndrome 112 110 112 –
5 Neonatal shock kidneys 76 78 75 Neonatal asphyxia
6 ARPKD 102 118 85 –
7 Atypical HUS 85 88 85 –
8 Bone marrow transplantation associated renal failure
81 89 76 Cerebral infarct
9 Renal dysplasia and PUV 132 140 117 Premature birth
(36 week)
10 Renal-hepatic-pancreatic dysplasia 88 K-ABC K-ABC –
11 FSGS 101 118 84 Premature birth
(36 week)
12 DMS 101 K-ABC K-ABC Severe visual impairment
13 FSGS 103 117 88 –
14 Cystinosis 100 104 97 –
15 IgA-nephropathy 106 117 92 Premature birth
(34 week)
16 Joubert syndrome 49 50 48 Joubert syndrome
17 Cystinosis 71 76 68 –
18 Branchio-oto-renal syndrome 85 85 89 Severe deafness
19 Renal dysplasia and PUV 90 95 88 –
20 Denys-Drash-syndrome 133 146 109 –
21 Renal dysplasia 97 109 85 –
22 Cystinosis 99 104 95 –
23 FSGS 87 89 88 –
24 Nephronophthisis 109 113 101 –
25 Renal dysplasia and PUV 88 97 81 –
26 FSGS 114 117 107 –
27 1oHyperoxaluria 75 82 69 –
IgA Immunoglobulin A, PUV posterior urethral valves, ARPKD autosomal recessive polycystic kidney disease, HUS hemolytic uremic syndrome, FSGS focal segmental glomerulosclerosis, DMS diffuse mesangial sclerosis, K-ABC Kaufman Assessment Battery for Children
VIQ and PIQ of 104 (50–146) and 88 (48–117), respec-tively. Nineteen, two, and six children had an FSIQ between 85 and 115 (i.e. mean ± 1 SD), > 115 and < 85, respectively. The five patients with neurological comorbid-ity had a median FSIQ of 81 (range 49–101).
VIQ was significantly (p<0.01) higher than PIQ. The PIQ was significantly (p<0.007) lower compared with controls. The patients also scored significantly lower compared with controls in five of the 11 subtests, i.e. similarities, digit span, coding, picture completion, and object assembly (p<0.05). The scoring was also signifi-cantly lower (p<0.05) when patients with neurological comorbidity were excluded. Two preschool children with-out neurological comorbidity were assessed with the K-ABC, resulting in an FSIQ of 88 and 101, respectively.
Motor performance (MP)
MP could be assessed in 26 of 28 eligible patients. Two patients with severe neurological comorbidity (Joubert syn-drome and severe cerebral infarct) could not be formally tested. Significant impairment compared with healthy chil-dren was observed in all four motor components (Fig.2). The proportion of children with impaired MP, defined as values < 10th percentile, ranged from 32% to 60%. The five patients with neurological comorbidity had significantly lower scores in all tasks compared with 21 patients without comorbidity (p<0.01). MP was also poorer in children without neuro-logical comorbidity compared with controls (one-sample t test: pure motor task p<0.001, adaptive fine motor p=0.01, adaptive gross motor p<0.001, static balance p=0.001).
Table 3 Intellectual performance (only Wechsler Intelligence Scale for Children-III): data given for all 25 children and 20 children without neurological comorbidity
IQ subscales (n=25) P value* IQ subscales (n=20) P value*
Full-scale IQ 97 (49–133) 0.173 100 (71–133) 0.760 Verbal-scale IQ 104 (50–146) 0.663 109 (76–146) 0.089 Information 10 (1–19) 0.283 10 (4–19) 0.953 Comprehension 10 (3–19) 0.492 11 (5–19) 0.153 Arithmetic 9 (1–15) 0.521 10 (5–15) 0.484 Similarities 12 (2–18) 0.028 13 (3–18) 0.015 Vocabulary 11 (1–19) 0.796 12 (4–19) 0.121 Digit span 8 (1–13) 0.001 8 (1–13) 0.003 Performance-scale IQ 88 (48–117) 0.001 88 (68–117) 0.007 Coding 8 (1–15) 0.015 8 (4–15) 0.049 Picture Completion 8 (2–13) 0.001 8 (2–13) 0.001 Picture arrangement 9 (1–17) 0.207 10 (1–17) 0.807 Block design 9 (1–17) 0.178 9 (1–17) 0.576 Object assembly 6 (1–12) 0.001 6 (2–12) 0.001 IQ intelligence quotient
* Univariate t test compared with normative data [17]
-6 -5 -4 -3 -2 -1 0 1 SD S
*Number of patients (%) below 10th percentile.
p<0.001; *12 (55) p=0.001; * 7 (32) p<0.001; *13 (59) p=0.001;* 7 (32) Pure motor task Adaptive gross motor task Adaptive fine motor task Static balance
Fig. 2 Motor performance [Zur-ich Neuromotor Assessment (Zuric NMA)] of 26 patients after renal transplantation: data given as standard deviation score (SDS): mean and 95% confidence interval
Socioeconomic status (SES)
Mean SES in this sample was 7.3 (range 3–12). Associations of intellectual performance (IP) and motor performance (MP)
Patients without neurological comorbidity or further risk factors for development (e.g. premature birth, cerebral infarct, neonatal asphyxia, visual impairment, and deafness) had higher scores for IP and MP compared with patients with comorbidity or risk factors. Neurological comorbidity was negatively associated with FSIQ (Mann-Whitney U test p=0.03). There was a significant association between PIQ and pure-motor (Spearman: r=0.45; p=0.03) and adaptive fine-motor (Spearman: r=0.50; p=0.01) tasks. After adjust-ing for neurological comorbidity, the association between PIQ and MP (both pure and adaptive fine motor) was no longer statistically significant. SES was significantly asso-ciated with FSIQ (Spearman: r=0.41; p=0.03), but not with MP. Patient-, family-, and illness-related variables, e.g. glomerular filtration rate, prednisone therapy, age at onset and duration of dialysis, and age at RTPL, were not significantly associated with IP and MP. There was also no gender-related difference in MP or IP.
Discussion
Long-term outcome after RTPL in children, i.e. patient and graft survival, has steadily improved over the last decades
[23, 24]. However, information on comprehensive and
detailed neurodevelopmental outcome after RTPL is still limited [1–9]. This cross-sectional study presents detailed measures of IP and MP in children after RTPL.
The majority of our patients scored an FSIQ within the lower normal range. This observation is consistent with other studies [1, 2, 4, 5, 7, 9]. Studies analyzing only IP differed significantly in their design [1–5,7]. Focusing on 15 infants initiating long-term peritoneal dialysis in the first year of life, median FSIQ was in the lower normal range (91, range 50–102), and only one patient had an FSIQ above mean (> 100) [1]. Similar results were obtained by Warady et al. who evaluated 28 children undergoing peritoneal dialysis at the very young age of ≤ 3 months. General mental development scores were in the average range (defined as 85–115) in 79% of the children tested > 4 years of age [3].
PIQ was significantly lower than VIQ in our patients. These findings are in line with previous studies [6, 8]. Although not statistically significant, PIQ after RTPL was associated with MP as assessed by the Zurich NMA. However, the primary reasons for impaired MP in
children suffering from chronic kidney disease remain unclear.
In our series, IP was not correlated with illness-related variables, e.g. age at onset of dialysis, duration of dialysis, age at RTPL, graft function, and prednisone therapy. These results are at variance with reports showing that disease severity, longer disease duration, and younger age at onset of kidney disease were significant clinical predictors of IP [2, 5]. In particular, children with increased disease severity and a low glomerular function were potentially placed at increased risk of neurocognitive deficits [5]. Explanations for the absent impact of illness-related variables include the rather homo-geneous population, with the majority of children having a good graft function and the fact that neurodevelopmental evaluation was performed 6 years after RTPL. A long interval since RTPL may efface a correlation between pretransplantation factors and IP and MP. However, the fact, that this analysis only included patients after RTPL implies caution by extrapolating conclusions and represents an acknowledged limitation of our data. Consistent with other reports, SES was significantly correlated with IP [22].
This study reports the first comprehensive analysis of MP after RTPL using a standardized and validated method (Zurich NMA). Motor performance was significantly im-paired in the transplanted children and adolescents—also in patients without neurological comorbidity—with 32–59% of patients scoring < 10th percentile in all components. Specifically, the pure motor task and the adaptive gross-motor component were mostly affected. Impairment of the pure-motor task and the adaptive gross-motor task may lead to clumsiness in school-aged children and therefore substantially negatively affect their academic performance and competence in other developmental areas, such as communication and social interaction with peers, and thus profoundly influence feelings of well-being and self-esteem.
General muscular hypotonia has also been observed in nine, four, and two children with chronic kidney disease, on dialysis, and after RTPL, respectively [6]. Motor perfor-mance assessed by the Bayley Scales of Infant Develop-ment was normal in 76% of children transplanted at an age < 5 years, and similar to our own findings, neurological comorbidity was the most negative predictor [9].
Patient- and illness-related variables, e.g. glomerular filtration rate, prednisone therapy, age at onset and duration of dialysis, and age at RTPL, had no significant association concerning IP and MP in our patients, whereas SES was the only predictor of IP. Neurological comorbidity was the most significant correlating factor negatively influencing both IP and MP. There are a variety of reasons for neurological comorbidities in patients with chronic renal diseases, e.g. cerebral infarct, neonatal asphyxia, syndromic maldevelopment of the brain, visual impairment, and deafness.
Few studies have assessed patients longitudinally before
and after RTPL [4, 7, 10]. One study reported an
improvement of cognitive and psychomotor function after
RTPL [10], whereas there was no difference in FSIQ. A
further study showed that transplanted patients did signif-icantly better in achievement tests of written language and in school performance [4]. Mental processing speed and sustained attention improved in nine children after RTPL [7]. Taken together, the majority of these longitudinal observations suggest that successful RTPL has a significant impact on neurodevelopment performance.
Our cross-sectional study of neurodevelopmental outcome in children after RTPL confirmed our hypothesis. It indicates a normal intellectual functioning for the majority of patients in the majority of subtests but a significantly impaired MP. Neurological comorbidity is associated with MP and IP. The lower PIQ might be related to impaired MP. A detailed neurodevelopmental and motor assessment of children with chronic kidney disease provides both the possibility of defining their specific requirements and of developing promotional programs individually focussed on these children.
Acknowledgements This study was founded by the Foundation Mercator Switzerland.
References
1. Madden SJ, Ledermann SE, Guerrero-Blanco M, Bruce M, Trompeter RS (2003) Cognitive and psychosocial outcome of infants dialysed in infancy. Child Care Health Dev 29:55–61 2. Brouhard BH, Donaldson LA, Lawry KW, McGowan KR, Drotar
D, Davis I, Rose S, Cohn RA, Tejani A (2000) Cognitive functioning in children on dialysis and post-transplantation. Pediatr Transplant 4:261–267
3. Warady BA, Belden B, Kohaut E (1999) Neurodevelopmental outcome of children initiating peritoneal dialysis in early infancy. Pediatr Nephrol 13:759–765
4. Lawry KW, Brouhard BH, Cunningham RJ (1994) Cognitive functioning and school performance in children with renal failure. Pediatr Nephrol 8:326–329
5. Slickers J, Duquette P, Hooper S, Gipson D (2007) Clinical predictors of neurocognitive deficits in children with chronic kidney disease. Pediatr Nephrol 22:565–572
6. Elzouki A, Carroll J, Butinar D, Moosa A (1994) Improved neurological outcome in children with chronic renal disease from infancy. Pediatr Nephrol 8:205–210
7. Mendley SR, Zelko FA (1999) Improvement in specific aspects of neurocognitive performance in children after renal transplantation. Kidney Int 56:318–323
8. El-Husseini AA, Abu-Hegazy M, El-Tantawi Ael H, Sobh MA, Ghoneim MA (2005) Neurophysiologic changes in live related kidney transplant children and adolescents. Pediatr Transplant 9:579–583
9. Qvist E, Pihko H, Fagerudd P, Valanne L, Lamminranta S, Karikoski J, Sainio K, Ronnholm K, Jalanko H, Holmberg C (2002) Neuro-developmental outcome in high-risk patients after renal transplanta-tion in early childhood. Pediatr Transplant 6:53–62
10. Davis ID, Chang PN, Nevins TE (1990) Successful renal transplantation accelerates development in young uremic children. Pediatrics 86:594–600
11. Neuhaus TJ, Ritter S, Schmid M, Largo R, Leumann E (1996) Intellectual and motor development in children who started renal replacement therapy (RRT) < age 5 years. Pediatr Nephrol 10: C148 (abstract)
12. Seitz J, Jenni OG, Molinari L, Caflisch J, Largo RH, Latal Hajnal B (2006) Correlations between motor performance and cognitive functions in children born < 1250 g at school age. Neuropediatrics 37:6–12
13. Chantler C, Barratt TM (1972) Estimation of glomerular filtration rate from plasma clearance of 51-chromium edetic acid. Arch Dis Child 47:613–617
14. National High Blood Pressure Education Program Working Group on High Blood Pressure in Children and Adolescents (2004) The fourth report on the diagnosis, evaluation, and treatment of high blood pressure in children and adolescents. Pediatrics 114:555–576
15. Prader A, Largo RH, Molinari L, Issler C (1989) Physical growth of Swiss children from birth to 20 years of age. First Zurich longitudinal study of growth and development. Helv Paediatr Acta Suppl 52:1–125 16. Wechsler D (1991) Wechsler Intelligence Scale for Children—3nd
edn. The Psychological Corporation, San Antonio, TX
17. Tewes U, Rossmann P, Schallberger U (2000) Hamburg-Wechsler-Intelligenztest für Kinder III (HAWIK-III). Dritte Auflage. Hans Huber Verlag, Bern
18. Kaufmann A, Kaufmann N (1993) Kaufmann Assessment Battery for Children (K-ABC). American Guidance Service, Circle Pines
19. Melchers PPU (1991) K-ABC: Kaufman Assessment Battery for Children: Deutschsprachige Fassung. Swets and Zeitlinger, Frankfurt 20. Largo RH, Caflisch JA, Hug F, Muggli K, Molnar AA, Molinari L, Sheehy A, Gasser ST (2001) Neuromotor development from 5 to 18 years. Part 1: timed performance. Dev Med Child Neurol 43:436–443 21. Largo RH, Caflisch JA, Hug F, Muggli K, Molnar AA, Molinari L (2001) Neuromotor development from 5 to 18 years. Part 2: associated movements. Dev Med Child Neurol 43:444–453 22. Largo RH, Pfister D, Molinari L, Kundu S, Lipp A, Duc G (1989)
Significance of prenatal, perinatal and postnatal factors in the development of AGA preterm infants at five to seven years. Dev Med Child Neurol 31:440–456
23. McDonald SP, Craig JC (2004) Long-term survival of children with end-stage renal disease. N Engl J Med 350:2654–2662 24. Smith JM, Stablein DM, Munoz R, Hebert D, McDonald RA
(2007) Contributions of the Transplant Registry: The 2006 Annual Report of the North American Pediatric Renal Trials and Collaborative Studies (NAPRTCS). Pediatr Transplant 11:366–373