K. Montet-Abou J. L. Daire M. K. Ivancevic J. N. Hyacinthe D. Nguyen M. Jorge-Costa D. R. Morel J. P. Vallée
Optimization of cardiac cine in the rat
on a clinical 1.5-T MR system
Received: 23 December 2005 Revised: 9 June 2006 Accepted: 12 June 2006 Published online: 25 July 2006 © ESMRMB 2006
K. Montet-Abou (
B
)· J. L. Daire M. K. Ivancevic· J. N. Hyacinthe D. Nguyen· J. P. ValléeRadiology and Medical Informatics Department, Digital Imaging Unit (UIN), Geneva University Hospital,
1211, Geneva 14, Switzerland E-mail: [email protected] Tel.: +41-22-3795784 Fax: +41-22-3727072 M. Jorge-Costa· D. R. Morel Anesthesiology, Pharmacology and Intensive Care in Surgery Department, Anesthesiological Investigations Unit, Geneva University Hospital,
1211, Geneva 14, Switzerland
Abstract Object: the overall goal
was to study cardiovascular function in small animals using a clinical 1.5-T MR scanner optimizing a fast gradient-echo cine sequence to obtain high spatial and temporal resolution.
Materials and methods: normal rat hearts (n = 9) were imaged using a 1.5-T MR scanner with a spiral fast gradient-echo (fast field echo for Philips scanners) sequence, three Cartesian fast gradient-echo (turbo field echo for Philips scanners) sequences with different in-plane resolution, and with and without flow compensation and half-Fourier acquisition. The hearts of four rats were then excised and left-ventricle mass was weighed. Inter- and intra-observer variability analysis was performed for magnetic resonance imaging (MRI) measurements.
Results: half-Fourier acquisition with flow compensation gave the best sequence in terms of image quality, spatial as well as temporal resolution, and suppression of flow artifact. Ejection fraction was 71± 4% with less than 5% inter- and intra-observer variability. A good correlation was found between MRI-calculated left-ventricular mass and wet weight.
Conclusions: using optimized sequences on a clinical 1.5-T MR scanner can provide accurate quantification of cardiac function in small animals and can promote cardiovascular research on small animals at 1.5-T.
Keywords MRI· Cardiac
imaging· Small animal
Introduction
Cardiac magnetic resonance imaging (MRI) already has well-established clinical applications with a constantly increasing list of indications [1–5]. In addition to clin-ical use, there is intense research into imaging and assessing the heart function of small animals to better understand cardiovascular pathologies. Some investiga-tors have demonstrated the feasibility of imaging and quantifying the heart function and dysfunction using 2-T [6, 7], 4.7-T [8–11], or higher-field MR systems [12– 14], dedicated exclusively to the small animal. However,
such high-field systems are not widely available in con-trast to 1.5-T MR systems used for clinical and research applications. Few animal studies at 1.5-T have evaluated the cardiac function of mice or rats [15–18], and have been limited by the spatial or temporal resolution and image quality. In particular, the optimization made pos-sible by a clinical 1.5-T MR system has not been explored in these preliminary studies. Therefore, cardiac imaging of rodents has not been completely developed on clinical 1.5-T MR systems and remains a technical challenge due to the small size of the animals, fast heart and breathing rates, as well as the lower signal-to-noise ratio (SNR) of low-field MR systems.
The aim of this work was: (1) to demonstrate that cardiac imaging of rats is feasible at 1.5-T on a clinical MR scanner with high spatial and temporal resolution (close to that achieved in humans), (2) to compare four different optimized fast gradient-echo cine sequences in the evaluation of heart function.
Materials and methods
Animal preparation
Anesthesia was induced in nine adult male rats (Sprague–Daw-ley) weighing 381 ± 18 g with isoflurane 3%, and was main-tained by an intraperitoneal (IP) catheter with a bolus injec-tion of 40 mg/kg sodium pentobarbital (Nembutal sodium solu-tion, Abbott Laboratories, North Chicago, IL, USA) followed by continuous perfusion (20 mg/kg/h). The rats were then placed in a cradle in supine position. A heating system maintained a constant temperature of the rats (37–37.5◦C), monitored by a rectal thermal probe; a respiratory pillow was placed on the abdomen to control the breathing rate. The electrocar-diogram (ECG) recorded by subdermal electrodes was then used as a cardiac trigger for the MR system. Monitoring de-vices were connected with optical fibers to a personal com-puter (PC, Dell Latitude 800 with Windows 2000) during the MRI acquisitions [SA Instrument, Inc. (SAII), Stony Brook, NY, USA, MR-compatible model 1025 monitoring and gat-ing system]. The data-acquisition modules were located near the animal in the MR scanner; a control/gating module was nected to a PC next to the operator console. Modules were con-trolled by menu-driven software from the PC. All output from ECG/temperature, respiration/IBP (pressure transducer) was transmitted through optical fibers. This system allowed acqui-sitions with ECG-gated sequences despite the high heart rate of the rat; furthermore, it allowed for continuous real-time physio-logical parameters assessment during the whole experiment. All animal procedures were approved by the ethical committee of our institution.
Ex-vivo measurements
Four rats were killed directly after the imaging session. The heart was carefully dissected to isolate the left ventricle, which was then weighed on an analytical balance (Acculab, Sartorius Group, Epsom, UK).
MRI experiments
Experiments were performed on a 1.5-T MR system (Intera, Philips Medical Systems, Best, The Netherlands) using a micros-copy surface coil (47 mm diameter) for reception. A body coil was used for transmission. Four standard Philips MR fast gradi-ent-echo (fast field echo on Philips system) sequences were used to acquire one long-axis and two short-axis views of the heart
(mid-ventricular and apical): (1) spiral gradient echo [spiral fast field echo (FFE) sequence on Philips system], (2) Cartesian gradient-echo sequence with short repetition time (TR) and echo time (TE) [turbo field echo (TFE) sequences on clinical Philips scanner] with a high in-plane resolution (TFE-highres), (3) Carte-sian gradient-echo sequence with short TR and TE with a low in-plane resolution (TFE-lowres), (4) a Cartesian TFE sequence with flow compensation and with half-Fourier acquisition (TFE-highres-flowcomp). TFE are gradient echo sequences with very short TE and TR which acquire k-space data while approach-ing steady state. In addition, contiguous short slices coverapproach-ing the entire ventricle length were acquired with the TFE-highres-flow-comp sequence for the four rats whose hearts were excised and weighted just after the MRI session.
All the sequences were synchronized to the ECG but no respi-ratory triggering was used. The animal-specific gating system allowed adaptations of clinical sequences for very high heart rates. Parameters of each sequence are detailed in Table 1.
Image analysis
Image analysis was performed on PowerMac G5 (Apple) using the open-source software OsiriX (http://homepage.mac. com/rossetantoine/osirix/HomePage.html).
Signal-to-noise ratio was measured in the left-ventricle blood, in the interventricular septum (myocardium), and in the muscles of the anterior thoracic wall. Signal intensity (SI) for each struc-ture was averaged inside a manually drawn region of interest (ROI) of at least 20 voxels and then divided by the standard deviation (SD) of the background noise.
Blood–myocardium contrast-to-noise ratio (CNR) was eval-uated according to CNR=[SI(blood)−SI(myocardium)]/ SD(noise). To compare the different sequences, SNR and CNR values were normalized by the voxel size.
For each animal, ejection fraction (EF) was assessed as: Ejection fraction(%) = (Vdiast− Vsyst)/Vdiast.
End-diastolic(Vdiast) and end-systolic (Vsyst) volumes were
calculated by manually drawing endocardial contours and long-axis length at end-diastolic and end-systolic phases for each long-axis. End-diastolic and end-systolic volumes were calculated using the Simpson’s modified method according to:
Volume= (length/2)(Amitral+ (2/3)Aapex)
where Amitral is the diastolic/systolic mitral valve area; Aapex
is the diastolic/systolic area, and length is the diastolic/systolic long-axis length.
Additionally, volumes were calculated by measuring the sur-face differences between blood and myocardium for each contig-uous slice covering the entire ventricle length. Then the surfaces were multiplied by the slice thickness (2 mm) and summed.
Left-ventricle mass (LVM) was calculated according to the product of difference between the left-ventricle blood volume and left-ventricle volume (blood + myocardium) by the volumic mass (1.05µg/µl) of the rat heart.
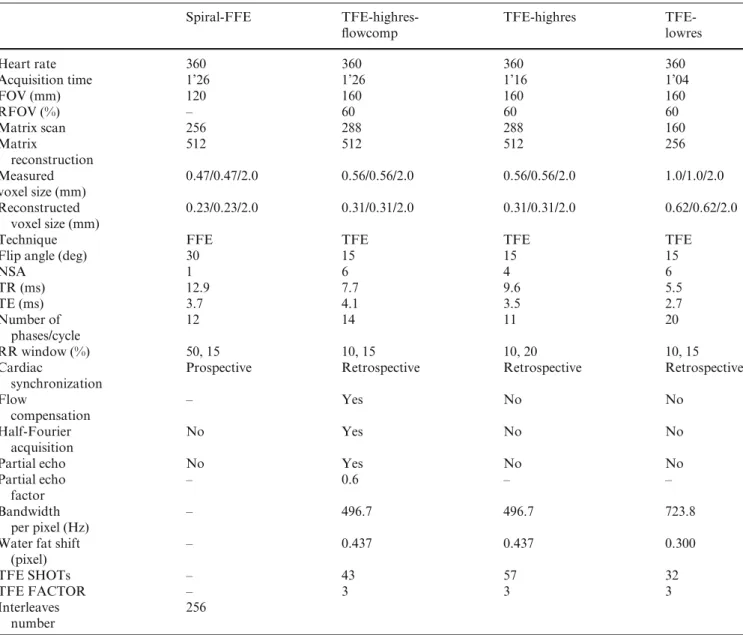
Table 1 Comparison and summary of parameters for sequence acquisition, as well as the rat heart rate
Spiral-FFE TFE-highres- TFE-highres
TFE-flowcomp lowres Heart rate 360 360 360 360 Acquisition time 1’26 1’26 1’16 1’04 FOV (mm) 120 160 160 160 RFOV (%) – 60 60 60 Matrix scan 256 288 288 160 Matrix 512 512 512 256 reconstruction Measured 0.47/0.47/2.0 0.56/0.56/2.0 0.56/0.56/2.0 1.0/1.0/2.0 voxel size (mm) Reconstructed 0.23/0.23/2.0 0.31/0.31/2.0 0.31/0.31/2.0 0.62/0.62/2.0 voxel size (mm)
Technique FFE TFE TFE TFE
Flip angle (deg) 30 15 15 15
NSA 1 6 4 6 TR (ms) 12.9 7.7 9.6 5.5 TE (ms) 3.7 4.1 3.5 2.7 Number of 12 14 11 20 phases/cycle RR window (%) 50, 15 10, 15 10, 20 10, 15
Cardiac Prospective Retrospective Retrospective Retrospective synchronization
Flow – Yes No No
compensation
Half-Fourier No Yes No No
acquisition
Partial echo No Yes No No
Partial echo – 0.6 – –
factor
Bandwidth – 496.7 496.7 723.8
per pixel (Hz)
Water fat shift – 0.437 0.437 0.300
(pixel)
TFE SHOTs – 43 57 32
TFE FACTOR – 3 3 3
Interleaves 256 number
The acquisition time is given for a single slice. FOV field of view; RFOV rectangular field of view; NSA number of signal averaging;
RR window time delay between two R waves of the ECG; TFE SHOTS number of shots in case of multishot acquisition to acquire
all the k-space, depending on the TFE factor; TFE FACTOR percentage of matrix acquired within one TR, defines consequently the number of shots to acquire all the k-space; FFE fast field echo TFE turbo field echo flowcomp flow compensation; highres high resolution; lowres low resolution
Image quality
All images (all frames) were observed in a consensus reading by three investigators in order to score qualitatively image qual-ity obtained from each sequence. The following criteria were used: presence of flow artifact in the ventricles, blood–myocar-dium edge sharpness, and signal homogeneity of myocarblood–myocar-dium. All images were qualitatively assessed on a five points scale [from minus minus (worst) to plus plus (best), passing through zero].
Reproducibility and variability analysis
Each set of data obtained with the TFE-highres-flowcomp sequence was analyzed by three different investigators in tripli-cate to evaluate inter- and intra-observer variability. Each inves-tigator traced by hand the endocardial and epicardial contours for each end-diastolic and end-systolic slice. The left-ventricle length was also manually traced at end-diastole and end-systole. The areas (in cm2) and lengths (in cm) were then gathered and compared statistically.
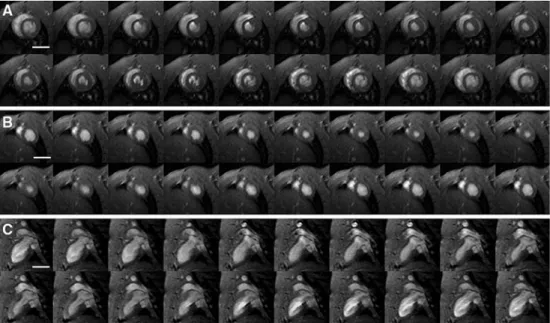
Fig. 1 Representative example of images obtained with turbo field echo (TFE) sequence with flow compensation and half-Fourier acquisition (TFE-highres-flowcomp) for a complete cardiac cycle. The myocardium has a
homogeneous signal during the whole contraction cycle in short axis at mitral (a) and apex (b) level and in long axis (c) and is also well differentiated from the blood. Flowcomp flow
compensation; highres high resolution. Scale bar = 1 cm
A one-way analysis of variance was performed for each mea-surement. A p value inferior to 0.05 was considered significant.
Results
The cine protocols were successfully obtained in all the rats even at high heart rate (371 beats per minute (bpm) ± 57 bpm). An example of the image quality of the cine MR sequences is presented in Fig. 1. A high contrast be-tween the blood and the myocardium was observed in all the series. SNR and CNR values for the left-ventricle blood and myocardium are presented in Table 2. The results of the consensus reading are presented in Table 3. The flow compensation with complex-conjugate recon-struction (half-Fourier acquisition) provided a
homoge-Table 2 Signal-to-noise ratio (SNR) for blood of left ventricle and myocardium and contrast-to-noise ratio (CNR) between blood of left ventricle and myocardium per voxel volume unit (mean± SD)
Spiral-FFE TFE-highres- TFE- TFE-flowcomp highres lowres SNR blood LV 367± 52 265± 35 265± 40 307 ± 78 SNR 153± 28 133± 19 153± 26 135 ± 37
myocardium
CNR blood 214± 48 133± 40 112± 55 173 ± 43 myocardium
Only the spiral-FFE sequence shows a statistical difference for the parameters SNR blood LV ( p < 0.007) and CNR blood myocardium ( p < 0.015) compared to the TFE-flowcomp and the TFE sequences. FFE fast field echo; TFE turbo field echo,
flowcomp flow compensation, highres high resolution; lowres low
resolution
Table 3 Qualitative comparison of flow artifacts, myocardium edge sharpness, and homogeneity for each sequence obtained from a con-sensus reading
Flow Myocardium Myocardium artifact sharpness homogeneity
Spiral-FFE + ++ ++
TFE-highres- ++ ++ ++ flowcomp
TFE-highres − + −
TFE-lowres + − +
The ‘+’ always represents the best image quality for each cri-teria analyzed (++: best image quality, –: worst image quality). FFE fast field echo; TFE turbo field echo; flowcomp flow compensation; highres high resolution; lowres low resolution
neous signal in the left cavity. Absence of flow artifacts in the left cavity was also observed in the low-resolution TFE sequence and to a lesser extent in the spiral-FFE sequence with flow compensation but without complex-conjugate reconstruction. The TFE-highres sequence was degraded by an important flow artifact inside the cav-ities, as can be seen in Fig. 2. From consensus read-ing, the best sequence was the Cartesian TFE with both flow compensation and complex-conjugate reconstruc-tion (TFE-highres-flowcomp). Using this sequence, high-resolution images with sharp borders between the blood and myocardium were constantly obtained, which was not the case for the other sequences, as demonstrated in Figs. 1, 2, and 3.
Diastolic and systolic volumes as well as the ejection fraction were measured for all MR sequences using the modified Simpson method and by summation of
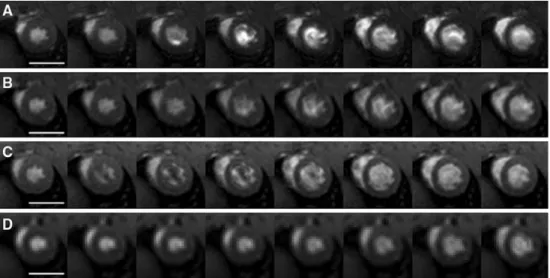
contig-Fig. 2 Representation of the flow artifacts from a systole to a diastole (selection of eight phases) for spiral-FFE (a), TFE-highres-flowcomp (b), TFE-highres (c), and TFE-lowres (d). TFE-highres-flowcomp sequence shows a uniform blood signal. The flow-artifact intensity in the spiral sequence is more pronounced in the early diastole. Note also a pronounced artifact in the TFE-highres (c) acquisition. The flow is more homogeneous for the TFE-lowres at the expense of low spatial resolution. FFE fast field echo; TFE turbo field echo; flowcomp flow compensation; highres high resolution; lowres low resolution. Scale bar = 1 cm
Fig. 3 Rat heart imaged with sequences spiral-FFE (a), TFE-highres-flowcomp (b), TFE-highres (c), and TFE-lowres (d). Diastolic and systolic phases are represented for the short axis (mitral: row 1, and apex: row 2) and the long axis (row 3). The spiral-FFE sequence (a) shows a greater contrast comparing to the TFE-highres-flowcomp (b, c), but the septum is partially delineated due to flow artifact. Even though a good contrast for the TFE-lowres acquisition (d), the sharpness of the image obtained is not satisfactory. Hence the turbo field echo sequences (b, c) are of great interest. Moreover, the flow compensation for b decreases dramatically the flux artifacts. FFE fast field echo, TFE turbo field echo, flowcomp flow compensation, highres high resolution, lowres low resolution. Scale bar = 1 cm
uous slices for the TFE-highres-flowcomp sequence. The results are presented in Table 4. No significant differences were found between the four sequences ( p > 0.05).
For each MRI sequence the left-ventricle mass was compared with the left-ventricle wet weight obtained dur-ing autopsy (Table 5). There were no significant differ-ences between the MR-calculated volume and real volume as assessed by autopsy.
From the statistical analysis of the inter- and intra-observer measurements variability was very small. In-deed, the standard errors of mean were between 1.12% and 4.73% for intra-observer variability and between
1.57% and 3.90% for inter-observer variability for the sequence chosen.
Discussion
This work demonstrates that high spatial and temporal resolution images of rat cardiac cine can reliably be ob-tained on a clinical 1.5-T MR system and can yield accu-rate cardiac function estimates. Moreover, the acquisition is reproducible. The current in-plane resolution retained in this study was 0.31 mm after zero-filling (0.56 mm
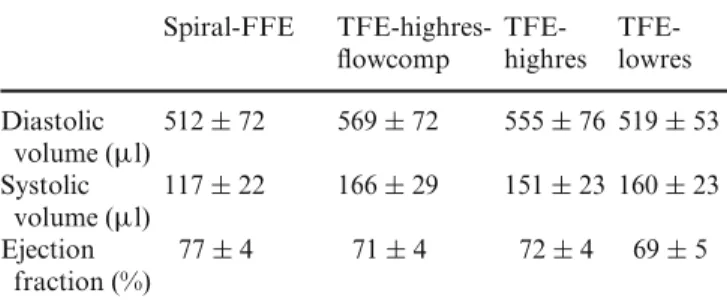
ac-Table 4 Values of diastolic, systolic volumes and the ejection frac-tion measured and calculated for each sequence (mean± SD)
Spiral-FFE TFE-highres- TFE- TFE-flowcomp highres lowres Diastolic 512± 72 569± 72 555± 76 519 ± 53 volume (µl) Systolic 117± 22 166± 29 151± 23 160 ± 23 volume (µl) Ejection 77± 4 71± 4 72± 4 69± 5 fraction (%)
FFE fast field echo; TFE turbo field echo; flowcomp flow
com-pensation; highres high resolution; lowres low resolution
Table 5 Heart mass values in four rats
LV mass (g) Spiral-FFE 0.80± 0.08 TFE-highres-flowcomp 0.76± 0.15 TFE-highres 0.72± 0.12 TFE-lowres 0.63± 0.15 TFE-flowcomp whole heart 0.71± 0.18
Autopsy 0.82± 0.07
The weight was evaluated for each MRI sequence and compared with wet weight assessed through autopsy (mean± SD). There were no significant differences between the measurements obtained with MRI against real weight (T test). FFE fast field echo; TFE turbo field echo; flowcomp flow compensation; highres high resolution; lowres low resolution; whole heart MRI slices 2 mm thick along the long heart axis
quired) with a temporal resolution allowing the imaging of 14 phases per heart beat for a heart rate of 360 bpm. A similar resolution of 0.5 mm with 10–14 phases per heart beat has already been obtained on a clinical 1.5-T MR system in the mouse [18]. However, no detailed indi-cations on the sequence parameters (such as acquisition time, repetition time, echo time, bandwidth, or interpo-lation) and no validation of the method were provided in this preliminary study. It should be emphasized that in cardiac cine imaging spatial resolution is closely re-lated to temporal resolution. For a fixed acquisition time, spatial resolution can be increased by reducing the num-ber of cardiac phases imaged. For cardiac cine at 1.5-T, higher in-plane resolution of 0.19 mm in mice [15, 16] or 0.35 mm in the rat [17] have been used. The matrices were obtained at the expense of temporal resolution since the number of cardiac phases of the cine was limited to five or six. To maintain a high number of heart phases, we kept the repetition time as short as possible (7.7 versus 39 ms in the Franco et al. protocol) by increasing the field of view (FOV) and compensated the loss of SNR by
averaging. This strategy yields a high resolution in both the spatial and temporal dimensions while maintaining a reasonably short acquisition time per slice (less than 1.5 min). It should be emphasized that the number of phases could be easily increased if needed by reducing the TFE factor (percentage of matrix acquired within one TR) from three to one or by using the option of phase sharing during the reconstruction [19, 20].
A low in-plane resolution (reconstructed: 0.62 × 0.62 mm, acquired: 1.00× 1.00 mm) was tested to increase the number of phases: 20 phases per cardiac cycle were obtained at a cardiac frequency of 360 bpm with a high CNR. However, the resulting low resolution appears as a limiting factor for myocardium segmentation in compar-ison to others sequences [21].
The resolution achieved in this study (with a heart diameter of 15 mm for the rat [6]) has to be compared to values obtained in the human heart which is almost seven times larger in diameter (approximately 100 mm) [6]: 2.2 × 1.4 mm2in-plane resolution for standard cine sequence and 4.2 × 2.7 mm2 for real-time cine [22] for human studies and 0.31× 0.31 mm2in this study. There-fore, the spatial resolution in the rat, normalized to heart diameter is between the resolution of the standard cine and the real-time cine.
The typical resolution of high-field MR systems ded-icated to small animals is 0.39 mm with 11–12 cardiac phases per heart beat at 4.7-T [10], or 0.23 mm with 12 frames per heart cycle at 7.05-T [12, 13]. The spatial reso-lution obtained on our clinical MR scanner without losing temporal resolution is lower than the spatial resolution that can be achieved with small-animal dedicated sys-tems, but yet enables sufficient image quality to accurately delineate heart contours.
Regarding the choice of the MR sequences, in order to suppress flow artifacts, it was important to use flow compensation (gradient moment nulling of the first or-der). The use of a clinical scanner (i.e., 1.5-T) implies longer gradient rise time compared to high-field systems, hence imposing longer acquisition times. Consequently, the system is more sensitive to flow artifacts which justifies the use of the flow-compensation parameter. The TFE-highres-flowcomp sequence with this correction exhib-ited a homogeneous blood signal in ventricles, as shown in Fig. 2.
Using a spiral sequence, higher resolution as well as high blood-to-myocardium contrast can be obtained ( p < 0.02) (Table 2). However, flow artifacts at the blood–myocardium interface were often present in sys-tole (Figs. 2, 3). This result was at first surprising as spiral sequences are known to be more robust to flow arti-facts due to the intrinsic gradient moment-nulling of the sequence. In our sequence, the high number of spiral inter-leaves (256) decreases drastically the number of rotations per spiral. The resulting trajectory covers less than one
quarter of k-space and does no longer have the gradient moment-nulling property.
We did not evaluate balanced steady-state free-pre-cession sequence (True Fisp on Siemens MR scanners) that is one of the reference MR sequences for cardiac cine in patients. In our studies, True Fisp imaging on the rat heart was degraded by severe banding artifacts that could not be resolved by the shim available on our MR system. Flow artifacts that may be related to off-resonance effects [23] were also present.
Due to the high image quality of the TFE-highres-flowcomp sequence, the variation of measurements was very small (Table 4), and the measurements were compa-rable to published data [17, 24]. The low inter- and intra-observer variability of the heart function measurements demonstrates the reproducibility and feasibility of deter-mining physiological characteristics of the myocardium with a 1.5-T MR system, indicating that this protocol yields robust measurements.
The following physiological values are presented in Tables 4 and 5 and are in agreement with previous studies made at different field strengths (from 1.5 to 7-T): the ejec-tion fracejec-tion [10, 12, 17, 25], left-ventricular diastolic [10] and systolic volumes [10, 26], and left-ventricular mass [10, 13, 25].
This study demonstrated an efficient protocol to mea-sure in less than 30 min the cardiac function of rat on
a clinical 1.5-T MR system. In view of the availability of such systems installed in cardiac research centers, small-animal cardiovascular research may progress rapidly in the near future. However, high-resolution imaging us-ing other cardiac MR sequences (such as tag, perfusion, or late enhancement) needs to be implemented in future work.
Conclusion
We performed a systematic comparison of fast gradient-echo cine sequences in the rat. The best MR sequence was the TFE-highres-flowcomp MR sequence with flow com-pensation and complex-conjugated reconstruction, yield-ing high temporal and spatial resolution. As reproducible images of cardiac cine were obtained in the rat, we dem-onstrated that a clinical 1.5-T MR system successfully monitors cardiac function of small animals.
Acknowledgments We thank the National Swiss Foundation
(Grant PPOB-68778), the Leenaards Foundation and the Department of Radiology of the Geneva University Hospital for financial support, as well as A. Cernicanu and J. Diaper for correcting the manuscript for English language.
References
1. Earls JP, Ho VB, Foo TK, Castillo E, Flamm SD (2002) Cardiac MRI: recent progress and continued challenges. J Magn Reson Imaging 16:111–127 2. Pujadas S, Reddy GP, Weber O, Lee
JJ, Higgins CB (2004) MR imaging assessment of cardiac function. J Magn Reson Imaging 19:789–799
3. Gotte MJ, van Rossum AC, Twisk JWR, Kuijer JPA, Marcus JT, Visser CA (2001) Quantification of regional contractile function after infarction: strain analysis superior to wall thickening analysis in discriminating infarct from remote myocardium. J Am Coll Cardiol 37:808–817
4. Sensky PR, Jivan A, Hudson NM, Keal RP, Morgan B, Tranter JL, de Bono D, Samani NJ, Cherryman GR (2000) Coronary artery disease: combined stress MR imaging protocol-one-stop evaluation of myocardial perfusion and function. Radiology 215:608–614 5. Pennell DJ, Sechtem UP, Higgins CB,
Manning WJ, Pohost GM, Rademakers FE, van Rossum AC, Shaw LJ, Yucel EK (2004) Clinical indications for cardiovascular magnetic resonance (CMR): Consensus Panel report. Eur Heart J 25:1940–1965
6. Brau AC, Hedlund LW, Johnson GA (2004) Cine magnetic resonance microscopy of the rat heart using cardiorespiratory-synchronous projection reconstruction. J Magn Reson Imaging 20:31–38
7. Saeed M, Watzinger N, Krombach GA, Lund GK, Wendland MF, Chujo M, Higgins CB (2002) Left ventricular remodeling after infarction: sequential MR imaging with oral nicorandil therapy in rat model. Radiology 224:830–837
8. Yang Z, Berr SS, Gilson WD, Toufektsian MC, French BA (2004) Simultaneous evaluation of infarct size and cardiac function in intact mice by contrast-enhanced cardiac magnetic resonance imaging reveals contractile dysfunction in noninfarcted regions early after myocardial infarction. Circulation 109:1161–1167
9. Williams SP, Gerber HP, Giordano FJ, Peale FVJr. Bernstein LJ, Bunting S, Chien KR, Ferrara N, van Bruggen N (2001) Dobutamine stress cine-MRI of cardiac function in the hearts of adult cardiomyocyte-specific VEGF
knockout mice. J Magn Reson Imaging 14:374–382
10. Thomas D, Ferrari VA, Janik M, Kim DH, Pickup S, Glickson JD, Zhou R (2004) Quantitative assessment of regional myocardial function in a rat model of myocardial infarction using tagged MRI. Magn Reson Mater Phys 17:179–187
11. Epstein FH, Yang Z, Gilson WD, Berr SS, Kramer CM, French BA (2002) MR tagging early after myocardial infarction in mice demonstrates contractile dysfunction in adjacent and remote regions. Magn Reson Med 48:399–403
12. Nahrendorf M, Wiesmann F, Hiller KH, Hu K, Waller C, Ruff J, Lanz TE, Neubauer S, Haase A, Ertl G, Bauer WR (2001) Serial cine-magnetic resonance imaging of left ventricular remodeling after myocardial infarction in rats. J Magn Reson Imaging 14:547–555
13. Nahrendorf M, Hiller KH, Greiser A, Kohler S, Neuberger T, Hu K, Waller C, Albrecht M, Neubauer S, Haase A, Ertl G, Bauer WR (2003) Chronic coronary artery stenosis induces impaired function of remote myocardium: MRI and spectroscopy study in rat. Am J Physiol Heart Circ Physiol 285:H2712–H2721
14. Chapon C, Franconi F, Lemaire L, Marescaux L, Legras P, Saint-Andre JP, Denizot B, Le Jeune JJ (2003) High field magnetic resonance imaging evaluation of superparamagnetic iron oxide nanoparticles in a permanent rat myocardial infarction. Invest Radiol 38:141–146
15. Franco F, Dubois SK, Peshock RM, Shohet RV (1998) Magnetic resonance imaging accurately estimates LV mass in a transgenic mouse model of cardiac hypertrophy. Am J Physiol
274:H679–H683
16. Franco F, Thomas GD, Giroir B, Bryant D, Bullock MC, Chwialkowski MC, Victor RG, Peshock RM (1999) Magnetic resonance imaging and invasive evaluation of development of heart failure in transgenic mice with myocardial expression of tumor necrosis factor-alpha. Circulation 99:448–454
17. Jones JR, Mata JF, Yang Z, French BA, Oshinski JN (2002) Left ventricular remodeling subsequent to reperfused myocardial infarction: evaluation of a rat model using cardiac magnetic resonance imaging.
J Cardiovasc Magn Reson 4:317–326 18. Oh YS, Thomson LE, Fishbein MC,
Berman DS, Sharifi B, Chen PS (2004) Scar formation after ischemic myocardial injury in MRL mice. Cardiovasc Pathol 13:203–206 19. Foo TK, Bernstein MA, Aisen AM,
Hernandez RJ, Collick BD, Bernstein T (1995) Improved ejection fraction and flow velocity estimates with use of view sharing and uniform repetition time excitation with fast cardiac techniques. Radiology 195:471–478
20. Markl M, Schneider B, Hennig J (2002) Fast phase contrast cardiac magnetic resonance imaging: improved assessment and analysis of left ventricular wall motion. J Magn Reson Imaging 15:642–653
21. Roussakis A, Baras P, Seimenis I, Andreou J, Danias PG (2004) Relationship of number of phases per cardiac cycle and accuracy of measurement of left ventricular volumes, ejection fraction, and mass. J Cardiovasc Magn Reson 6:837–844
22. Lee VS, Resnick D, Bundy JM, Simonetti OP, Lee P, Weinreb JC (2002) Cardiac function: MR evaluation in one breath hold with real-time true fast imaging with steady-state precession. Radiology 222:835–842
23. Storey P, Li W, Chen Q, Edelman RR (2004) Flow artifacts in steady-state free precession cine imaging. Magn Reson Med 51:115–122
24. Plein S, Bloomer TN, Ridgway JP, Jones TR, Bainbridge GJ, Sivananthan MU (2001) Steady-state free precession magnetic resonance imaging of the heart: comparison with segmented k-space gradient-echo imaging. J Magn Reson Imaging 14:230–236
25. Nahrendorf M, Hu K, Fraccarollo D, Hiller KH, Haase A, Bauer WR, Ertl G (2003) Time course of right ventricular remodeling in rats with experimental myocardial infarction. Am J Physiol Heart Circ Physiol 284:H241–H248 26. Wise RG, Huang CL, Gresham GA,
Al-Shafei AI, Carpenter TA, Hall LD (1998) Magnetic resonance imaging analysis of left ventricular function in normal and spontaneously hypertensive rats. J Physiol 513(Pt. 3):873–887