Mapping Texture Domains in Quartzite Microstructures
R
ENÉEH
EILBRONNERGeological Institute, Department of Environmental Sciences, Basel University, Bernoullistrasse 32, CH-4056 Basel, Switzerland
Email: [email protected]
Abstract: The paper is concerned with the combined application of two methods for microstructure and texture analysis:
(1) optical orientation and misorientation imaging and (2) autocorrelation function (ACF). Using two different samples, the usefulness of the methods and the quality of the results are discussed. One sample is a quartzite layer from the limb of a small scale fold in the Suretta Nappe (Val Avers, Switzerland) which was deformed under upper greenschist conditions, the other is a sample of Black Hills quartzite, experimentally sheared in dislocation creep. Using the method of computer-integrated polarization microscopy (CIP), c-axis orientation and misorientation images were prepared and pole figures were calculated from the azimuth and inclination images. Misorientation images were prepared and analyzed in a number of ways: (1) In as much as misorientation images constitute texture maps, they visualize the geometry and spatial distribution of texture domains; they show if the texture domains are spatially coherent, i.e., if the rock is domainal or not. (2) Thresholded misorientation images allow the calculation of the volume fraction of texture domains, which is a means of estimating the texture intensification independent of the shape of the pole figure skeleton. (3) From the ACF of thresholded misorientation images the average grain size and shape in those domains can be derived. (4) From the shape of the domains (if they exist as spatial entities), the strain or strain partitioning as well as the rheological contrast can be estimated. The paper seeks to demonstrate the importance of localized texture analysis. The aim is to discuss the quality of the results that can be obtained. The samples were chosen because one is domainal the other one is not. A full discussion of the geological implications of the results of the analysis is outside the scope of this contribution.
Keywords: Quartz microstructure, Image analysis, Orientation imaging, Texture domains, Pole density.
microscopy, electron back scatter diffraction, digital image analysis and visualization software (orientation imaging) have provided us with powerful tools for the representation and quantification of microstructures and textures of geomaterials (see, e.g., Adams et al. 1993; Kunze et al. 1995; Trimby et al. 1998; van Daalen et al. 1999; Prior et al. 1999; Stipp et al. 2002; Piazolo et al. 2004; Halfpenny et al. 2006, and many others). Using these methods, textures can be mapped at the microscale and thus the spatial distribution of physical states and properties in rocks can be visualized. Through statistical, wavelet, fractal and many other methods for microstructure analysis (e.g. Turcotte, 1989; Darrozes et al. 1997; Panozzo Heilbronner, 1992; deRonde et al. 2004, and many others), some of the limitations of classical strain analysis (e.g., Ramsay, 1967; Means, 1976; Ramsay and Huber, 1983) have been overcome, especially in the many cases where the deformed rocks are dynamically recrystallized and hence strain markers are absent.
In this contribution, textural domains of a monophase rock we will be considered. In particular, the c-axis preferred
INTRODUCTION
If it is assumed that different deformation mechanisms produce different types of texture i.e., crystallographic preferred orientation (CPO) and if it is further assumed that different deformation mechanisms obey different flow laws, then a domainal rock consisting of distinct texture domains – even if it is a mineralogical monophase – may be viewed as a rheological polyphase. According to the spatial distribution and connectivity of the texture domains, the latter may act as interconnected weak layers or they may be present as isolated passively deforming pods. In other words, in heterogeneously deforming rocks, the bulk behaviour depends on the rheology of the individual (rheological) phases, i.e., domains, their relative volume fractions and on the relative geometry or topology of the domains. Bulk behaviour, or bulk properties, can only be calculated and extrapolated if – apart from knowing the flow laws of the individual phases – the individual domains are identified and their spatial distributions are mapped.
In the past decade, significant developments in electron
orientations of different domains in experimentally and naturally deformed and dynamically recrystallized quartzites will be analyzed. Using the CIP method (computer-integrated microscopy, Panozzo Heilbronner and Pauli, 1993, Heilbronner, 2000) and the ACF analysis (autocorrelation function, Panozzo Heilbronner, 1992), different textural domains will be identified and separated and the associated grain and domain shapes will be studied. Bulk textures and microstructures will be shown to be different from the local textures (crystallographic preferred orientations) and microstructures (domain size and shape) of the individual domains.
The aim of this contribution is two-fold: firstly, the combined application of two modern methods of micro-structure analysis, orientation imaging and analysis of the autocorrelation function, is to be demonstrated, using, but not reviewing previously published papers. Secondly, the concept of texture domains is to be discussed, in particular the geometry and spatial arrangement of texture domains as well as their significance relative to bulk crystallo-graphic preferred orientations.
SAMPLE DESCRIPTION
Two samples of dynamically recrystallized quartzite were analyzed (Fig.1). One sample - Su110c - is from the limb of a small scale fold in the Suretta Nappe, Switzerland (Stünitz et al. 1993) and one sample - w935 - is an experimentally deformed Black Hills quartzite (Heilbronner and Tullis, 2006). The Suretta quartzite (SuQ) consists of approximately 95% quartz with some feldspar and mica. The sample was collected near Cröt in Val Madris, Switzerland from an F2 fold in a quartzite directly overlying the Triassic conglomerate above the granitoid basement (for tectonic context, see Schreurs, 1993). The sample was deformed at upper greenschist facies conditions. The sample is 100% recrystallized with an average grain diameter, d, of ~120 µm as the result of dynamic recrystal-lization (dominated by subgrain rotation as described by Stipp et al. 2002, possibly equivalent to regime 2 dislocation creep as described in Hirth and Tullis, 1992) and some partial annealing. From the fold shape, from multiple folding and the overall intensive deformation of the
Fig.1. (a), (b) Photomicrographs (circular polarization) of the analyzed areas. (c), (d) structural sketch of sample and c-axis pole figure
with grey levels corresponding to linear increments of 1 times uniform. (a), (c) folded quartzite layer of the Suretta Nappe, sample Su110c. (b), (d) experimentally deformed Black Hills quartzite, sample w935. Inset: Structural coordinates used in this paper: X, L = lineation; Z, FN = foliation normal; Y = transverse direction; orientations are measured in a 180° . 180° half space as indicated; image plane is X-Z.
Suretta Nappe, it is inferred that the sample strain is high. The Black Hills quartzite (BHQ) is nearly 100% pure. A 1 mm thick slice of the material with an original grain size of d ~100µm was introduced between forcing blocks of Brazil quartz precut at 45°. The sample was experimentally sheared in a Griggs triaxial deformation apparatus at 900°C, 1.25 GPa confining pressure and a strain rate of 10-5 s-1 to a total shear strain of J | 6 (for
details, see Heilbronner and Tullis, 2006). The deformation mechanism was regime 3 dislocation creep (Hirth and Tullis, 1992) producing a sample that is 90% recrystallized with an average grain size of d ~ 17 µm.
The thin sections lie in planes that contain the lineation, L, and the foliation normal, FN, or the compression axis, Z, and the displacement direction, X. For the analysis, they are oriented such that the overall shear sense in the X-Z plane is sinistral (see inset in Fig.1). Note that the photomicrographs (Figs.1 a, b) are taken under circular polarized conditions, such that the grey level depends only on the inclination of the c-axis with respect to the plane of the thin section, not on the azimuthal orientation as would be the case under crossed polarizers. Black grains (or pixels) have their c-axes normal to the image plane, and white grains (or pixels) have their c-axes parallel to the image plane.
On the basis of the slightly asymmetric skeleton, the pole figure of the SuQ is interpreted as representing pure shear with a simple shear component (Schmid and Casey, 1986). The pole figure of the BHQ is a single girdle typical for simple shear with a strong maximum in the Y direction typical for high strain regime 3 dislocation creep (Figs.1 c, d).
METHODS OF ANALYSIS Computer-Integrated Polarization Microscopy
For the analysis, thin sections of approximately 25 µm thickness were prepared to ensure that quartz appears with a first order grey colour as required by the method of computer-integrated polarization microscopy (CIP, Panozzo Heilbronner and Pauli, 1993). Images were captured on a Zeiss polarization microscope using a Zeiss Axiocam MRm monochromatic camera and a narrow band interference filter transmitting at 660±9 nm. To prepare the CIP input, the current version of the freeware Image SXM (Barrett, 2002, http://www.liv.ac.uk/~sdb/ImageSXM/) was used. More details on the CIP method can be found elsewhere (Heilbronner, 2000, http://www.unibas.ch/earth/micro/).
The CIP method was used to calculate c-axis orientation images (COIs), which colour-code the c-axis orientation at each pixel, to derive c-axis pole figures (Figs.1 c, d) and to
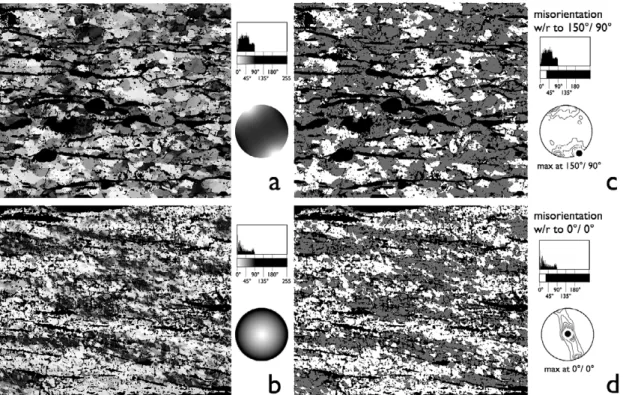
calculate c-axis misorientation images, showing the angular deviation of the c-axis at each pixel with respect to a selected reference direction. The CIP software is available from the website of the author (http://www.unibas.ch/earth/micro); it is also available as a specialist menu in the Image SXM software (http://www.liv.ac.uk/~sdb/ImageSXM/). The reference directions used for the calculation of the misorientation images are the orientations of primary and secondary maxima selected on the pole figures. On each of the images (Figs.2 a,b), pixels appear white if their c-axis orientations coincide with the orientation of the corresponding pole figure maximum; they are black if the deviation is 90°, i.e., the maximum angle that is possible between two non-polar directions. Thresholding the misorientation images at a grey level that corresponds to an angle of 30°, for example, yields images that show those pixels in white whose c-axes are oriented within 30° of the pole figure maximum (Figs. 2 c,d). Of course, any other cut-off angle can be used, as will be shown, the maximum opening angle is 90°. Note that the (non-polar) orientations are represented in a 180°.180° half space (inset, Fig.1): the azimuth runs from 0° (North, positive Z) clockwise to 180° (South, negative Z), and the inclination from 0° (image normal, positive Y) to 180° (image normal, negative Y). Directions parallel to the image plane have an inclination of 90°.
Counting the pixels of a given domain in the misorientation image yields the area fraction and thus the volume density of the domain:
Vdomain/ Vtotal = Adomain/ Atotal = Ndomain/ Ntotal (1) where,
Ntotal = Nimage - Nmask (2) V is the volume, A the area and N the number of pixels of the domain or the total sample area. The results are listed in Table 1. For stereological aspects, see Underwood (1970). The number fraction of pixels increases with the opening angle, i.e., with the threshold value; it is 100% for 90°.
For volume determinations two misorientation images were calculated for each sample: in the case of BHQ, the reference directions are (0° / 0°) and (160° / 90°); in the case of the SuQ, (15° / 90°) and (150°/90°). The mis-orientation images were thresholded at 15°, 20° and 30°. The volume densities of the domains were divided by 3.41, 6.03 and 13.4, respectively, to obtain the intensification factors with respect to uniform in the 15°, 20° and 30° cones (Tables 1 and 2).
In order to create images of polymaximal domains (Pauli et al. 1996), thresholded misorientation images of a number
of (single maximum) domains can be added. In Image SXM this is done using a logical AND addition if the (thresholded) domains are white. In the case of the SuQ, two subdomains at 15°/ 80° and 15° /100°, and two subdomains at 150°/ 75° and 150°/ 90°, all thresholded at 20°, were combined to form two domains in the antithetic and synthetic direction, respectively (Fig.3a). A cone with an opening angle of 20° was chosen in order to ensure that the antithetic and the synthetic domains, at 15° and 150° azimuth, respectively, do not overlap. Since the maxima are only 45° (of azimuth) apart, an opening angle of 30° would have been too large. In the case of the BHQ, the Y and basal texture domains, at
0°/ 0° and 160°/ 90°, respectively, are normal to each other and therefore the 30° cones do not intersect (Fig.4).
Autocorrelation Function Analysis
From the thresholded misorientation images (Figs.3a and 4a), the autocorrelation functions (ACFs) of the texture domains were calculated using the Process menu of Image SXM (http://www.liv.ac.uk/~sdb/ImageSXM/). For an introduction to the ACF analysis and applications to deformed rocks, see Panozzo Heilbronner (1992). The 'x-'z coordinate system of the ACF has the same dimensions as the X-Z coordinate system of the image (see
Fig.2. (a), (b) c-axis misorientation images calculated with respect to the direction of the pole figure maximum; to the right: misorientation
histograms and stereographically projected look-up tables. Black = mask blocking dust, other (non-quartz) minerals, holes, etc. from analysis. (c), (d) Thresholded misorientation images: black = mask, white = texture domain, i.e., pixels with c-axis orientation within 30° cone about reference direction; to the right: c-axis misorientation histograms and c-axis pole figure with the orientation of the maximum highlighted. (a), (c) folded quartzite layer of the Suretta Nappe, sample Su110c. (b), (d) experimentally deformed Black Hills quartzite, sample w935.
Table 1. Volume densities for texture domains. Column 4-6: Area percent of domains are calculated for
opening angles of 30°, 20° and 15°. Column 7-9: Intensification is with respect to 13.4%, 6.03% and 3.41%, densities that correspond to the uniform distribution (see Table 2)
Sample Domain Reference 30° d. 20° d. 15° d. 30° d. 20° d. 15° d. direction (area%) (area%) (area%) (factor) (factor) (factor) su110c synthetic 150°/ 90° 35.0 20.5 13.6 2.61 3.40 3.99 su110c antithetic 15°/ 90° 28.0 15.5 9.71 2.09 2.57 2.85
W935 Y 0°/ 0° 55.0 40.7 30.7 4.10 6.74 9.01
inset, Fig.1); the ACF permits simultaneous analysis at small and large correlation lengths, i.e., of small and large features in the image. The ACFs of the texture domains of the SuQ and the BHQ are shown as grey level images with 8 evenly spaced grey levels, i.e., correlation levels, from white (zero correlation) of the background to black (maxi-mum correlation) at the center of the ACF (Figs. 3c, 4c). The
value of the ACF represents strength of autocorrelation at given correlation distances 'x/'z. For small 'x/'z, near the center of the ACF, the correlation is high and the shape and size of the contours represent relatively small features in the image, such as grains and subgrains. At larger'x/'z, the correlation is lower and the shape and size of the contours represent relatively larger features in the image, such as grain aggregates or texture domains. See Heilbronner (2002) and Heilbronner and Tullis (2006) for a detailed discussion on how to choose the appropriate ACF levels for shape and size analysis.
Here, the ACFs were thresholded at two levels: at 3/8 of the maximum ACF (ACFmax) to capture the average grain size and shape, and at 1/8 ACFmax to represent the texture domains, if present. The size of these contours is quantified by the area equivalent diameter, dequ (the diameter of a sphere with the same area as the contour)
dequ = 2 . (measured area/S) (3) and by the long diameter of the best fit ellipse, a. The shape is further characterized by the aspect ratio R of the best fit ellipse and the angle M of its long axis with respect to the horizontal. Results are listed in Table 3. The monoclinic shape or the orientation of the long axis with respect to the
Fig.3. (a) Texture domains of sample Su 110c (natural sample) calculated for directions indicated in (b). For the antithetic and synthetic
texture domains, two cones each, with an opening angle of 20°, are combined. (b) c-axis pole figures with reference directions indicated. (c) Autocorrelation functions of texture domains, magnified w/r to (a), see scale bar; contour levels at 1/8 increments of maximum ACF peak height.
Table 2. Orientation densities of the uniform orientation distribution
calculated for circular cones with different opening angles. Orientations are non-polar, i.e., the half space corresponds to 100%. Opening Density angle (°) (%) 0 0.00 5 0.38 10 1.52 15 3.41 20 6.03 22.5 7.61 30 13.4 45 29.3 60 50.0 75 74.1 90 100.0
displacement direction may be used to infer the sense of shear (Panozzo Heilbronner, 1992).
RESULTS AND DISCUSSION
In this section, the results of the analyses are presented. The discussion concerns primarily the applications of the methods and the quality of the results that were achieved.
Using Misorientation Images for the Visualization of Texture Domains
Texture domains are visualized by creating mis-orientation images where the reference directions are selected on the pole figure. In the case of the SuQ, high pole densities occur in a direction synthetic with the sinistral shear (150° azimuth) and in a direction antithetic to it (15° azimuth), called the synthetic and antithetic texture domain, respectively (Figs. 2c and 3). In the case of the BHQ a strong maximum appears in the Y direction (0°/ 0°) and a secondary one near the periphery of the pole figure at 160° azimuth, the Y and basal domain, respectively (Figs. 2d and 4).
Comparing the texture domains of the SuQ and the BHQ (compare Figs. 2c, 2d, 3a and 4a), three aspects are immediately obvious. (a) The domains have large white area
fractions, i.e., high volume densities, if the corresponding maximum on the pole figure is high, and small white area fractions, i.e., low volume densities, where the pole figures show relatively low maxima. (b) The SuQ shows similar area fractions of homogeneously dispersed, individual grains for both texture domains (synthetic and antithetic), while w935 shows large areas of coalesced recrystallized grains for the Y domain, and much smaller such areas for the basal domain. (c) In the SuQ, the grains of the texture domains are homogeneously distributed in the image plane (in space) whereas, in the case of the BHQ, the recrystallized grains, particularly of the Y domain, form large coalesced clusters. In other words, the texture domains of the SuQ do not form spatially coherent domains, while the BHQ is clearly domainal.
Volume Density of Texture Domains and Pole Figure Maxima
In a perfectly random texture, the orientation distribution of c-axes is uniform; in other words, the orientation density is constant in all directions. As the c-axes determined by optical means (CIP method) have no polarity, an orientation half space is assumed. For the uniform orientation distribution, the fractions of c-axes present in circular
Fig.4. (a) Texture domains of sample w935 (experimental sample) calculated for directions indicated in (c). For Y and basal texture
domains, single cones with opening angles of 30° are used. (b) c-axis pole figures with reference directions indicated.
(c) Autocorrelation functions of texture domains, magnified w/r to (a), see scale bar; contour levels at 1/8 increments of maximum
cones of different opening angles can be calculated (Table 2).
Using thresholded misorientation images, the relative area fraction of pixels in texture domains, as described above can be determined. For a perfectly random texture, the area fraction, and hence the volume density, depends on the opening angle, as listed in Table 3. Choosing angles of 15°, 20° or 30°, the uniform densities are 3.41%, 6.03% or 13.4%, respectively. If the measured area fraction of a given domain is higher than the corresponding uniform value, it means that the density in this domain is increased, the factor of intensification can be determined.
In the SuQ, the synthetic and antithetic texture domains have similar volume densities, implying similar intensifications (Table 1). Note that the intensification of the synthetic domain increases with decreasing opening angle from 2.6 (30°) to 3.4 (20°) to 4 times (15°); the corresponding pole figure maximum of 6.8 (Fig. 1c) was calculated for 5° bins. In the antithetic domain it increases from 2.09 (30°) to 2.57 (20°) to 2.85 times (15°); the corresponding secondary maximum is > 4.0 as can be estimated from the contours of the pole figure (Fig. 1d).
The intensification factors in the Y and basal domain of the BHQ differ widely (see Table 1). Volume densities of texture domains have been calculated previously, for “orientation tracking” in a study of experimentally sheared BHQ (Heilbronner and Tullis, 2006). The sample w935 analyzed here is the same as the one analyzed by Heilbronner and Tullis (2006), where, in a square cone of 30° by 30° (which is slightly wider than a circular cone with an opening angle of 15°), an intensification of 8 times was noted as opposed to an intensification of 9.01 times within the 15° circular cone determined here. Increasing densities for decreasing opening angles reflect the circumstance that the pole density is not uniform in any of the circular or square cones but higher near the center, approaching the pole figure maximum as the opening angle decreases.
Analogous considerations apply in the case of the basal domain, which shows a depletion (intensity factor < 1.00) for the 30° by 30° cone (Heilbronner and Tullis, 2006) but still a slight intensification of 1.3 for the slightly wider 30° circular cone, used in the present study. Again, this comparison demonstrates that smaller cones accentuate the result. The effect is similar to choosing smaller filter kernels when smoothing pole figures.
There is a notion that continued deformation may lead to stronger textures. Numerous observations on natural and experimental microfabrics seem to corroborate this. For example, the pole figure maximum of experimentally sheared quartzite increases as shearing progresses
(Heilbronner and Tullis, 2006). This would suggest that - to a certain extent and for a given deformation mechanism -the strength of pole figures could be used as a measure of strain. And this, in turn, raises the interesting question as to what might be a good measure for the strength or intensity of a pole figure in situations where the pole figure does not consist of a single maximum (see, e.g., Heilbronner et al. 2002). The problem is far from being resolved, but the method of calculating pole densities in texture domains is certainly a viable option.
Size and Shape of the Recrystallized Grains
The ACFs of the texture domains were contoured at 3/8 ACFmax, i.e., at 37.5% of the maximum ACF. This level was chosen for convenience (selecting the “8 greys” look-up table in Image SXM) and because it is very close to the 39% threshold that yields the average grain size in a close-packed aggregate (Panozzo Heilbronner, 1992). The recrystallized grain size thus determined for the SuQ in the synthetic and antithetic domain is 116 µm and 83 µm, respectively, with an average of ~ 100 µm, for the Y and basal domain of the BHQ, it is 14 µm and 20 µm, respectively with an average of ~17 µm (Table 2).
The recrystallized grain size of the SuQ is very large. From various structural features (including a very broad size distribution of the recrystallized grains) it is concluded that annealing and pinning at the quartz - mica interfaces must have overprinted the microstructure. Since annealing increases the grain size without, however, destroying the CPO (Heilbronner and Tullis, 2002), piezometry is not possible. In contrast, the BHQ is not annealed and contains virtually no second phases. Using the quartz piezometer calibrated by Stipp and Tullis (2003), slightly different flow stresses can be calculated for the texture domains in the BHQ: ~60 MPa for the Y domain and ~80 MPa for the basal domain. Together with an interpretation in terms of the aspect ratio and orientation of weak inclusions deforming in a strong matrix (Gay, 1968), this difference implies different and texture-related viscosities for these domains (see discussion in Heilbronner and Tullis, 2006).
The shape of the ACF contours at the 3/8 level of ACFmax portray the average shape of the grains. Using the long and short axis and the orientation of the best fit ellipse (Analysis menu of Image SXM) as primary descriptors, one finds for the synthetic and antithetic domains of the SuQ similar aspect ratios (R = 1.77 and 1.70), and inclinations of the long axes (M = 175° and 5°) that correspond to sinistral and dextral shear, respectively (Table 3). Note, that the shapes of the contours are not elliptical but show monoclinic symmetry, confirming the sinistral and dextral sense of shear. Note also,
that this asymmetry is not noticeable with the naked eye. It appears that individual grains behave as mini-domains, deforming in a conjugate manner by simple shear, with the combined bulk effect being one of pure shear with a small simple shear component. Note also, that annealing has not completely destroyed this very subtle asymmetry.
In the case of the BHQ, the ACF contours at the 3/8 level of ACFmax show similar shapes (R = 2.19 and 1.99) and orientations (M = 168° and 157°) for the Y and basal domain, respectively. Both show monoclinic symmetry and both are inclined with the (sinistral) sense of shear (Table 3). Note that in both domains, the orientation of the recrystallized grains is steeper than that of the domain as a whole (shape of contour at 1/8 level of ACFmax): the difference being 7° and 14° for the Y and the basal domain, respectively. The elongation of the ACF contours at the grain size level (3/8 ACFmax) is quite pronounced. The relatively high aspect ratio, R ~2, is due the combined effect of a slightly flattened grain shape and a spatial alignment in the same direction. Otherwise, a strong flattening of recrystallized grains is not typical for regime 3 but for regime 2.
Since the ACF shapes are monoclinic and do not have the orthorhombic symmetry of an ellipse, the shape of the grains cannot be viewed as strain markers and therefore cannot be used for strain measurements. At the same time, the monoclinic shape conveys interesting information, for example, it has been found in quartz and in calcite (Stünitz, 1991; Schmid et al. 1987) that the (monoclinic) orientation distribution of grain boundary surface in recrystallizing microstructures is a very sensitive indicator of shear sense, reacting faster to a change of deformation
mechanism (for example, to the onset of grain boundary migration) than the CPO.
Geometry of Texture Domains
A texture domain is defined by crystallographic orientation, not by spatial arrangement. However, in space, texture domains can be coherent, as in the case of the Y domain of the BHQ, or dispersed, as in the case of the synthetic and antithetic domains of the SuQ. In other words, not all texture domains exist as spatially coherent entities. Features that are smaller than the average grain size (substructures, subgrains etc.) are represented by smaller ACF contours at higher correlation levels. Features that are larger than the average grain size (superstructures) are represented by larger contours at lower contour levels. Therefore, for the analysis of texture domains the contour at 1/8 ACFmax was picked. In general, for the ACF analysis, two procedures are possible: either one first selects a contour level (i.e., level of correlation) and then derives the size and shape of the corresponding feature (grain, sub-grain, domain, etc) or one first selects the size of the contour (correlation length) and then derives the shape and correlation level (for further detail, see Heilbronner, 2002). Here, the correlation level is selected first and the size and shape of grains (see above) and domains (see below) are derived from the contours at the 3/8 and 1/8 ACFmax.
In the case of the SuQ, the shape of the contours at 1/8 ACFmax are geometrically similar to those at 3/8 ACFmax, having similar aspect ratios and orientations, only the size is about 3 times larger (Table 3). This size-increase corresponds roughly to the expected size-increase of 2.56 times of the ACF contours of a circle from the 37.5% level
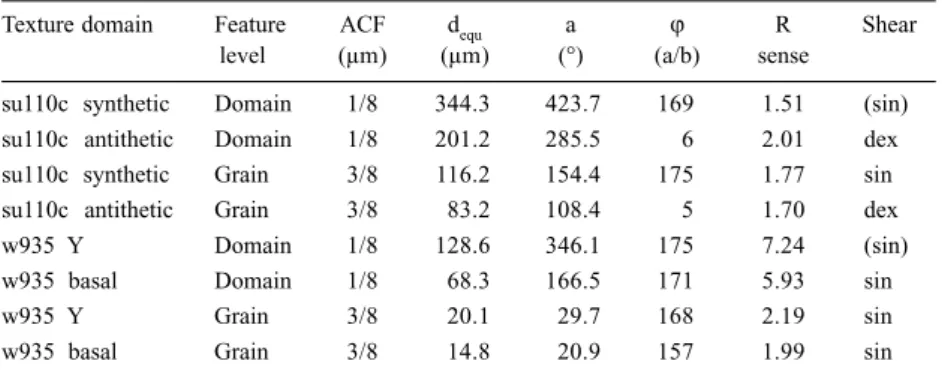
Table 3. Size and shape of autocorrelation functions (Figs. 3c and 4c) of texture domains (Figs. 3a
and 4a). ACF level = contour level of evaluation: ACF contours at 1/8 and 3/8 ACFmax correspond to the average size and shape of domains and grains, respectively (see text); dequ = area equivalent diameter of ACF contour; a,b = long, short axis of best fit ellipse; M = angle of long axis w/r to horizontal (0°) increasing counter clockwise from positive X; R = aspect ratio of best fit ellipse. The sinistral (sin) and dextral (dex) shear sense is inferred from the monoclinic shape of the ACF contour; in brackets if the orientation of the long axis with respect to the shear direction is used
Texture domain Feature ACF dequ a M R Shear
level (µm) (µm) (°) (a/b) sense su110c synthetic Domain 1/8 344.3 423.7 169 1.51 (sin) su110c antithetic Domain 1/8 201.2 285.5 6 2.01 dex su110c synthetic Grain 3/8 116.2 154.4 175 1.77 sin su110c antithetic Grain 3/8 83.2 108.4 5 1.70 dex
w935 Y Domain 1/8 128.6 346.1 175 7.24 (sin)
w935 basal Domain 1/8 68.3 166.5 171 5.93 sin
w935 Y Grain 3/8 20.1 29.7 168 2.19 sin
to the zero correlation level (cf. Panozzo Heilbronner, 1992) and hence does not indicate the presence of a larger feature in the image.
For the BHQ, the situation is different. The aspect ratios of the domains are much higher than those of the individual grains: 7.24 and 5.93 as opposed to 2.19 and 1.99 for the Y and basal domains, respectively. Also, the long diameter is increased by a factor of more than 10 from ~30 µm to ~350 µm (Table 2). This difference clearly indicates the presence of a superstructure, i.e., of spatially coherent domains. These domains consist of grain aggregates and can be considered as objects that undergo strain and they can also be associated with different viscosities and flow stresses (Heilbronner and Tullis, 2006). In the undeformed BHQ, the starting grain size is ~100 µm. The Y domains of the deformed sample are significantly bigger than the starting grain size (Table 3) and therefore must be considered coalesced aggregates of recrystallized grains and cannot be viewed as the strained ‘ghosts’ of the original grains. Whether such domains are formed by coalescence, as was demonstrated in the case of the Y domain of the BHQ (Heilbronner and Tullis, 2006), or whether they are the outlines of the original grains and can be used as strain markers (as discussed by Pauli et al. 1996), or whether they are due to yet another process, cannot be judged from the ACF alone.
Bulk Texture and Bulk Properties of Domainal Rocks
It is known from experiments, that the CPO and the size of the texture domains keep changing as strain progresses (Heilbronner and Tullis, 2006). The formation of texture domains, in particular of the Y domains, is thought to depend on the activity of the slip system (rhomb <a>) or the deformation mechanisms. However, there must also be an interaction among domains with certain domains growing at the expense of others or domains inhibiting the rotation of other ones into a more suitable orientation, etc. In other words, the development of the bulk CPO is the result of the temporal and spatial evolution of the texture domains.
It appears that strongly domainal rocks should favour localization of strain or deformation. For example, one would expect that the formation of a texture domain with a CPO that is suitable for glide on a “geometrically weak” glide system, once established, would remain as long as the deformation continues. But it is not clear that a stable microstructure is established in this fashion. Rather, observations of continued shearing within suitably oriented domains within norcamphor have shown that new and less suitably oriented domains progressively nucleate, develop and disappear again (e.g., Herwegh et al. 1997). The fact that domains can undergo cyclic behaviour suggests that
domainal rocks may support steady state flow without or with only transient localization in the weakest domain.
Another interesting point to note is that in a strongly domainal rock, the bulk CPO (as shown, for example in Fig.1d for w935) does not exist in any of the domains. In the sheared BHQ, the domains have different CPOs with maxima in different orientations. A large volume of BHQ has to be sampled before the bulk CPO, an inclined girdle, is obtained as the area weighted sum of the CPOs of the domains. In the case of the SuQ, the situation is different: no geometrically coherent texture domains exist. Instead, the bulk CPO “permeates” the rock down to the grain size scale; there is no partitioning of texture and hence no partitioning of rheology or strain is to be expected.
While it is not clear if the formation of spatial domains depends on the active slip system, the deformation mechanisms or the kinematics (shear versus simple shear), the presence of texture domains is always significant, indicating a possible heterogeneity of material properties and deformational behavior, even in a situation where the composition is perfectly homogeneous.
SUMMARY AND CONCLUSIONS
The naturally deformed sample of Suretta quartzite, deformed to a high strain, has a c-axis pole figure with two symmetrically disposed peripheral c-axis maxima, indicating predominantly pure shear; no coherent texture domains are formed. The experimentally deformed sample of Black Hills quartzite, deformed to a shear strain of g | 6, has a c-axis pole figure with an inclined single girdle indicates predominant simple shear; large, geometrically coherent texture domains are formed. With respect to the analyzed samples, the following observations are made:
a) In the SuQ, two texture domains are recognized; they do not form spatial domains.They correspond to two symmetrically inclined c-axis maxima, typical for pure shear. One of the maxima is slightly stronger than the other one indicating a simple shear component. The recrystallized grain size of the synthetic texture domain is slightly larger than the average grain size of the antithetic one. The average shape of the spatially dispersed recrystallized grains coincides with the shear sense that would be inferred for the synthetic and antithetic domains.
b) In the BHQ, two texture domains are recognized: a strong maximum in the Y direction indicative of prism <a> glide and a weaker peripheral maximum indicative of basal <a> glide. Both show strong spatial domain formation. The different recrystallized grain sizes can
be used to infer different flow stresses for the domains and the shape of the texture domains can be used to infer the corresponding strain partitioning as described previously (Heilbronner and Tullis, 2006).
Concerning the use of orientation/misorientation imaging (CIP method) and the autocorrelation function (ACF) for the quantitative analysis of dynamically recrystallized microstructures, the following conclusions can be drawn:
1. Misorientation images represent texture domains. Misorientation images can be combined to represent composite, polymaximal domains.
2. From thresholded misorientation images, the pole density in that domain, and texture intensification can be determined.
3. In cases where the pole figure displays more than one clear maximum, the volume densities of different texture domains are better suited for the characteri-zation of the intensity of the CPO (texture intensity) than the pole figure maximum.
4. The structure and spatial coherence of texture domains are easily recognizable on misorientation images. Grains of a given texture domain can be homogeneously
dispersed in the rock or clustered and thus forming spatially coherent domains.
5. The geometry of texture domains is important. Geometrically coherent texture domains may induce rheology contrasts and lead to strain partitioning. 6. Using different contour levels of the autocorrelation
function, the average size and shape of the recrystallized grains (3/8 of ACFmax) and the geometry of the domains (1/8 of ACFmax) can be quantified. Under certain conditions, shear sense and strain or strain partitioning can be determined.
Acknowledgements: The samples I have used for this paper have been provided by Jan Tullis, Brown University, U.S.A., and Holger Stünitz, University of Tromsø, Norway. However, both of them contributed much more than a simple sample - I am indebted to them for many fruitful discussions over the last years of our collaboration. Support by the Swiss National Science Foundation (project NF 200020-119878) is gratefully acknowledged. The paper has been carefully reviewed by Jan Tullis and Michael Stipp, I thank them for many valuable suggestions. Finally, this contribution is a small tribute to a great structural geologist, S.K. Ghosh, whom I have never met, but whose work I highly appreciate.
References
ADAMS, B.L., WRIGHT, S.I. and KUNZE, K. (1993) Orientation
imaging—the emergence of a new microscopy. Metall. Trans., A, Phys. Metall. Mater. Sci., v.24(4), pp.819-831.
BARRETT, S.D. (2002) Software for scanning microscopy. Proc.
Roy. Microsc. Soc., v.37, pp.167-174.
DARROZES, J., GAILLOT, P., DE SAINT-BLANQUAT, M. and BOUCHEZ,
J.L. (1997) Software for multi-scale image analysis: The normalized optimized Anisotropic Wavelet Coefficient method. Computers & Geosciences, v.23, pp.889-895.
DE RONDE, A.A., HEILBRONNER, R., STUNITZ, H. and TULLIS, J. (2004)
Spatial correlation of deformation and mineral reaction in experimentally deformed plagioclase–olivine aggregates, Tectonophysics, v.389, pp.93-109.
GAY, N.C. (1968) Pure shear and simple shear deformation of
inhomogeneous viscous fluids. 2. The determination of the total finite strain in a rock from objects such as deformed pebbles. Tectonophysics, v.5, pp.295-302.
HALFPENNY, A., PRIOR, D.J. and WHEELER, J. (2006) Analysis of dynamic recrystallization and nucleation in a quartzite mylonite. Tectonophysics, v.427, pp.3-14.
HEILBRONNER, R. (2000) Optical Orientation Imaging. In: M.W.
Jessel and J.L. Urai (Eds.), Stress, Strain and Structure, A volume in honour of W D Means. Jour. Virtual Explorer,, Volume 2.
HEILBRONNER, R. (2002) Analysis of bulk fabrics and microstructure
variations using tesselations of autocorrelation functions.
Computers & Geosciences, v.28, pp.447-455.
HEILBRONNER, R. and TULLIS, J. (2006) Evolution of c-axis pole
figures and grain size during dynamic recrystallization: Results from experimentally sheared quartzite. Jour. Geophys. Res., 111: B10202, doi:10.1029/2005JB004194.
HEILBRONNER, R. and TULLIS, J. (2002) The effect of static annealing
on microstructure and crystallographic preferred orientations of quartzites experimentally deformed in axial compression and shear. In: S. de Meer, M.R. Drury, J.H.P. de Bresser and G.M. Pennock (Eds.), Deformation Mechanisms, Rheology and Tectonics: Current Status and Future Perspectives. Geol. Soc., London, Spec. Publ., pp.191-218.
HEILBRONNER, R., VAN DEN BOOGART, G. and SCHAEBEN, H. (2002) Comparison of coarse and fine grained (dynamic and annealed) quartz textures using the pole density index (PDI) measurement. IAMG 2002 - Terra Nova - Schriften der Alfred Wegener Stiftung 03. U. e. a. Bayer. Berlin, Freie Universitüt, 443-448.
HERWEGH, M., HANDY, M.R. and HEILBRONNER, R. (1997)
Temperature- and strain-rate-dependent microfabric evolution in monomineralic mylonite: evidence from in situ deformation of norcamphor. Tectonophysics, v.280, pp.83-106.
HIRTH, G. and TULLIS, J. (1992) Dislocation creep regimes in quartz
aggregates. Jour. Struct. Geol., v.14, pp.145-159.
KUNZE, K., HEIDELBACH, F., WENK, H.-R. and ADAMS, B. L. (1995)
Bunge, S. Siegesmunde, W. Skrotski and K. Weber, (Eds.), Textures of Geological Materials, DGM Informations gesellschaft MbH, pp.127-144.
MEANS, W.D. (1976) Stress and strain. Basic concepts of continuum
mechanics for geologists. New York, Springer-Verlag. PANOZZO HEILBRONNER, R. (1992) The autocorrelation function:
an image processing tool for fabric analysis. Tectonophysics, v.212, pp.351-370.
PANOZZO HEILBRONNER, R. and PAULI, C. (1993) Integrated spatial and orientation analysis of quartz c-axes by computer-aided microscopy. Jour. Struct. Geol., v.15(3-5), pp.369-382. PAULI, C., SCHMID, S.M. and PANOZZO HEILBRONNER, R. (1996)
Fabric domains in quartz mylonites: localized three dimensional analysis of microstructure and texture. Jour. Struct. Geol., v.18, pp.1183-1203.
PIAZOLO, S., JESSELL, M.W., PRIOR, D.J. and BONS, P.D. (2004) The integration of experimental in-situ EBSD observations and numerical simulations: a novel technique of microstructural process analysis. Jour. Microscopy, v.213, pp.273-284. PRIOR, D.J., BOYLE, A.P., BRENKER, F., CHEADLE, M.C., DAY, A.,
LOPEZ, G., PERUZZO, L., POTTS, G.J., REDDY, S., SPIESS, R.,
TIMMS, N.E., TRIMBY, P., WHEELER, J. and ZETTERSTRÖM, L.
(1999) The application of electron backscatter diffraction and orientation contrast imaging in the SEM to textural problems in rocks. Am. Mineral., v.84 (11–12), pp.1741-1759. RAMSAY, J.G. (1967) Folding and Fracturing of Rocks. New York,
McGraw-Hill Book Company.
RAMSAY, J.G. and HUBER, M.I. (1983) The Techniques of Modern
Structural Geology. Academic Press.
SCHMID, S.M., PANOZZO, R. and BAUER, S. (1987) Simple shear
experiments on calcite rocks: rheology and microfabric. Jour. Struct. Geol., v.9, pp.747-778.
SCHMID, S.M. and CASEY, M. (1986) Complete fabric analysis of
some commonly observed quartz c-axis patterns. Am. Geophys. Union Monogr., v.36, pp.263-286.
SCHREURS G. (1993) Structural analysis of the Schams nappes and
adjacent tectonic units: implications for the orogenic evolution of the Penninic zone in the Eastern Switzerland. Bull. Geol. Soc. France, v.164, pp.425-435.
Stipp, M. and Tullis, J. 2003. The recrystallized grain size piezometer for quartz. Geophys. Res. Lett., v.30(21), 2088, doi:10.1029/2003GL018444.
STIPP, M., STÜNITZ, H., HEILBRONNER, R. and SCHMID, S.M. (2002)
The eastern Tonale fault zone: a ‘natural laboratory’ for crystal plastic deformation of quartz over a temperature range from 250 to 700°C. Jour. Struct. Geol., v.24, pp.1861-1884. STÜNITZ, H. (1991): Folding and shear deformation in quartzites,
inferred from crystallographic preferred orientation and shape fabrics. Jour. Struct. Geol., v.13, pp.71-86.
STÜNITZ, H., HEILBRONNER, R. and SCHAEBEN, H. (1993) Detailed
texture interpretation of naturally deformed quartzites. ICOTOM 10 (20.-24.9. 1993), Clausthal, Technische UniversitŠt Clausthal & Deutsche Gesellschaft für Materialkunde, 106.
TRIMBY, P.W., PRIOR, D.J. and WHEELER, J. (1998) Grain boundary
hierarchy development in a quartz mylonite. Jour. Struct. Geol., v.20, pp.917-935.
Turcotte, D.L., 1989. Fractals in geology and geophysics. In: C.H. Scholz and B.B. Mandelbrot (Eds.), Fractals in Geophysics. Pure and Applied Geophysics, v.131, pp.171-196.
UNDERWOOD, E.E. (1970) Quantitative Stereology. Menlo Park,
Addison-Wesley Publ. Co., 212p.
VAN DAALEN, M., HEILBRONNER, R. and KUNZE, K. (1999)
Orientation analysis of localized shear deformation in quartz fibres at the brittle–ductile transition. Tectonophysics, v.303, pp.83-108.