ORIGINAL PAPER
Monitoring induced gene expression of single cells
in a multilayer microchip
C. Hanke&S. Waide&R. Kettler&P. S. Dittrich
Received: 17 August 2011 / Revised: 2 November 2011 / Accepted: 20 November 2011 / Published online: 11 December 2011 # Springer-Verlag 2011
Abstract We present a microfluidic system that facilitates long-term measurements of single cell response to external stimuli. The difficulty of addressing cells individually was overcome by using a two-layer microfluidic device. The top layer is designed for trapping and culturing of cells while the bottom layer is employed for supplying chemical compounds that can be transported towards the cells in defined concen-trations and temporal sequences. A porous polyester mem-brane that supports transport and diffusion of compounds from below separates the microchannels of both layers. The performance and potential of the device are demonstrated using human embryonic kidney cells (HEK293) transfected with an inducible gene expression system. Expression of a fluorescent protein (ZsGreen1-DR) is observed while varying the concentration and exposure time of the inducer tetracy-cline. The study reveals the heterogeneous response of the cells as well as average responses of tens of cells that are analyzed in parallel. The microfluidic platform enables sys-tematic studies under defined conditions and is a valuable tool for general single cell studies to obtain insights into mecha-nisms and kinetics that are not accessible by conventional macroscopic methods.
Keywords Single cell analysis . Microfluidics . Multilayer soft lithography . Fluorescent protein . Gene expression
Introduction
The systematic analysis of cellular responses requires pre-cise control of the surrounding environment to mimic in vivo conditions and to precisely regulate the supply of effectors. Often only a small number of molecules are re-quired to induce cell responses. Therefore it is essential that small liquid volumes are handled without loss of the com-pounds. Standard tissue culture techniques lack the ability to create controllable and reproducible microenvironments. Moreover, the analysis of a large cell population by standard techniques results in an average analysis obscuring the heterogeneous characteristics of individual cells [1,2]. For example, dramatic variations of protein levels can be found between cells within a single population deriving from the same parental cell. By 1957 differences in gene expression between cells could be experimentally observed [3]. How-ever, it was not until 1990 that reliable single cell assays for gene expression studies enabled the examination of the underlying stochastic phenomena [4]. Since then, several studies were performed to further our understanding of cell heterogeneity [5–11]. Nowadays, the heterogeneities in pro-tein levels are attributed to two determining factors [12,13]: (i) the intrinsic noise, caused by the inherent stochastic noise of the biochemical events during gene expression; and (ii) the extrinsic noise, caused by additional variations of other cellular components including other proteins.
Measurements of cell-to-cell differences are challenging because they require methods to manipulate and address single cells and analytical instrumentation that is sufficiently sensitive to measure cell processes or target compounds in
Published in the special issue Analytical Sciences in Switzerland with guest editors P. Dittrich, D. Günther, G. Hopfgartner, and R. Zenobi. Electronic supplementary material The online version of this article (doi:10.1007/s00216-011-5595-x) contains supplementary material, which is available to authorized users.
C. Hanke
:
P. S. Dittrich (*)Department of Chemistry and Applied Biosciences, ETH Zurich, Wolfgang-Pauli-Str. 10, 8093 Zurich, Switzerland e-mail: dittrich@org.chem.ethz.ch S. Waide
:
R. Kettler ISAS Dortmund, 44139 Dortmund, Germany DOI 10.1007/s00216-011-5595-xlow concentrations. Moreover, to reach reliable statistical confidence, the analytical platform should preferentially allow parallel analysis of large cell numbers. These chal-lenges can be tackled using microfluidic platforms as they offer remarkable promises for single cell handling and open the way to novel methods that are unfeasible to realize with macroscopic instrumentation [14–18].
Nowadays, it is possible to fabricate defined structures in the nano- and micrometer range using microsystems technol-ogy and related techniques. These dimensionalities match biologically relevant length scales such as the diameter of living cells. Hence, versatile tools for cell culturing, position-ing, analysis, and manipulation can be developed. Various approaches for single cell trapping have been presented in-cluding the implementation of cell adhesive micropatterns [19–21], microwells [22], micropores [23], microsized hurdle structures [24–26], the use of dielectrophoretic cages [27,28], and encapsulation in segmented flow microfluidic systems [29–31].
Besides the precise handling of cells, microfluidic sys-tems enable the use of small liquid volumes in the range of microliters to picoliters. Typically, the liquids are introduced and flowed through the microchannels by means of syringe pumps or pressure-driven pumps allowing precise flow con-trol down to flow rates of a few nanoliters per minute. The
exchange of liquids can be achieved by the use of valves implemented into the tubing off-chip or implemented on-chip [32]. Furthermore, fluid exchange has been realized by variations of flow rates in multilaminar streams [33]. Howev-er, for studies of cellular response these approaches are not optimal in a planar microchip. Too high flow rates expose the cells to significant shear stress, which in turn can influence cellular processes [34].
We have designed a two-layer microfluidic chip, which enables a significant improvement of fluid handling by sepa-rating the channel system for cell handling and cell mainte-nance from the channels used for cell stimulation. The two required microfluidic layers are positioned on top of each other with an intermediate porous membrane at the interface to facilitate the transfer of dissolved molecules between the layers (Fig.1a). In this design, the top layer is used exclusively for cell introduction, trapping, and supply of media and guar-antees optimized cell viability by use of weak flow rates for media supply and removal. The bottom layer contains several input channels to supply stimulating agents to the cells. Dis-solved compounds for cell stimulation can be supplied either continuously, periodically, or using a short pulse. Additional-ly, the delivery of stimulants can be spatially resolved using multilaminar flows allowing the formation of chemical gra-dients. Hence, the two-layer microfluidic platform allows a
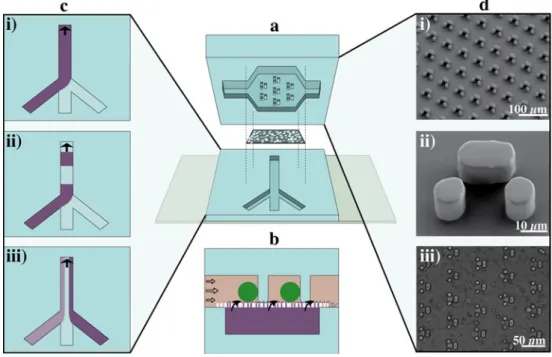
Fig. 1 Schemes (not to scale) and images of the microdevice. a Exploded view of the multilayer microfluidic device with the top and bottom channel and the intermediate porous membrane. b Side view of the assembled device. Cells are trapped at the microstructured columns in the top channel, while inducer solution is introduced from below and reaches the cells via the micropores in the membrane. In the experi-ments described here, tetracycline is delivered to the trapped cells inducing the expression of the green fluorescent protein
ZsGreen1-DR. c Different flow profiles in the bottom channel can be used to supply the inducer continuously (i), in temporal pulses (ii) or spatially resolved by using multilaminar streams (iii). d Images of the cell traps. Scanning electron microscopy (SEM) images of the poly(dimethylsi-loxane) (PDMS) top layer showing the trap array (i) and an individual trap (ii). The microscope image of the assembled PDMS device with entrapped cells (the pores of the porous membrane are visible as well) (iii)
further level of temporal and spatial control concerning cell handling and analyte supply, previously unavailable to cell biologists, and not achievable on a planar microfluidic device. On the basis of previous designs [35–37], we improved the cell handling by implementation of a cell culture chamber with a trap array in the top channel. Precise cell positioning sim-plifies the currently semiautomated analysis of the individual mammalian cells, and will pave the way for fully automated data analysis in the future. The performance of the microdevice is demonstrated by studying the expression levels of a fluores-cent protein (ZsGreen1-DR) in human embryonic kidney cells (HEK293). In this system the gene expression is inducible (the inducer is tetracycline) and hence serves as a convenient model system to demonstrate the potential of the device for spatial and temporal controlled gene expression.
Material and methods Reagents
All reagents were used as received if not mentioned other-wise. Tetracycline (Sigma-Aldrich, Switzerland) was dis-solved in ethanol p.a. (Scharlab SL, Spain) to a 1 mg/ml stock solution. DMEM media, MEM media, DMEM media containing 25 mM HEPES, fetal bovine serum (tetracycline negative), penicillin–streptomycin (100x), and Dulbecco’s PBS (1x, without calcium and magnesium) were purchased from PAA Laboratories (Germany). Blasticidin S HCl and Zeocin™ (100 mg/ml) were obtained from Invitrogen; Blas-ticidin S HCl was dissolved in Millipore water to a 5 mg/ml stock solution. Titriplex® II (EDTA, VWR, Switzerland) was dissolved in Millipore water to a 0.5 M stock solution (pH adjusted to 8). Propidium iodide (1 mg/ml) was received from Sigma-Aldrich (Switzerland). Trypan blue solution (0.4%) was purchased from ABCR (Germany).
Chip fabrication
The two-layer microfluidic device was prepared from PDMS (Sylgard 184, Dow Corning, Germany) by casting both layers from a master form fabricated by standard microfabrication techniques. Briefly, the photoresist SU-8 2015 (Microchem, Newton, MA) was spin-coated on a silicon wafer to a height of 20μm and exposed to ultraviolet light through a photolithography mask (film mask, JD Photo Tools, UK) containing the channel patterns. After develop-ment of the photoresist, the master forms were silanized overnight under vacuum using 1H,1H,2H,2H-perfluorode-cyldimethylchlorosilane (ABCR, Germany).
PDMS oligomer and curing agent were thoroughly mixed in a ratio of 10:1 and the mixture was degassed in a desic-cator. For the cell trapping channel in the top layer, a frame
was placed onto the master form, filled with the pre-polymer, and cured at 150 °C for 20 min. After curing, excess PDMS was removed and access holes for the fluids were punched using a biopsy puncher (1.5 mm diameter, Miltex, Switzerland). For the bottom layer the PDMS pre-polymer was poured onto the master form and fixed with a 24×40-mm glass slide at about 100μm height and cured at 150 °C for 3 min. After both layers were cleaned and the surfaces were exposed to an oxygen plasma (Plasma Clean-er PDC-32 G, Harrick Plasma, Ithaca, NY), a piece of polyester membrane (11 μm thickness, 1.2 μm pore size, 1.6×10⁶pores per cm2, it4ip, Belgium) was placed on top of the cell trapping structures in the top layer. To ensure complete sealing between the two layers and the polyester membrane, tiny drops of uncured PDMS were placed onto the edges of the membrane. The microchip was assembled by placing the bottom layer on top such that the main channels of both layers were perpendicular to each other. The device was placed onto a hotplate at 100 °C for another 2–5 min to ensure complete curing of the PDMS drops to seal and completely bond the assembled chip.
Chip design and operation
The microfluidic device was designed to capture single cells in parallel. To this end, the cell culture chamber in the top layer contained traps consisting of three post features (Fig. 1d). Two smaller posts (10×10 μm in size) were separated by a 6-μm gap from the longer third post (10× 20μm in size) to form a hurdle with a depth of 16 μm to trap one mammalian cell (approximately 15μm in diame-ter). Additionally to cell capturing, the hurdles acted as a support for the large chamber (almost 5 mm in width) in the top layer that would otherwise collapse due to the low height (20μm) and the flexibility of the PDMS. The bottom channel was 370μm wide and 20 μm high.
Custom-made metal connectors, FEP (fluorinated ethylene propylene) tubing [outer diameter (OD) 1/16”, inner diameter (ID) 250 μm, BGB Analytik AG, Switzerland] and PEEK (polyether ether ketone) capillaries (OD 1/32”, ID 50 μm and 250μm, respectively, BGB Analytik AG, Switzerland) were used to connect the MAESFLO pressure flow control system (Fluigent, France) to the microfluidic device. The 15-ml tubes containing the reagents were connected to the flow control system by PEEK capillaries (ID 50μm). The outgoing capil-laries (ID 250μm) were connected to custom-made bubble traps and finally to the chip via FEP tubing.
Cell modification and cell culturing
Human embryonic kidney cells (HEK293, DSMZ, Ger-many) were stably transfected with the modified T-REx™ system (Invitrogen, Germany) consisting of two plasmids,
the inducible expression vector, and the regulatory vector pcDNA6/TR. For monitoring the tetracycline-induced gene expression in the multilayer microfluidic device, the ZsGreen1-DR gene (Clontech, France), a destabilized vari-ant of GFP, was inserted into the inducible expression vector of the T-REx™ system. HEK293 cells were co-transfected with the regulatory and the inducible expression vector in a ratio of 6:1 to ensure complete repression of gene expression without tetracycline. For selection of positive clones 5– 10μg/ml Blasticidin S HCl and 100–800 μg/ml Zeocin™ were added to the cell culture media. The T-REx™ modified HEK293 cells were cultured in DMEM low glucose media containing 10% fetal bovine serum (tetracycline negative), 1% MEM, and 1% penicillin–streptomycin at 37 °C and 7% CO2atmosphere. For experiments, the cells were harvested in the same media that additionally contained 25 mM HEPES buffer, 5 mM EDTA, and 1μg/ml propidium iodide. EDTA was added to minimize cell aggregation during trans-port to the light microscopy laboratory. For the induced gene expression measurements the media did not contain EDTA. Cell growth on-chip
The surface of the polyester membrane was hydrophilic and promoted cell adhesion. To confirm practicability of the mem-brane for cell handling, T-REx™ modified HEK293 cells were seeded into the microchip and cell growth was observed over several days. Tips with media containing 25 mM HEPES buffer, 0.1μg/ml tetracycline, and 1 μg/ml propidium iodide were placed in the inlets of both channel systems. Thus, a low flow was achieved until the pressure difference between the empty tips placed in the outlets and the filled tips in the inlets was too low to cause a flow. The tips were exchanged every day to ensure the supply of fresh media and the removal of used one. Tetracycline was added for visualization of healthy cells and propidium iodide to stain dead cells.
Monitoring of induced gene expression and data evaluation Fluorescent signals were monitored with an inverted micro-scope (IX81, Olympus, Switzerland) equipped with a x20 0.45NA Ph LUCPLFLN (long-distance) objective using the Olympus CellR 3.0.x software. The filter set FITCQ (ex 485/20, beam splitter Quadband 410/504/582/669, em 531/ 22) was used for ZsGreen1-DR protein expression and TRITCQ (ex 560/25, beam splitter Quadband 410/504/ 582/669, em 624/40) for dead cell staining. Images were recorded every 10 min with a digital camera (Orca ER, Hamamatsu, Switzerland) at an exposure time of 40 ms. To maintain relative fluorescence intensities the data were processed using ImageJ 1.43 g software (NIH, USA). Only single cells that showed a positive response (detectable in-crease of fluorescence intensity) after 15 h were considered.
Circular regions of interest of the size of the particular cell, i.e., diameters of about 15μm, were manually defined in the bright field images to determine the mean value of the fluorescence intensity of individual cells. Afterwards, these mean values were normalized to the starting value.
Results and discussion
Device operation and characterization Chip operation
Directly after assembly, the chip was quickly prefilled with deionized water to maintain the hydrophilicity of the plasma-activated PDMS surface. Moreover, the filling pro-cess by centrifugation prevented the formation of air bub-bles otherwise induced during priming of the chip. Later introduction of air bubbles was avoided by implementing custom-made bubble traps in the tubing that delivered media and reagents, respectively (Electronic Supplementary Mate-rial Fig.S1). The chips were used directly after preparation, without any further surface treatment.
Shortly before starting the experiment the cells were harvested at a concentration of 1.5×10⁶ cells/ml and fil-trated using a 20-μm nylon mesh (Celltrics®, LabForce AG, Switzerland) to minimize cell aggregation. Between 10 and 20 μl of the cell suspension was injected into the top layer of the device at flow rates between 0.5 and 1μl/ min. After 2–5 min about 40% of the 450 traps in the crossing section of the top and the bottom channel were occupied with one cell, 27% with several cells, and 33% remained empty (Fig.1d). Remaining cells were washed out using flow rates up to 7.7μl/min. A longer supply time of the cell suspension resulted in higher trapping numbers, but double or triple occupancy of single traps was increased. Furthermore, we found increased cell settling at positions where no cell trap was implemented. During the experi-ments, slow flow rates between 0.2 and 0.35 μl/min in the top layer and 0.35–0.5 μl/min in the bottom layer were applied. Higher flow rates resulted in loss of the trapped cells.
Cell growth and viability on-chip
To verify the compatibility of the device for living cell studies, the cell growth of the modified HEK293 cells was observed over 6 days in the microfluidic device (Electronic Supplementary Material Fig.S2). The cells adhered visibly on the membrane after about 1 day and showed morpholo-gies and growth rates similar to those in a culture plate, proving that the microdevice does not significantly compro-mise cell viability and can be employed for long-term studies.
In the following studies we typically performed measure-ments over 15 h, i.e., the cells were not yet adhered and still exhibited a round-shaped morphology. The cell viability during gene expression studies was always determined be-fore and after finishing the experiments by dead cell staining (propidium iodide). Bright field and fluorescence images were taken directly before and after the experiments to ensure that dead cells were not included in the data analysis (Electronic Supplementary Material Fig.S3). We found only a few dead cells and the average cell survival rate during the experiments was high (approximately 96%).
Monitoring of induced gene expression
The microdevice facilitates systematic studies of the depen-dence of gene expression on (i) inducer concentration and (ii) exposure time. Furthermore, it has the potential to study concentration gradients of inducer on a single chip (iii). By use of this bilayer microfluidic device the flow patterns of the inducer can be individually controlled, i.e., completely independent of the supply of media. The different modes of inducer supply are presented in the following sections. They were realized by the supply of buffer and tetracycline sol-utions through the different input channels in the bottom layer and by changing the flow rates of each channel sepa-rately (Fig.1c). In all cases, tetracycline was transported to the crossing section between the bottom and the top layer. It reached the top channel across the porous membrane and hence diffused into the trapped cells. A higher flow rate in the bottom channel compared with that in the top one caused a slow flow of the tetracycline solution from the bottom to the top channel, where the solution was removed to the outlet. Figure S4 and the movie (both Electronic Supple-mentary Material) illustrate the transport and diffusion of molecules from the bottom to the top channel to introduce or remove the inducer.
In this study we used the commercially available T-REx™ gene expression system that consists of two vectors, a pcDNA6/TR and an inducible gene expression vector. The pcDNA6/TR plasmid expressed high levels of the tetracycline repressor, which formed homodimers. Two homodimers bound with an association constant (KA)of 2×10¹¹ M−1to two tetracycline operator sequences on the inducible express-ing vector resultexpress-ing in the repression of the transcription of its gene of interest. Upon addition, tetracycline was taken up by the cells and bound with a KAof 3×10
9
M−1to the tetracycline repressor. This caused a conformational change that resulted in the release of the homodimers from the operator sequences and hence gene expression was induced [38,39]. The gene of interest in this work encoded the ZsGreen1-DR protein, a destabilized variant of the green fluorescent protein that could be monitored online [40]. Hence, the increase in fluorescence over time could be conveniently attributed to the level of
ZsGreen1-DR expression. The emerging fluorescence was clearly visible after a few hours in about 40% of the cells. The further increase in the fluorescence intensity was moni-tored for up to 15 h. Only cells that remained in the cell traps over the full period of time and expressed the ZsGreen1-DR protein were analyzed. Cells that moved and escaped from the trap during the experimental time were neglected.
Gene expression: inducer concentration dependency First, the expression of ZsGreen1-DR was observed over time and for various tetracycline concentrations ranging from 0.05 to 20 μg/ml. Cells were introduced into the microdevice and trapped at the designated positions. After-wards, the inducer tetracycline was constantly supplied (Fig. 1c-i) at a flow rate of 0.35 μl/min via the bottom channel and the increase in fluorescence intensity was mea-sured for each cell. Data were obtained from at least two different microdevices. The chip-to-chip variability was low, i.e., the efficiencies of single cell trapping and of gene expression induction did not significantly differ (p>0.1 in one-way analysis of variance test, ANOVA).
Figure 2a shows representative curves of normalized fluorescence intensity of individual cells over time after induction with 1 μg/ml tetracycline. The fluctuations of the curves can be attributed to instabilities in flow, instabil-ities of the autofocusing module, and fluctuations of the excitation lamp. Typically, the fluorescence increase started between 2.5 and 4 h after the initial supply of the inducer, reflecting the time required for tetracycline uptake until it reveals its efficacy on the genetic level as well as the time required for protein expression and folding. While we ex-pect the uptake to be very fast [41], the formation of fluo-rescent GFP takes typically hours [42]. In general, we observed a large heterogeneity of fluorescence intensity, which further broadened over time, as illustrated in the histograms in Fig.2b.
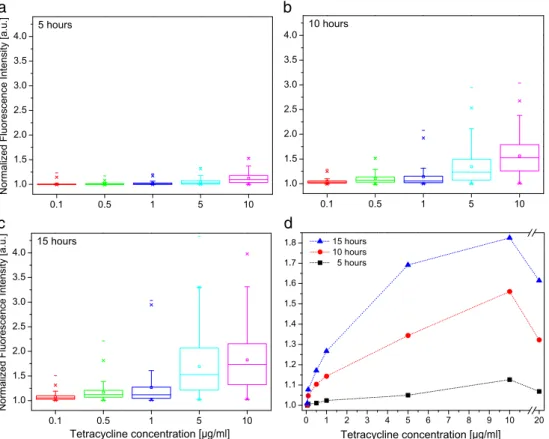
Measurements of gene expression were performed using different tetracycline concentrations and the results are sum-marized in the box plots in Fig. 3a–c. Higher tetracycline concentrations resulted in an earlier and stronger increase in fluorescence with large cell-to-cell differences over time, whereas lower tetracycline concentrations caused a delayed and weaker expression of the fluorescent protein. Without addition of tetracycline, no increase in fluorescence could be observed. On the basis of these single cell measurements, we could derive the dose–response curve of tetracycline for the induced gene expression in modified HEK293 cells (Fig. 3d). At 5 h and 10 h the curves showed a linear dependence on the inducer concentration. In contrast, the curve for 15 h resulted in a saturation of the induced gene expression, i.e., the amount of tetracycline within the cells was sufficiently high to prevent binding of the repressor
homodimers to the promoter of the inducible gene expres-sion vector. Under this condition, the gene expresexpres-sion of ZsGreen1-DR was independent of the inducer. Tetracycline concentrations below 0.1μg/ml did not result in a measurable expression, whereas for a high concentration of 20μg/ml, the expression levels were reduced compared with those at the 10μg/ml concentration. The reduced expression was most
likely a consequence of the toxicity of the tetracycline solution in high concentrations. This assumption was confirmed by growth studies on a culture plate and fluorescence activated cell sorting (FACS) analysis for high tetracycline concentra-tions where the cells showed reduced growth rates and abnor-mal morphologies (Electronic Supplementary Material Figs.S5andS6).
a b
Fig. 2 Increase of normalized fluorescence intensity over time obtained for single trapped cells after continuous supply of the inducer via the bottom channel of the two-layer microfluidic device. The fluorescence intensity corresponds to the level of the green fluorescent protein ZsGreen1-DR. Representative data are given for a tetracycline
concentration of 1μg/ml. a Selection of raw data traces for individual,
positively responding cells. The increase in fluorescence could be observed about 3 h after tetracycline supply. b Histograms presenting the distribution of the normalized fluorescence intensity after different times
a
b
c
d
. . . . . . . . . . . . . . . . . . . . . . . . . . . . . .Fig. 3 Gene expression after continuous induction. a–c Distributions
of normalized fluorescence intensities of single cells for several tetra-cycline concentrations at three different times. About 140 single cells from at least two different experiments were analyzed. a 5 h, b 10 h, c
15 h. Higher inducer concentrations resulted in an earlier and stronger increase of fluorescence with large cell-to-cell differences over time. d
Dose–response curves after 5, 10, and 15 h derived from the averaged
The results described above indicate that dose–response curves of the inducer could be determined reliably and con-veniently on the single cell level in the two-layer micro-fluidic device. We could determine general dependencies of inducer concentration on the expression level of the fluores-cent proteins. Most importantly, we could reveal heteroge-neous behavior of the investigated cells. Interestingly, we frequently observed a small number of cells with fast emerg-ing fluorescence and with high final fluorescence intensities, i.e., these cells expressed extremely large amounts of ZsGreen1-DR. In contrast, other cells were producing no or low levels of ZsGreen1-DR, although we confirmed that they were viable. This large heterogeneity of ZsGreen1-DR levels in the same cell culture could have different origins. We presume two major reasons: different transfection levels of the two plasmids of the gene expression system in indi-vidual cells, and/or the loss of plasmids during cell prolifer-ation. Consequently, the very bright cells could be attributed to cells with high plasmid numbers. Furthermore, differences in the current state of cell cycles could be another reason for the observed heterogeneities. However, it was beyond this study to fully understand the details of the mechanism. Nevertheless, the experiments described here demonstrate the versatility of the device for such studies on single cell response.
Gene expression: transient induction
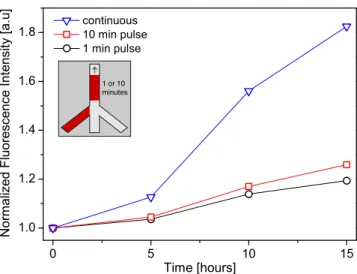
Short-term exposure of cell-stimulating compounds could help to elucidate kinetic constants of the mechanisms as well as compound thresholds required to provoke a cell response. On this microfluidic platform transient induction could be
easily realized by variation of the flow rates in the bottom input channels that were connected to tetracycline and buff-er solution. To delivbuff-er tetracycline solution only (Fig.1c-ii), the buffer flow was stopped either manually or triggered by the software of the pressure-driven pumps for periods be-tween 1 and 10 min. Alternating flows of buffer and tetra-cycline were generated with flow rates of 0.35μl/min in the bottom channel, while the flow of medium was constant in the top channel.
After switching the flows, it took less than 1 s until tetracycline reached the cells. The same time was required to wash out the tetracycline solution when only buffer flow was supplied. Figure 4 shows the normalized fluorescence intensities over time for pulses of 10 min and 1 min (tetra-cycline concentration was 10 μg/ml) compared to a con-tinuous induction. The cell response to the transient induction concerning the amount of expressed ZsGreen1-DR protein was clearly lower compared with that of contin-uous induction at the same concentration. The reduced expression of ZsGreen1-DR indicated that the repressor homodimers were expressed constantly (as expected). The tetracycline molecules were taken up and then bound to the repressor homodimers allowing transient ZsGreen1-DR ex-pression. However, the blocking sites were reoccupied by the freshly produced repressor homodimers that prevented further ZsGreen1-DR expression. Additionally, it is assumed that tetracycline was removed out of the cells by multiple drug resistance proteins [43].
1 or 10 minutes . . . . .
Fig. 4 Transient exposure of the cells to tetracycline. Single tetracy-cline pulses of 1 min (circles) or 10 min (squares) were supplied to the cells. The production of the fluorescent protein was initiated, but at a lower level compared with that of the continuous induction (triangles). The inset depicts the flow pattern in the bottom channel
. . . . . . . .
Fig. 5 Spatially resolved induction of gene expression. Different con-centrations of tetracycline were delivered to different areas of the cell trapping chamber at the same time. The inset depicts the flow pattern in the bottom channel. The three co-flowing streams (left to right)
contained 0.1, 0, and 10μg/ml tetracycline, respectively. Expression
of the fluorescent protein was initiated at regions where tetracycline reached the cells. The increase in fluorescence corresponds to the different tetracycline concentrations applied, i.e., cells exposed to
0.1μg/ml expressed less ZsGreen1-DR protein over time than cells
Gene expression: concentration gradient of inducer Finally, the microdevice was applied to systematic studies of inducer concentrations in parallel on a single device (Fig. 1c-iii). Here, the various solutions were supplied through the different input channels of the bottom channel at the same time. As a proof of concept, two tetracycline concentrations (0.1 and 10 μg/ml) were simultaneously supplied to the cells, separated by a stream of buffer (all flow rates 0.35μl/min). In this configuration, 1/3 of the cells were exposed to the low tetracycline concentration, 1/3 to the high tetracycline concentration, and 1/3 to buffer only. As expected, the data resulted in different fluorescence traces (data not shown) and final protein levels, thereby reflecting the inducer concentration that initiated the fluo-rescence increase (Fig.5).
By applying concentration gradients of the inducer, one could analyze the influence of different stress factors, e.g. toxins, on the T-REx™ system in further studies.
Conclusions
We have developed a two-layer microdevice that ena-bles independent regulation of flow patterns for cell handling and cell stimulation. It allowed monitoring of induced gene expression on the single cell level with transient and spatially resolved induction, which is dif-ficult to achieve on planar platforms. However, this is of particular interest for studies on single cell response, because it allows mechanistic studies, e.g., to elucidate the role of exposure times of compounds. Additionally, this microfluidic platform overcame difficulties concerning shear stress effects induced in other planar microdevices during necessary chip operation such as flow switching. The applicability of the two-layer microdevice for living cell studies was demonstrated by monitoring the tetracycline-induced gene expression in individual cells. Different aspects of induced gene expression, i.e., (i) inducer concentration dependency, (ii) transient induction, or (iii) parallel supply of differ-ent inducer concdiffer-entrations, could be achieved by using different flow profiles for the analyte supply. We believe that this microfluidic platform will be of general interest for applications in systems biology, pharmacy, or bio-technology, in which the effect of perturbations on cells, induced by small molecules, are investigated. In partic-ular, the microdevice is useful for long-term investiga-tions, where slow processes are observed, as well as time-resolved stimulations, where the cells are exposed to only short pulses of a chemical inducer. Our future work will focus on the improvement of the cell trap
designs and the automation of data acquisition and analysis to study larger cell numbers in parallel.
Acknowledgements We thank B. Cvetković and P. Kuhn for the
fabrication of the master forms and SEM images in the FIRST facility at ETH, C. Bärtschi for building the bubble traps, F. Kurth and K. Eyer for helpful discussions, T. Robinson for proofreading the script, and J-C. Leroux for cell storage. The experiments were performed at the light microscopy centre (LMC), ETH. Furthermore the financial sup-port from the European Research Council (ERC Starting Grant No.
203428–2, nμ-LIPIDS) and the Novartis Doctoral Fellowship Program
2010 (to C. Hanke) are gratefully acknowledged.
References
1. Taniguchi Y, Choi PJ, Li GW, Chen H, Babu M, Hearn J, Emili A, Xie XS (2010) Science 329:533–538
2. Toriello NM, Douglas ES, Thaitrong N, Hsiao SC, Francis MB,
Bertozzi CR, Mathies RA (2008) PNAS 105:20173–20178
3. Novick A, Weiner M (1957) PNAS 43:553–566
4. Ko MS, Nakauchi H, Takahashi N (1990) EMBO J 9:2835–2842
5. Cai FL, Xie XS (2006) Nature 440:358–362
6. Rosenfeld N, Young JW, Alon U, Swain PS, Elowitz MB (2005)
Science 307:1962–1965
7. Raser JM, O’Shea EK (2004) Science 304:1811–1814
8. Blake WJ, Kaern M, Cantor CR, Collins JJ (2003) Nature
422:633–637
9. Elowitz MB, Levine AJ, Siggia ED, Swain PS (2002) Science
297:1183–1186
10. Ozbudak EM, Thattai M, Kurtser I, Grossman AD, van Oudenaarden
A (2002) Nat Genet 31:67–73
11. McAdams HH, Arkin A (1997) PNAS 94:814–819
12. Swain PS, Elowitz MB, Siggia ED (2002) PNAS 99:12795–12800 13. Raj A, van Oudenaarden A (2009) Annu Rev Biophys 38:255–270 14. Schmid A, Kortmann H, Dittrich PS, Blank LM (2010) Curr Opin
Biotechnol 21:12–20
15. Lindström S, Andersson-Svahn H (2010) Lab Chip 10:3363–3372
16. Hardt S, Schönfeld F (eds) (2007) Microfluidic technologies for miniaturized analysis systems. Springer, New York
17. Dittrich PS, Manz A (2006) Nat Rev Drug Discov 5:210–218
18. El-Ali J, Sorger PK, Jensen KF (2006) Nature 442:403–411
19. Lovchik RD, Bianco F, Matteoli M, Delamarche E (2009) Lab
Chip 9:1395–1402
20. Zhang S, Yan L, Altman M, Lässle M, Nugent H, Frankel F, Lauffenburger DA, Whitesides GM, Rich A (1999) Biomaterials
20:1213–1220
21. Folch A, Toner M (1998) Biotechnol Prog 14:388–392
22. Park MC, Hur JY, Cho HS, Park S-H, Suh KY (2011) Lab Chip
11:79–86
23. Schaffhauser D, Andrini O, Ghezzi C, Forster IC, Franco-Obregon A, Egli M, Dittrich PS (2011) Lab Chip 11:3471–3478
24. Skelley AM, Kirak O, Suh H, Jaenisch R, Voldman J (2009) Nat Methods 6:147–152
25. Di Carlo D, Aghdam N, Lee LP (2006) Anal Chem 78:4925– 4930
26. Ryley J, Pereira-Smith OM (2006) Yeast 23:1065–1073
27. Kortmann H, Kurth F, Blank LM, Dittrich PS, Schmid A (2009)
Lab Chip 9:3047–3049
28. Fiedler S, Shirley SG, Schnelle T, Fuhr G (1998) Anal Chem
70:1909–1915
29. Brouzes E, Medkova M, Savenelli N, Marran D, Twardowski M, Hutchison JB, Rothberg JM, Link DR, Perrimon N, Samuels ML
30. Shim J-U, Olguin LF, Whyte G, Scott D, Babtie A, Abell C, Huck
WTS, Hollfelder F (2009) J Am Chem Soc 131:15251–15256
31. Cai L, Friedman N, Xie S (2006) Nature 440:358–362
32. Unger MA, Chou HP, Thorsen T, Scherer A, Quake SR (2000) Science 288:113–116
33. King KR, Wang S, Jayaraman A, Yarmush ML, Toner M (2008) Lab Chip 8:107–116
34. Kim D-H, KinWong P, Park J, Levchenko A, Sun Y (2009) Annu Rev Biomed Eng 11:203–233
35. Kurth F, Schumann CA, Blank LM, Schmid A, Manz A, Dittrich
PS (2008) J Chromatogr A 1206:77–82
36. Schumann CA, Dörrenhaus A, Franzke J, Lampen P, Dittrich PS,
Manz A, Roos PH (2008) Anal Bioanal Chem 392:1159–1166
37. Fa K, Tulock JJ, Sweedler J, Bohn PW (2005) J Am Chem Soc
127:13928–13933
38. Hillen W, Berens C (1994) Annu Rev Microbiol 48:345–369
39. Yao F, Svensjö T, Winkler T, Lu M, Eriksson C, Eriksson E (1998) Hum Gene Ther 9:1939–1950
40. Li X, Zhao X, Fang Y, Jing X, Duong T, Fan C, Huang C-C, Kain SR (1998) J Biol Chem 273:34970–34975
41. Kuhn P, Eyer K, Allner S, Lombardi D, Dittrich PS (2011) Anal Chem 83:8877–8885
42. Zhang L, Patel HN, Lappe JW, Wachter RM (2006) J Am Chem
Soc 128:4766–4772
43. Borst P, Evers R, Kool M, Wijnholds J (1999) Biochim Biophys