HAL Id: hal-00995798
https://hal.archives-ouvertes.fr/hal-00995798
Preprint submitted on 24 May 2014
HAL is a multi-disciplinary open access archive for the deposit and dissemination of sci-entific research documents, whether they are pub-lished or not. The documents may come from teaching and research institutions in France or abroad, or from public or private research centers.
L’archive ouverte pluridisciplinaire HAL, est destinée au dépôt et à la diffusion de documents scientifiques de niveau recherche, publiés ou non, émanant des établissements d’enseignement et de recherche français ou étrangers, des laboratoires publics ou privés.
Macroeconomic assessment for the EU ’Climate Action
and Renewable Energy Package’
Pascal da Costa, Oualid Gharbi, Pierre Le Mouel, Florent Pratlong, Danielle
Schirmann-Duclos, Paul Zagamé
To cite this version:
Pascal da Costa, Oualid Gharbi, Pierre Le Mouel, Florent Pratlong, Danielle Schirmann-Duclos, et al.. Macroeconomic assessment for the EU ’Climate Action and Renewable Energy Package’. 2010. �hal-00995798�
Macroeconomic assessment for the EU ‘Climate
Action and Renewable Energy Package’
Pascal da Costa, Oualid Gharbi, Pierre Le Mouel,
Florent Pratlong, Danielle Schirmann-Duclos, Paul Zagamé *
European Research Contract Foresight and Assessment of Environmental
Technologies (FORASSET), ordered by European Commission Direction of
Research (DG-RES), within the 6th Framework Program on Research, coordinated by Centre d’Observation Economique / Chambre de Commerce et d’Industrie de Paris (COE / CCIP) : 2005-2008.
Presented to the 17th Annual Conference of the European Association of Environmental and Resource Economists (EAERE), Session: EU Climate Policies Post Kyoto, Amsterdam, Saturday 27 June 2009.
Abstract: This paper propose an assessment for European Commission ‘Package of Implementation measures for the EU’s objectives on climate change and renewable energy for 2020’, that was agreed the 23 January 2008. The policy assessment uses macroeconomic modeling tools: NEMESIS economic macro-econometric model, for which additional developments were needed to be able to implement strictly the directive proposals includes in EU ‘Energy and Environment’ package. A new module for energy demand and environment was developed to extend from EU-15 to EU-27 NEMESIS set of energy and environment indicators, with also an extension for biomass (including biofuels) and all renewable categories. The focus puts on the economic consequences in 2020 of the joint implementation of the ‘EU ETS review’, ‘non ETS effort-sharing’ and ‘renewables’ directive and decision proposals. Different scenarios are explored depending on the way auctioning revenues are recycled by States, and compared on the basis of economic and environmental efficiency criteria defined by the Commission. In Scenario S1, auctioning revenue is kept by states and is used for decreasing national debt. There is no recycling through public investment or revenue redistribution to private agents. In scenario S2, the revenue of auctioning in the EU ETS sector is recycled through an equivalent reduction, in terms of revenue, of employers’ social contribution rate. In scenario S3, auctioning revenue is recycled in two ways: A reduction, as in scenario S2, of employers’ social contributions rate, and a general subsidy to private R&D expenditures up to 30 %. The R&D subsidy in calculated first, and only the difference between auctioning revenue and R&D subsidies is used to reduce employers’ social contribution rate. The main important results are that the implementation of EU Climate Action and Renewable 1Energy Package should have only a limited cost in terms of GDP for EU-27, or even a negative one, depending the way auctioning revenues are recycled by Member States; important gains could be obtained for consumers if recycling of auctioning revenue is used to increase households’ disposable income; employment could also be importantly stimulated if the recycling of revenue, and the stimulation of households’ final consumption, passes through a reduction of labor cost and not by an increase in social transfers that could impact negatively on European firms competitiveness; and lastly the application of the community solidarity principle could EU Climate Action and Renewable Energy Package represent an important opportunity for growth and employment in EU countries with GDP below European average like Romania and Poland, that are also very carbon intensive.
Introduction
European Commission agreed the 23 January 2008 a ‘Package of Implementation measures for the EU’s objectives on climate change and renewable energy for 2020’. This ‘Climate Action and Renewable Energy Package’ contains the following proposals:
- a directive amending directive 2003/87/EC so as to improve and extend the EU greenhouse gas emission allowance trading system (‘EU ETS review’);
- a decision on the effort of EU member states to reduce their greenhouse gas emissions to meet the Community's greenhouse gas emission reduction commitments up to 2020 (‘non ETS effort-sharing’);
- a directive on the promotion of the use of renewable energy sources (‘renewables directive’);
- a directive on the geological storage of carbon dioxide (‘CCS directive’). These proposals, accompanied with impact assessments, establish a set of key principles for EU post-Kyoto policy over the period 2011-2020 and beyond, with two main targets for 2020, already defined in the energy and climate change package adopted by the Commission the 10 January 2007:
- an independent EU commitment to achieve a reduction of at least 20 % in the emission of greenhouse gases by 2020 compared to 1990 levels and the objective of a 30 % reduction by 2020, subject to the conclusion of a comprehensive international climate change agreement;
- a mandatory EU target of 20 % renewable energy by 2020 including a 10 % biofuels target.
This strategy was endorsed both by the European Parliament and by EU leaders at the March 2007 European Council. The ‘Climate Action and Renewable Energy Package’ adopted the 23 January 2008 by the Commission is a concrete set of proposals to reach these targets, including how efforts could be shared among Member States. In particular:
- the ‘EU ETS review’ aims at increasing the efficiency and the scope of the EU ETS, notably by including chemical and air transport sectors and by decreasing the emissions caps1, with an reduction objective of 21 % for CO2 emissions in
2020, compared to 1990;
- the ‘non ETS effort-sharing’ aims at sharing the emission reduction effort amongst member states in the sectors not covered by the EU ETS in order to reach the EU's 20 and 30 % emission reduction commitments. The proposal is based on efforts by member states on the principles of growth, fairness and solidarity;
- the ‘renewables directive’ aims at promoting the use of energy from renewable sources by setting national targets ensuring that the share of renewable energy in EU final energy consumption reaches at least 20 % by 2020;
- the CCS directive aims at allowing and regulating the capture of CO2 from
industrial installations and its storage into a suitable geological formation.
1
The EU introduced from 2005 to 2007 the first phase of the EU-ETS, corresponding to the NAP1 commitments on emissions, that resulted in a very low carbon price due to too high emission caps. Thereafter the EU agreed from 2008 to 2012 the second phase of EU-ETS, with tougher objectives on GHG emissions reductions.
The ‘Climate Action and Renewable Energy Package’ aims thus providing EU, up to 2020, a strategy for increasing the use of renewable energies and developing incentives towards clean production technologies through a reform on the EU ETS. This strategy will also strengthen EU energy security of supply and preserve economic growth.
Compared to 2005, the last year for GHG emissions measurement by European Environment Agency2, the ‘Climate Action and Renewable Energy Package’ represents a 10.8 % reduction of GHG emissions in Europe, in the case of an unilateral commitment of European countries on GHG emissions, and 20.8 % in case of an international climate change agreement (and respectively 13.7 % and 23.7 % compared to projected emissions levels for 2020). It recommends consequently investing at least 20 % of the revenues derived from GHG taxes and auctioning in strategic sectors for climate change (such as specific R&D, renewable energies, forestry and land use, energy savings in buildings, etc.).
The main objective of this paper is now to provide an assessment with the NEMESIS model (New Econometric Model for Evaluation by Sectoral Interdependencies and Supply) of this EU ‘Climate Action and Renewable Energy Package’. The focus is put on the economic consequences in 2020 of the joint implementation of the ‘EU ETS review’, ‘non ETS effort-sharing’ and ‘renewables’ directive and decision proposals. Different scenarios are explored depending on the way auctioning revenues are recycled by States, and compared on the basis of economic and environmental efficiency criteria defined by the Commission. A special emphasis is also put on the influence of technological change on economic and environmental indicators in the different scenarios studied with NEMESIS. NEMESIS includes an endogenous R&D decisions module, and this feature of the model is actually important to assess for climate and energy policies, which induce substitution and revenue effects, but come also modify R&D investment decisions of agents and the rate and direction of technical change.
The presence of endogenous technical change in NEMESIS is also important to underline for the reason that it can modify the cost of the policies assessed previously with other models where technical change is considered exogenous, as for the impact assessment3 accompanying the EU ‘Climate Action and Renewable Energy Package’. The measured cost is generally lower when technical change is endogenous, as firms’ have an increased reaction capacity to the introduction of a carbon value; they can do substitutions but also, and that is a novelty of NEMESIS, modify the rhythm of technical change. Also, the presence of endogenous technical change in NEMESIS allows new evaluations of Kyoto policies, grounded on R&D and knowledge. This paper gives notably an example of GHG emissions reduction policy implemented by combination of carbon taxation and tradable permits (in order to fight the negative environmental externalities) and of subsidies to R&D (in order to promote positive knowledge and productivity externalities).
The first part (section 2) of this paper is a methodological one. It begins with a presentation of the modelling tools used, notably a module for energy demand and GHG emissions that was developed specially for this impact assessment. Then the way the ‘Climate Action and Renewable Energy Package’ was implemented in the modelling
2
‘Greenhouse gas and emission trends and projections in Europe 2007’, EEA report, N° 5/2007.
3
tools is detailed. The second part of this paper (section 3) presents the baseline scenario. It describes in details the evolution of the main energy and environment indicators from 2005 up to 2020. It explains also that, to render things comparable, common assumptions with the version of PRIMES model used to realized the impact assessment joined to the EU climate and energy package where used, especially for the structure of energy supply, and renewable energies penetration rates. The third part (section 4) comments the main results of the scenarios, at EU, national and sectoral levels, of the three scenarios assessed for: S1 with no recycling of auctioning revenues, S2, with recycling of auctioning revenues with a cut in employers social contributions rate and S3, that combine a recycling with a cut in employers’ social contribution rate, similar to S2, with a subsidy to firms’ R&D. The fifth section of this paper concludes, notably by comparing the results of the assessment realized with NEMESIS, to the assessments already presented by Commission staff4. An appendix gives finally additional detailed results for EU-27 countries.
1- Modeling tools and scenarios implementation
The assessment of the ‘Climate Action and Renewable Energy Package’ requires adapted modeling tools, with notably the following characteristics:
1- detailed sectors distinguishing EU ETS and non EU ETS;
2- detailed energy products and power sector, allowing in particular calculating the share of renewable in final consumption and biofuels share in transports fuels use;
3- GHG emissions calculation (CO2 and other);
4- EU ETS representation with endogenous determination of carbon values and auctioning revenue;
5- recycling possibilities of auctioning and carbon taxes revenues, for example with equivalent reduction of direct taxation of firms or households, cuts in employers’ social contribution rate, subsidies to firms’ R&D expenditures, etc. Some of these characteristics where not, or only incompletely present in NEMESIS, at the beginning of FORASSET project, principally for point 2 to point 4 above. This has implied to adapt NEMESIS modeling system and then to establish an implementation protocol of the ‘Climate Action and Renewable Energy Package’ in the model, as explained below.
1.1- Presentation of modeling tools
NEMESIS model is composed of two main components:
- a large scale economic macro-econometric model, the ‘core’ of NEMESIS5, designed for EU-27 countries (with the exception of Cyprus and Bulgaria for which data are missing) plus Norway, to which a set of optional or satellite modules can be added for Agriculture, Land-Use and NUTS-2 regions, which account altogether about 200.000 equations and calculated variables;
- a detailed technico-economic model for EU-15 countries, NEEM (NEMESIS Energy Environment Module) of about 100.000 equations, which is a partial
4
see footnote 3 and annex to impact assessment SEC(2008) 85 Vol.II.
5
equilibrium model for energy demand and supply, and GHG emissions calculation, developed by National technical University of ATHENS (NTUA). NEMESIS core economic model can be linked to NEEM through an interface that exogenizes in NEMESIS the energy/environment variables calculated by NEEM. During a policy simulation exercise, NEMESIS and NEEM exchange, as described on figure 1, variables that are endogenous in one model (energy/environment in NEEM economic in NEMESIS) and exogenous in the other, with iterations that stop once the value of the variables exchanged in the interface do not modify any more between the n (convergence attained) and n-1 iterations, or change with a percentage inferior to a predefined convergence criteria.
Figure 1: Functioning of Interface between NEMESIS and NEEM
The linkage between NEMESIS and NEEM was in this way used previously to assess for different efficient scenarios on carbon taxation policies for EU ETS and non EU ETS sectors. But NEEM was developed for EU-15 countries only, and the assessment for the EU ‘Climate Action and Renewable Energy Package’ presented here, needed to be realized at EU-27 level. Furthermore, it was not foreseen in FORASSET description of work, to extend NEEM to EU-12 countries, and no budget was allocated for this task. For these reasons, it was decided by the ERASME team to develop, with the help of NTUA, a new energy/environment module limited to energy demands and substitutions system, and GHG emissions (CO2, CH4, N2O, SF6, HFC and PFC) that was included directly in
NEMESIS core economic model, as a new optional module.
The key characteristics of this NEMESIS Optional Module for Energy Demand and Environment (NOMEDE) were designed following the 5 items list above, and allows accounting for the main objectives, targets and sub-targets of the EU ‘Climate Action and Renewable Energy Package’. It calculates notably, for each EU-27 country (except Cyprus and Bulgaria), the renewable share in final energy consumption and the share of biofuels in gasoline and diesel used by transports sector. It can also compute the share of renewable in power generation sector.
NOMEDE was based on EUROSTAT data for energy products (Coal, Gas, Petrol, and Electricity), biomass (Biofuels, Biogas, Wood and Wood Wastes) and Urban Wastes, and on European Environmental Agency for GHG emissions data. It is more detailed that NEEM, that do not includes biomass, for energy demand categories, but is less detailed in the area of energy demand and supply technologies.
For energy demand, NOMEDE takes the global quantities calculated by NEMESIS core economic model from the 30 production functions of NEMESIS sectors and
INTERFACE Iterations Until Convergence For Exchanged Variables NEMESIS Endogenous Economy Exogenous Energy Environment Variables Status NEEM Endogenous Economy Exogenous Energy Environment Variables Status
households energy consumption categories (Coal, Gas, Petrol, and Electricity), and calculates energy demand by product, including biomass categories, and energy prices, that are sent back to NEMESIS. Energy supply in then determined by NEMESIS production functions for energy sectors, on the basis of energy demand by product calculated by NOMEDE, and energy import and export functions included in NEMESIS. For the power sector, response functions, derived from NEEM simulation exercises (see figure 2), allow calculating the shares of solar and win, while geothermal, hydraulic and nuclear production capacities were considered exogenous, and were based on PRIMES latest projections6 for EU DG-Trend.
NOMEDE includes finally a tradable permits module, that cans implement endogenous carbon taxes and simulate different tradable permit systems (free allocation, full auctioning and combination of the two, as in the EU ‘Climate Action and Renewable Energy Package’), and different taxes and auctioning revenue-recycling scheme.
Figure 2: NOMEDE calibration procedure
For policy experimentations, NOMEDE baseline was partly calibrated onto PRIMES results. It was the case for renewable share evolution in power generation sector and electricity production from Geothermal, Hydraulic and Nuclear sources. For biofuels share in gasoline and diesel. For fuel inputs in power generation sector and fuels’ efficiency factors in power generation and in transport sector (passengers and freight).
Consequently, NOMEDE allows calculating in baseline energy consumptions and GHG emissions close from PRIMES model, that was already used to assess for EU
6
“Energy and Transport: Trends to 2030 – Update 2007”, European Commission/ Directorate-General for Energy and Transport.
(1) NEMESIS (2) NOMEDE (2) NEEM (3) Key elasticities and response functions for solar
and win Reference
Scenario for Economy
Analytical shocks on oil, gas, and coal prices
&
EU ETS and non EU ETS application of EU ‘Climate Action and
Renewable Energy Package’ (see D7)
‘Climate Action and Renewable Energy Package’ together with GAINS, GEM-E3, PACE and POLES models. This presents the advantage that the differences in results between the assessments presented here, and the previous assessments that were performed for the commission, can be attributed to these discrepancies in model mechanisms and in policy assumptions, not to baseline evolutions.
1.2- Implementation protocol of ‘Climate Action and Renewable Energy
Package’ in modeling tools
Modeling tools presented in the preceding section 2.1, with NOMEDE included in NEMESIS were then used to assess for the EU ‘Climate Action and Renewable Energy Package’. This section 2.2 details now the protocol used to proceed to this assessment that can differ from previous assessments achieved for the Commission (SEC(2008) 85 Vol. II) on several points:
1. for GHG emissions reduction, only the 20 % target for 2020 compared to 1990 levels was studied, for the reason that NEMESIS model, built for EU-27 countries only, is not suited to deal with world carbon markets and clean development mechanisms implied by the 30 % reduction target;
2. NEMESIS cannot impose emissions constraints on GHG emissions other than CO2. This does not change anything for EU ETS sector where the emissions
reduction objective concerns CO2 only. For non EU ETS sector on the contrary,
this imposed to put all the reduction effort on CO2 only (to reach the overall 20 %
reduction for GHG in CO2 equivalent), leading for greater reductions for CO2
emissions, and lower reductions for other GHG, than in other assessments; 3. CCS directive could not be taken into account also, and this could lead to the
calculation of greater values for carbon price than in other assessments;
4. No re-investments where imposed of 20 % of auctioning revenues in strategic sectors for energy savings and climate change. This was replaced in one scenario by a subsidy to firms’ R&D that increases productivity and consequently decreases energy intensity of productive sectors and consumption goods.
The other aspects of the implementation protocol in NEMESIS conform globally the lines of the ‘climate Action and Renewable Energy Package’ that are detailed below in four points:
1. the setting of emissions constraint in EU ETS and non EU ETS sectors; 2. the sharing of renewable energies objective between member states; 3. calculation of auctioning revenue by member states;
4. the recycling of auctioning revenue which leads to distinguish three different scenarios
1.2.1- The setting of emissions constraint in EU ETS and non EU ETS
sectors
EU ETS sectors
The third phase of EU ETS that will begin in 2013 include sectors not covered by phase 2 system. It the NEMESIS nomenclature, it concerns 10 distinct production sectors (see table 1) regrouping energy intensive industries and air transports, that the third phases adds together with chemical industry.
Table 1: NEMESIS participation to EU ETS 04 - Gas-Distribution 05 - Refined-Oil 06 – Electricity 08 - Ferrous&NonFerrous-Metals 09 - Non Metalic-Mineral-Production 10 – Chemicals 11 - Metal-Products 18 - Paper&Printing-Production 19 - Rubber&Plastic 25 - Sea&Air-Transport
Compared to 2005, the ‘EU ETS review’ fixes a CO2 linear reduction objective of 1.74
% per year from 2013 to 2020 with a target for 2013 that will be based on the average emission level of the period 2008-2012. In terms of GHG emissions, a reduction of -18.2 % is expected, compared to 2005 levels. The CO2 emission constraint for ETS sectors is
identical for all EU member states. In every countries, the quantity of allowances distributed per sector is set in NEMESIS following the grandfathering principle, that is to say proportionally to the contribution of the sector to EU ETS CO2 average emissions for
the period 2008-2012. There is free trade of CO2 quotas between countries and sectors.
Finally, to conform again the lines of ‘EU ETS review’ proposal, allowances are attributed by full auctioning from 2013 in power sector. For other sectors, 80 % of allowances are attributed freely in 2013 and 80 % by auctioning. The share of auctioning increases linearly and reaches 100 % in 2020.
Non EU ETS sectors
For non EU ETS sectors, GHG emissions reduction target are fixed following verified emissions levels in 2005, with a sharing of emission reduction effort amongst member states based on the principles of growth, fairness and solidarity, and assuring to reach the EU's 20 % emission reduction commitments.
In terms of NEMESIS nomenclature, non EU ETS covers 20 production sectors, displayed in table 2 and includes also GHG emissions by households.
Table 2: NEMESIS non EU ETS sectors 01 – Agriculture 02 - Coal&Coke 03 - Oil&Gas-Extrac 07 - Water-Supply 12 - Agric&Industr-Machines 13 - Office-Machines 14 - Electrical-Goods 15 - Transport-Equipment 16 - Food-Drink&Tobacco 17 - Textile-Clothes&Footwear 20 - Other-Manufactures 21 – Construction 22 – Distribution 23 - Lodging&Catering 24 - Inland-Transports 26 - Other-Transport, 27 – Communication 28 - Bank-Finance&Insurance 29 - Other-Market-Services 30 - Non-Market-Services
In NEMESIS, national targets are reached by imposing in each country GHG emissions caps that are lowered linearly from 2013 to 2020. Emissions caps are imposed by introducing in each country an endogenous tax on non-EU-ETS CO2 emissions,
identical for all production sectors and households. This carbon taxation is integrally redistributes to firms and households by equivalent subsidies to production and increases in disposable income. In this way, carbon taxation provokes substitutions effects (between energy products and energy and other products and production factors) necessary to reach the target, but no revenue effects. It is in this sense fiscally neutral, and this was the best option in the absence of precise information onto the preferred actions for limiting GHG emissions in the different countries
Figure 3: Reduction targets per country for non EU-ETS sectors in 2020 compared to 2005
GHG emissions target goes from -20 % in richer member states as Denmark to +20 % in poorest countries as Bulgaria.
1.2.2- The sharing of
renewable energies objective between member statesFor renewable energies objective of 20 % share in final energy consumption for EU-27, no specific targets were set by Member State and consequently no specific policies as subsidies for the adoption of renewables, in addition from policies already in place and accounted for in the baseline scenario. As it will be discussed below in the section that present NEMESIS/NOMEDE baseline scenario, the high oil and gas price context that taken place in recent years allow increasing economic competitiveness of renewable energy sources, such as win in power generation and biofuels in transport sector.
5% 3% 13% 19% 14% 15% 17% 10% 11% 9% 20% -16% -17% -10% 1% -16% -20% -13% -20% -4% -14% -16% -20% -15% -16% -14% -30% -20% -10% 0% 10% 20% 30% Malta Slovenia Slovakia Romania Poland Lithuania Latvia Hungary Estonia Czech Republic Bulgaria United Knigdom Sweeden Spain Portugal Netherlands Luxembourg Italy Ireland Greece Germany France Finland Denmark Belgium Austria
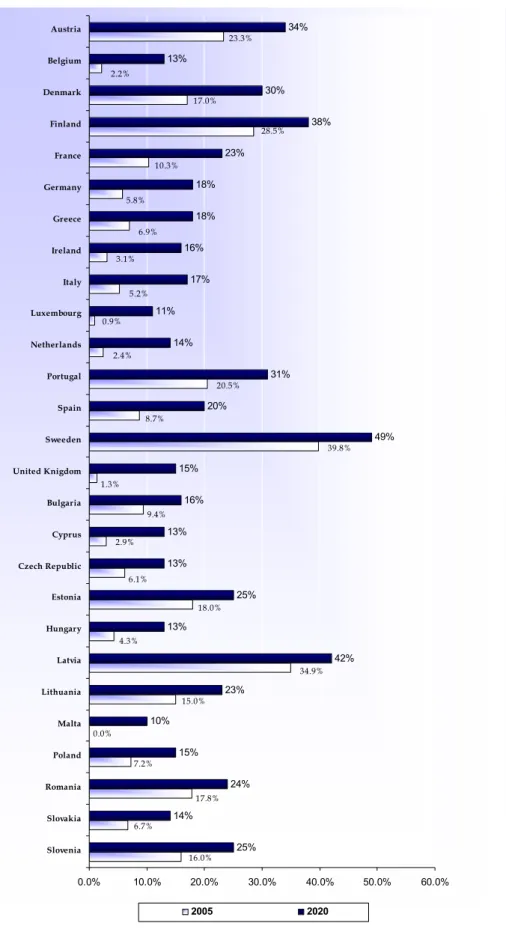
The scenarios studied for assessing for the EU ‘Climate Action and Renewable Energy Package’ shown furthermore that the 20 % renewable target could be spontaneously reached, or approached closely, at horizon 2020, as a consequence of the important rise in carbon price necessary for reaching EU post-Kyoto objectives. It is true equally at country level, many EU Member States being able come close their renewable potential, illustrated by figure 4.
For biofuels share in transports gasoline and diesel, the 10 % objective is also reached spontaneously as a consequence of baseline assumptions and scenarios evolutions, and no specific policies were then considered.
For both renewables and biofuels share objective, baseline evolutions by country were adapted from PRIMES projections (
“Energy and Transport: Trends to 2030 – Update
2007”, European Commission/ Directorate-General for Energy and Transport.
), with differences resulting principally from the use of different oil reference price in PRIMES and NEMESIS baseline projections.Figure 4: EU-27 countries potential for renewable energies, as % of final energy consumption
Source: European Commission, Directive of the parliament and of the council on the promotion of the use of energy from
renewable sources, com (2008) 30 final.
25% 14% 24% 15% 10% 23% 42% 13% 25% 13% 13% 16% 15% 49% 20% 31% 14% 11% 17% 16% 18% 18% 23% 38% 30% 13% 34% 5.8% 2.2% 23.3% 17.0% 28.5% 10.3% 6.9% 3.1% 5.2% 0.9% 2.4% 20.5% 8.7% 39.8% 1.3% 9.4% 2.9% 6.1% 18.0% 4.3% 34.9% 15.0% 0.0% 7.2% 17.8% 6.7% 16.0% 0.0% 10.0% 20.0% 30.0% 40.0% 50.0% 60.0% Slovenia Slovakia Romania Poland Malta Lithuania Latvia Hungary Estonia Czech Republic Cyprus Bulgaria United Knigdom Sweeden Spain Portugal Netherlands Luxembourg Italy Ireland Greece Germany France Finland Denmark Belgium Austria 2005 2020
1.2.3- Calculation of auctioning revenue by Member States
In the scenarios considered with NEMESIS, there is no revenue generation, and consequently no revenue recycling from non EU ETS sectors GHG emissions taxation. For ETS sectors on the contrary, as quoted in section 1.2.2, CO2 quotas generate revenue
from auctioning, that increase gradually between 2013 and 2020 with the yearly diminution of emissions caps and the increasing share of CO2 to be auctioned.
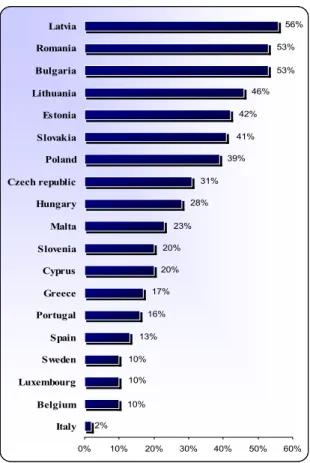
Figure 5: Percentage of increase in allowances to be auctioned for the purpose of community solidarity
Source: European Commission (Proposal Directive to Improve and extend the Greenhouse Gas Emission Allowance Trading System COM(2008))
Auctioning revenue in each Member state takes furthermore into account the fact that 10 % of auctioning revenue should be used for the purpose of community solidarity. More precisely, 90 % of auctioning rights are distributes accordingly to Member States share in 2005 emissions in the EU ETS, and the remaining 10 % are redistributed to low income countries, taking into account their GDP per capita and their overall growth expectations.
This distribution of auctioning rights results in significant reduction of overall direct costs experienced by member states with a low GDP per capita, with limited direct costs increases for richer countries. Revenues generated by auctioning are actually substantial. They can reach, depending the scenario studied, about 0.8 % European GDP in 2020, and they can exceed 1.5 % GDP in countries as
Romania, Slovakia and Poland that
beneficiate the more from the solidarity principle.
Thus, some member states, especially in new accessing countries, receive and redistribute more than their auctioning quotas, as resumed on figure 5.2% 10% 10% 10% 13% 16% 17% 20% 20% 23% 28% 31% 39% 41% 42% 46% 53% 53% 56% 0% 10% 20% 30% 40% 50% 60% Italy Belgium Luxembourg Sweden Spain Portugal Greece Cyprus Slovenia Malta Hungary Czech republic Poland Slovakia Estonia Lithuania Bulgaria Romania Latvia
1.2.4- R
ecycling of auctioning revenue: three different scenariosThree distinct scenarios are considered, that differ from the use of EU ETS auctioning revenue by Member States:
- in scenario S1, auctioning revenue is kept by States and used for decreasing national debt. There is no recycling through public investment or revenue redistribution to private agents;
- in scenario S2, revenue of auctioning in EU ETS sector is recycled through an equivalent reduction, in terms of amount, of employers’ social contribution rate; - in scenario S3, auctioning revenue is recycled in two ways: A reduction, as in scenario S2, of employers’ social contributions rate, and a general subsidy to private R&D expenditures up to 30 %. The R&D subsidy in calculated first, and only the difference between auctioning revenue and R&D subsidies is used to reduce employers’ social contribution rate.
Results for scenario S1 will thus allow assessing for direct impacts of increasing carbon price, while results for scenarios S2 and S3 will indicate the extent to which the economic costs of EU post-Kyoto can be alleviate, or even fully compensated, by a transferring fiscal weight from labor and R&D to carbon and other GHG.
2- Baseline evolutions for energy and environment indicators
For the baseline scenario, it is assumed that only policies already in place in 2007 are active and that current ETS system continues to operate, with a low price for carbon that rises from 20 constant € 2005 /ton CO2 equivalent in 2008 up to 23 constant € 2005 euros
in 2020.
The baseline evolutions differ slightly to account for the most recent trends onto energy prices (see figure 6). The high oil prices observed on the past two years are supposed to persist but with a slow decrease from 107 € in 2008 to 68 € 2015, and then progressive re-augmentation until 76 € in 2020. Oil price is derived from PROMETHEUS projections (NTUA). It accounts for continuous resource constraint, rapid growth of world oil demand and high extraction costs. Gas prices were indexed on oil price while coal price was supposed to grow at lower rates in reason of high coal resources level.
These high oil and energy prices have a negative impact on GDP growth rate in EU-27, that establish to 2.34 % in annual average growth rate for the period 2005-2020. GDP growth rate stays high, thanks notably to high exports toward countries outside Europe.
GDP growth stays higher for new Member States, with an increase of 78 % on the period 2005-2020 against only 37 % for Eu-15 countries, and 37 % for EU-27.
Figure 6: Evolution of oil price in constant € 2005
Table 3: Evolution of GDP in EU-27 countries between 2005 and 2020, baseline scenario
At sectoral level, production growth in EU-27 stays strong in EU-ETS sectors, with an increase of 42 % between 2005 and 2020, due notably to the dynamism of chemical and air transports industries. Non EU ETS sectors grow about 35 % on the same period.
0 20 40 60 80 100 120 2005 2006 2007 2008 2009 2010 2011 2012 2013 2014 2015 2016 2017 2018 2019 2020 2005 2010 2015 2020 2005-10 2010-15 2015-20 2005-20 Annual % Change Austria 100 108 122 134 1.64 2.30 2.05 2.00 Belgium 100 105 119 133 0.93 2.55 2.26 1.91 Denmark 100 106 125 130 1.19 3.34 0.84 1.78 Germany 100 105 116 128 0.91 2.16 1.90 1.65 Finland 100 115 136 156 2.87 3.32 2.78 2.99 France 100 107 121 137 1.34 2.58 2.42 2.11 Greece 100 112 136 158 2.38 3.85 3.02 3.08 Irland 100 121 149 176 3.85 4.27 3.42 3.85 Italy 100 101 112 124 0.22 2.13 1.97 1.44 Luxembourg 100 121 147 174 3.88 3.94 3.50 3.78 Netherlands 100 110 127 144 1.85 3.07 2.45 2.45 Portugal 100 101 113 128 0.17 2.21 2.65 1.67 Spain 100 113 134 154 2.46 3.46 2.86 2.93 Sweeden 100 114 138 160 2.71 3.84 3.06 3.20 United Kingdom 100 111 128 144 2.03 3.04 2.36 2.47 Czech Republic 100 124 151 181 4.37 4.04 3.69 4.03 Estonia 100 150 223 290 8.50 8.17 5.40 7.35 Latvia 100 141 197 250 7.15 6.93 4.86 6.31 Lithuania 100 130 172 211 5.40 5.72 4.20 5.11 Hungary 100 111 134 157 2.08 3.83 3.23 3.04 Malta 100 111 130 153 2.07 3.29 3.31 2.89 Poland 100 116 143 172 3.09 4.25 3.70 3.68 Slovenia 100 121 150 179 3.84 4.41 3.65 3.97 Slovakia 100 126 157 193 4.71 4.57 4.12 4.47 Romania 100 117 152 185 3.14 5.48 3.96 4.19 EU-15 100 107 122 137 1.40 2.69 2.28 2.12 EU-12 100 119 148 178 3.52 4.48 3.77 3.92 EU27 100 108 123 139 1.46 2.80 2.33 2.20
Table 4: Production growth in EU ETS and non EU ETS sectors, baseline scenario
For energy demand, the baseline evolutions show the continuation of energy efficiency improvement already observed in the past period. Final energy consumption increases 20 % in EU-27 over the period 2005-2020 (table 5) against 39 % for GDP.
Table 5: Final energy demand in EU-27, baseline scenario
Gains in energy efficiency come partly from exogenous assumptions for fuel efficiency in passengers and freight transport and in thermal electricity production, that were taken from PRIMES model7, that was used to assess for the EU ‘Climate Action and Renewable Energy Package’8. Energy efficiency gains results also from the high oil and gas prices that combined with the carbon value in EU ETS sector lead to high-energy prices, and from continued de-materialization of industrial production and the development of services in European economies.
Table 6: Primary energy demand by product in EU-27, baseline scenario
7
“Energy and Transport: Trends to 2030 – Update 2007”, European Commission/ Directorate-General for Energy and Transport.
8
The package consists of legislative proposals including three actions: a) Amendment of Directive 2003/87/EC so as to improve and extend the EU greenhouse gas emission allowance trading system; b) Decision on the effort of Member States to reduce their greenhouse gas emissions to meet the Community’s greenhouse gas emission reduction commitments up to 2020; c) Directive on the promotion of use of renewable energy sources.
2005 2010 2015 2020 2005-10 2010-15 2015-20 2005-20 Annual % Change
Agriculture 100 99 101 103 -0.12 0.26 0.47 0.20
Industry 100 109 121 137 1.74 2.17 2.43 2.11
- energy Intensive industries 100 110 123 140 1.86 2.36 2.66 2.29
- other industries 100 109 120 135 1.67 2.06 2.30 2.01
Construction 100 109 121 139 1.66 2.27 2.72 2.22
Tertiary 100 108 120 136 1.56 2.18 2.51 2.08
Transport 100 111 126 146 2.08 2.66 2.89 2.54
- see & air 100 114 134 156 2.64 3.22 3.21 3.02
- road & rail 100 109 123 140 1.80 2.35 2.72 2.29
EU-ETS sectors 100 110 124 142 1.94 2.45 2.72 2.37
Non EU-ETS sectors 100 108 120 135 1.56 2.12 2.45 2.04
2005 2010 2015 2020 2005-10 2010-15 2015-20 2005-20 in toe
Agriculture 100 107 118 129 0.03 0.03 0.03 0.03
Energy branch 100 97 101 106 0.07 0.07 0.07 0.07
Industry 100 101 106 112 0.25 0.24 0.24 0.23
- energy Intensive industries 100 99 103 107 0.18 0.18 0.17 0.16
- other industries 100 105 114 123 0.07 0.07 0.07 0.07
Residential 100 105 116 128 0.16 0.17 0.17 0.17
Tertiary 100 104 113 122 0.11 0.11 0.11 0.11
Transport 100 103 113 124 0.38 0.38 0.39 0.39
- see & air 100 109 128 147 0.04 0.05 0.05 0.05
- road & rail 100 102 111 121 0.34 0.34 0.34 0.34
EU-ETS sectors 100 100 106 113 0.29 0.28 0.28 0.27
Non EU-ETS sectors 100 104 113 123 0.70 0.71 0.71 0.72
Total 100 103 111 120 1.00 1.00 1.00 1.00
Source: NEMESIS model
Index Share in Total
2005 2010 2015 2020 2005-10 2010-15 2015-20 2005-20 in toe Solids 100 96 96 97 0.16 0.15 0.14 0.13 Oil 100 98 106 113 0.35 0.34 0.34 0.34 Gas 100 103 113 122 0.27 0.27 0.28 0.28 Electricity 100 105 115 126 0.17 0.18 0.18 0.18 Other 100 132 152 181 0.04 0.06 0.06 0.07 Total 100 102 110 118 1.00 1.00 1.00 1.00
Source: NEMESIS model
Despite high oil prices, the demand for petroleum products is expected to stay at a high level during the period 2005-2020, with a rise of 13 % of oil demand that concentrates for specific use: Transports and petrochemical. The demand for gas rises 22 % over the period, while the demand for solids (coal and lignite) reduces 3 %. The evolution for gas is mainly attributable to the massive substitution of gas to coal and oil in power generation (see table 7). Electricity takes a share in primary energy demand, with a demand that increases 26 % over the period, an evolution supported by the development of renewable in power sector, which gain economic competitiveness over the period. Other energy sources, mainly biomass, play also an increasing role, with a demand growing about 4 % per year over 2005-2020.
Table 7: Fuels inputs in thermal power generation in EU-27, baseline scenario
Table 7 illustrates the rising importance of biomass for the power sector, which demand increases 85 % on 2005-2020. The use of solids in power sector stabilizes around its 2005 level, and benefits from the gradual diminution of nuclear contribution in base load, resulting from the assumptions mad in baseline. Assumptions for nuclear follow PRIMES9 projections, as well as projection for hydro-electricity, that grow 9 % (table 8) over 2005-2020 period, and for geothermal electricity that grow 35 %, but with a potential that stay limited.
Table 8: Main energy system indicators for EU-27, baseline scenario
Table 8 shows finally the increasing importance of wind and nuclear for electricity generation, these energy sources growing respectively 17 % and 15 % per year over the 2005-2020 period. The expansion of electric sector in baseline scenario, results then from the development of specific electricity uses and a demand rising 1.6 % per year in average, and from massive investments in combined cycle gas, biomass based power, wind and to a lesser extent solar.
9
“Energy and Transport: Trends to 2030 – Update 2007”, European Commission/ Directorate-General for Energy and Transport.
2005 2010 2015 2020 2005-10 2010-15 2015-20 2005-20
in toe
Solids 100 97 98 99 0.55 0.53 0.51 0.49
Oil 100 77 71 60 0.09 0.07 0.06 0.05
Natural Gas 100 108 121 135 0.30 0.32 0.35 0.37
Biomass and Waste 100 132 154 185 0.06 0.08 0.09 0.10
Total 100 101 106 112 1.00 1.00 1.00 1.00
Source: NEMESIS model
Index Share in Total
2005 2010 2015 2020 2005-10 2010-15 2015-20 2005-20
in toe Annual % Change
Gross inl. Consumption/Capita (100 in 2005) 100 101 106 115 0.18 1.06 1.57 0.93 Gross inl. Consumption/GDP (100 in 2005) 100 95 90 87 -1.02 -1.03 -0.82 -0.96
Electricity generation 100 105 114 127 0.94 1.76 2.19 1.63 - Nuclear 100 92 96 104 -1.55 0.74 1.61 0.26 - Hydro 100 99 102 109 -0.21 0.68 1.24 0.57 - Wind 100 273 556 1023 22.22 15.33 12.95 16.77 - Solar 100 221 428 761 17.21 14.13 12.19 14.49 - Geothermal 100 99 113 135 -0.22 2.77 3.63 2.05 - Thermal 100 106 116 129 1.18 1.84 2.08 1.70
Table 9: GHG emissions by sector in EU-27, baseline scenario European
These energy and economic trends of the baseline scenario result in a moderate increase of GHG emissions over the period 2005-2020 in EU-27 countries (see table 9).
From 2005 to 2010, GHG emissions first decrease, in a context of very high oil and gas prices. Emissions decrease 8 % in the power sector, where the decrease results from using more gas and oil and solids, and more renewable. The stabilization of emissions in other energy intensive industries in this first period of low economic growth, allow GHG emissions to reduce 5 % in the EU ETS sector. For non EU ETS sector, emissions reduce 2 % in 2010 compared to 2005, from the reductions realized inside the energy branch. In 2010, GHG emissions are 3 % lower their 2005 level in EU-27, that is to say 14.3 % their 1990 level. This is below the Kyoto objective of 8 % emissions reduction for 2010-2012 period compared to 1990.
For the period 2010-2020, the economic growth that was hampered by the very high oil and gas price of the first period recovers. Energy prices stay high and favorable to the development of renewable energy sources, but the important rise in energy demand (16 % between 2010 and 2020 against only 2 % between 2005 and 2010) does not allow stabilizing the level of CO2 and of other GHG emissions. GHG emissions re-augment 3 %
between 2010 and 2015 and again 3 % between 2015 and 2020, to establish 3 % above their 2005 level, and 7.7 % below their 1990 level. Compared to 2005 level, emissions are stabilized in EU ETS sector, where the 23 € 2005 /ton CO2 carbon value allow satisfying
EU-27 Kyoto objective. For non EU ETS
2005 2010 2015 2020 2005-10 2010-15 2015-20 2005-20 in CO2 units Power Generation 100 92 89 86 0.29 0.27 0.26 0.24 Energy Branch 100 97 103 109 0.06 0.06 0.06 0.06 Agriculture 100 100 103 106 0.13 0.13 0.13 0.13 Industry 100 101 108 115 0.14 0.14 0.15 0.15
- energy Intensive industries 100 100 107 113 0.10 0.11 0.11 0.11
- other industries 100 104 113 121 0.03 0.03 0.04 0.04
Residential 100 102 112 121 0.09 0.09 0.10 0.10
Tertiary 100 103 111 119 0.04 0.05 0.05 0.05
Transport 100 96 101 106 0.26 0.26 0.26 0.27
- see & air 100 108 126 143 0.03 0.04 0.04 0.05
- road & rail 100 94 97 100 0.22 0.22 0.22 0.22
EU-ETS sectors 100 95 97 99 0.47 0.47 0.46 0.45
Non EU-ETS sectors 100 98 103 108 0.51 0.52 0.53 0.53
Total 100 97 100 103 1.00 1.00 1.00 1.00
Source: NEMESIS model
Table 10: Green house gases emissions per EU-27 country, baseline scenario
GHG emissions show contrasted evolutions at member States level (table 10). For CO2, (only energy related emissions are measured) the global stabilization at EU-27 level
over the period 2005-2020 dissimulates a 7 % increase in new member State, while emissions are reduced about 1 % in EU-15 countries were economic growth rate is 46 % inferior to the one of new member States. For other GHG, we have a stabilization of CH4 emissions form agriculture, but an increase notably from waste production, gas production and transportation. They increase globally 9 % between 2005 and 2020. The strongest emissions increases are HFC (49 %), PFC (46 %) and SF6 (39 %). For N2O, emissions are projected to increase 18 %. Globally, non CO2 GHG emissions increase 17 % over the 2005-2020 period, with also a higher increase in new member states, with +26 % against +15 % in EU-15 countries.
Table 11: Main environmental indicators for EU-27 countries, baseline scenario
The baseline evolutions for GHG emissions over the 2005-2020 period reveal moderate increases despite the relatively high economic growth and rise in energy demand foreseen in this scenario. This is traduced in table 11 for CO2 by a decrease of 2
% of emissions in EU-27 between 2005 and 2020, of 26 % of emissions per constant k-euros GDP and of 15 % of energy carbon intensity. Emissions intensity reduction of GDP in then the result of both increased decoupling of energy consumption from GDP growth, and from high energy prices that strengthen energy substitutions away from fossil fuel
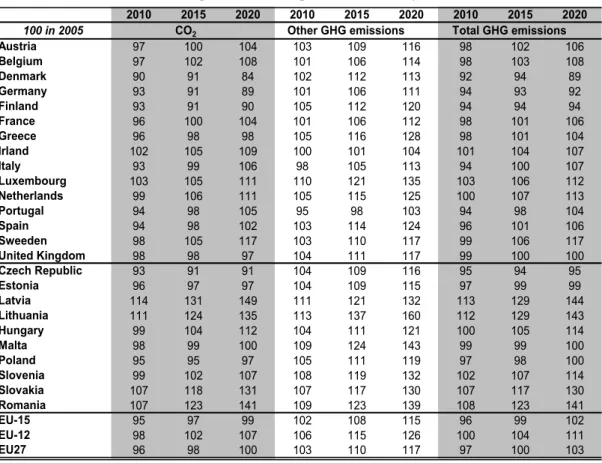
2010 2015 2020 2010 2015 2020 2010 2015 2020
100 in 2005 CO2 Other GHG emissions Total GHG emissions
Austria 97 100 104 103 109 116 98 102 106 Belgium 97 102 108 101 106 114 98 103 108 Denmark 90 91 84 102 112 113 92 94 89 Germany 93 91 89 101 106 111 94 93 92 Finland 93 91 90 105 112 120 94 94 94 France 96 100 104 101 106 112 98 101 106 Greece 96 98 98 105 116 128 98 101 104 Irland 102 105 109 100 101 104 101 104 107 Italy 93 99 106 98 105 113 94 100 107 Luxembourg 103 105 111 110 121 135 103 106 112 Netherlands 99 106 111 105 115 125 100 107 113 Portugal 94 98 105 95 98 103 94 98 104 Spain 94 98 102 103 114 124 96 101 106 Sweeden 98 105 117 103 110 117 99 106 117 United Kingdom 98 98 97 104 111 117 99 100 100 Czech Republic 93 91 91 104 109 116 95 94 95 Estonia 96 97 97 104 109 115 97 99 99 Latvia 114 131 149 111 121 132 113 129 144 Lithuania 111 124 135 113 137 160 112 129 143 Hungary 99 104 112 104 111 121 100 105 114 Malta 98 99 100 109 124 143 99 99 100 Poland 95 95 97 105 111 119 97 98 100 Slovenia 99 102 107 108 119 132 102 107 114 Slovakia 107 118 131 107 117 130 107 117 130 Romania 107 123 141 109 123 139 108 123 141 EU-15 95 97 99 102 108 115 96 99 102 EU-12 98 102 107 106 115 126 100 104 111 EU27 96 98 100 103 110 117 97 100 103
Source: NEMESIS model
2005 2010 2015 2020 2005-10 2010-15 2015-20 2005-20
in toe Annual % Change
CO2 emissions/Capita 100 95 96 98 -0.93 0.03 0.57 -0.12
CO2 emissions to GDP 100 90 81 74 -2.12 -2.03 -1.80 -1.99
Carbon intensity (CO2 on gross energy inl. consumption) 100 95 90 85 -1.12 -1.02 -0.99 -1.04 Share of renewables in power generation (%) 0.16 0.18 0.21 0.26 2.89 3.16 3.83 3.29 Share of renewables in final energy consumption (%) 0.10 0.10 0.11 0.13 0.49 2.12 2.25 1.62 Biofuels share in transport gasoline and diesel (%) 0.00 0.03 0.04 0.06 42.48 10.15 6.56 18.70
and carbon intensive energies. This last phenomena pass notably through the development of renewable energy forms, which share increases 10 % in power generation on the period, from 16 % in 2005 to 26 % in 2025, and from respectively 9.5 % to 13 % in final energy consumption, while the share of biofuels in transport gasoline and diesel increase from about 0.5 % in 2005 to nearly 6 % in 2020.
Table 12: Share of renewables in final energy consumption by country, baseline scenario
The increase of renewables in final energy consumption (table 12) is particularly the fact of big countries as Germany (from 8 % to 15 %), Italy (from 8 % to 11 %) Spain (from 9 % to 13 %) and United Kingdom (from 3 % to 6 %), where the initial share or renewable is initially low, but there is increased in every countries with the exceptions of Estonia (24 % to .19 %), Latvia (37 % to 34 %) and Slovenia (16 %), Slovakia (6 %) and Romania (17 %) where it is stable.
Country evolutions are more contrasted for renewables share in power generation sector (Table 13) with huge increases in countries as Germany, Denmark, Spain and Latvia, and stabilization or slight decreases in other countries, as Austria, France, Italy, Luxembourg, Sweden in EU-15 and Estonia, Hungary, Malta, Slovenia, Slovakia and Romania in new member States.
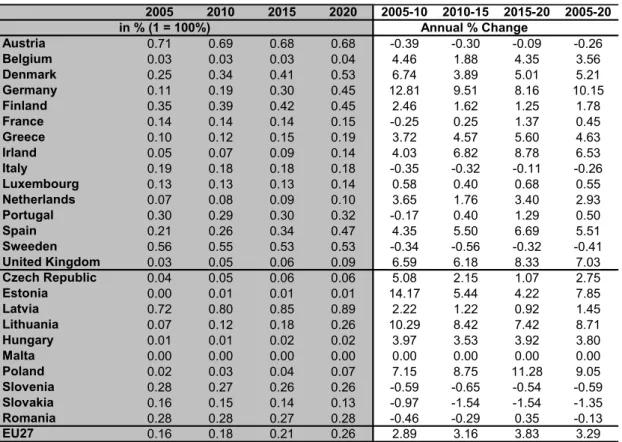
2005 2010 2015 2020 2005-10 2010-15 2015-20 2005-20 in % (1 = 100%) Annual % Change Austria 0.24 0.25 0.26 0.26 0.52 0.46 0.04 0.34 Belgium 0.05 0.06 0.07 0.07 1.44 2.47 2.19 2.03 Denmark 0.16 0.19 0.22 0.26 3.05 3.73 3.33 3.37 Germany 0.08 0.10 0.13 0.15 4.38 4.60 4.04 4.34 Finland 0.27 0.28 0.29 0.30 1.25 0.39 0.74 0.79 France 0.11 0.12 0.12 0.12 1.52 0.31 0.89 0.90 Greece 0.07 0.08 0.09 0.10 3.27 2.34 2.65 2.75 Irland 0.03 0.04 0.05 0.07 3.34 6.41 5.87 5.20 Italy 0.08 0.09 0.10 0.11 2.02 2.18 1.94 2.04 Luxembourg 0.02 0.03 0.04 0.05 6.90 8.80 5.11 6.92 Netherlands 0.04 0.04 0.05 0.06 1.54 2.85 3.82 2.73 Portugal 0.19 0.21 0.21 0.21 1.32 0.51 0.13 0.65 Spain 0.09 0.10 0.12 0.13 3.63 2.10 2.79 2.84 Sweeden 0.33 0.34 0.34 0.34 0.27 -0.03 -0.04 0.07 United Kingdom 0.03 0.04 0.05 0.06 4.64 5.51 5.88 5.34 Czech Republic 0.06 0.08 0.09 0.09 4.97 2.25 1.53 2.90 Estonia 0.20 0.20 0.19 0.19 -0.31 -1.53 0.20 -0.55 Latvia 0.37 0.36 0.35 0.34 -0.45 -0.76 -0.12 -0.44 Lithuania 0.16 0.16 0.16 0.18 -0.07 0.98 1.60 0.83 Hungary 0.06 0.06 0.07 0.07 0.78 1.22 0.24 0.74 Malta 0.00 0.01 0.01 0.04 30.34 19.51 25.65 25.09 Poland 0.09 0.09 0.11 0.12 2.02 2.77 2.60 2.46 Slovenia 0.16 0.16 0.16 0.16 0.24 0.31 -0.05 0.17 Slovakia 0.06 0.06 0.06 0.06 -0.49 0.61 1.30 0.47 Romania 0.17 0.18 0.17 0.17 0.30 -0.51 -0.79 -0.33 EU27 0.09 0.10 0.11 0.13 2.24 2.12 2.25 2.20
Table 13: Share of renewables in power generation sector in EU-27, baseline scenario
Table 14: Share of biofuels in transport gasoline and diesel
Baseline scenario evolutions for biofuels in transports gasoline and diesel share show on contrary quite homogenous evolutions across EU countries (table 14), from levels inferiors to 0.5 % in 2005 to 5 to 9 % in 2020 for most countries. This can be explained by the fact that biofuels penetration is more directly linked to oil price and other market
2005 2010 2015 2020 2005-10 2010-15 2015-20 2005-20 in % (1 = 100%) Annual % Change Austria 0.71 0.69 0.68 0.68 -0.39 -0.30 -0.09 -0.26 Belgium 0.03 0.03 0.03 0.04 4.46 1.88 4.35 3.56 Denmark 0.25 0.34 0.41 0.53 6.74 3.89 5.01 5.21 Germany 0.11 0.19 0.30 0.45 12.81 9.51 8.16 10.15 Finland 0.35 0.39 0.42 0.45 2.46 1.62 1.25 1.78 France 0.14 0.14 0.14 0.15 -0.25 0.25 1.37 0.45 Greece 0.10 0.12 0.15 0.19 3.72 4.57 5.60 4.63 Irland 0.05 0.07 0.09 0.14 4.03 6.82 8.78 6.53 Italy 0.19 0.18 0.18 0.18 -0.35 -0.32 -0.11 -0.26 Luxembourg 0.13 0.13 0.13 0.14 0.58 0.40 0.68 0.55 Netherlands 0.07 0.08 0.09 0.10 3.65 1.76 3.40 2.93 Portugal 0.30 0.29 0.30 0.32 -0.17 0.40 1.29 0.50 Spain 0.21 0.26 0.34 0.47 4.35 5.50 6.69 5.51 Sweeden 0.56 0.55 0.53 0.53 -0.34 -0.56 -0.32 -0.41 United Kingdom 0.03 0.05 0.06 0.09 6.59 6.18 8.33 7.03 Czech Republic 0.04 0.05 0.06 0.06 5.08 2.15 1.07 2.75 Estonia 0.00 0.01 0.01 0.01 14.17 5.44 4.22 7.85 Latvia 0.72 0.80 0.85 0.89 2.22 1.22 0.92 1.45 Lithuania 0.07 0.12 0.18 0.26 10.29 8.42 7.42 8.71 Hungary 0.01 0.01 0.02 0.02 3.97 3.53 3.92 3.80 Malta 0.00 0.00 0.00 0.00 0.00 0.00 0.00 0.00 Poland 0.02 0.03 0.04 0.07 7.15 8.75 11.28 9.05 Slovenia 0.28 0.27 0.26 0.26 -0.59 -0.65 -0.54 -0.59 Slovakia 0.16 0.15 0.14 0.13 -0.97 -1.54 -1.54 -1.35 Romania 0.28 0.28 0.27 0.28 -0.46 -0.29 0.35 -0.13 EU27 0.16 0.18 0.21 0.26 2.89 3.16 3.83 3.29 2005 2010 2015 2020 2005-10 2010-15 2015-20 2005-20 in % (1 = 100%) Annual % Change Austria 0.00 0.03 0.04 0.06 42.48 10.15 6.56 18.70 Belgium 0.00 0.01 0.03 0.05 752.61 19.21 9.44 123.22 Denmark 0.00 0.03 0.05 0.07 745.89 13.24 8.40 118.16 Germany 0.02 0.04 0.05 0.06 14.08 5.66 2.91 7.45 Finland 0.00 0.01 0.03 0.05 613.51 19.77 7.10 109.18 France 0.01 0.03 0.04 0.05 28.62 9.80 4.82 13.97 Greece 0.00 0.02 0.03 0.05 769.54 13.34 6.28 118.80 Irland 0.00 0.02 0.04 0.05 150.34 15.25 8.07 46.09 Italy 0.00 0.03 0.04 0.06 56.79 9.45 7.05 22.47 Luxembourg 0.00 0.02 0.05 0.07 119.06 18.69 8.05 41.10 Netherlands 0.00 0.02 0.05 0.07 880.09 19.12 9.27 133.66 Portugal 0.00 0.02 0.04 0.05 769.95 14.36 7.81 120.53 Spain 0.01 0.04 0.07 0.09 43.46 12.11 3.24 18.42 Sweeden 0.02 0.04 0.05 0.07 11.29 7.91 4.67 7.92 United Kingdom 0.00 0.02 0.04 0.06 67.71 14.56 8.25 27.64 Czech Republic 0.00 0.05 0.07 0.09 147.39 8.70 4.91 41.30 Estonia 0.00 0.04 0.06 0.07 565.85 8.57 3.81 95.79 Latvia 0.00 0.03 0.05 0.08 64.68 9.97 8.01 25.06 Lithuania 0.00 0.01 0.02 0.06 29.09 26.14 19.02 24.68 Hungary 0.00 0.04 0.06 0.08 760.80 9.25 6.23 115.37 Malta 0.00 0.00 0.01 0.02 0.00 0.00 0.00 0.00 Poland 0.00 0.03 0.06 0.09 44.29 13.84 8.98 21.42 Slovenia 0.00 0.01 0.04 0.05 382.29 19.51 9.04 84.54 Slovakia 0.01 0.03 0.06 0.09 30.18 16.25 9.97 18.50 Romania 0.00 0.01 0.02 0.03 593.54 14.73 5.15 103.01 EU27 0.00 0.03 0.04 0.06 42.48 10.15 6.56 18.70
considerations, than other renewables which penetration depend heavily on country specific potentials, and historic characteristics of energy supply and demand system.
3- Scenarios results
Figure 7 resumes the GHG emissions reduction effort to be achieves in EU-27 in order to reach the EU post-Kyoto objective of 20 % emissions reductions compared to 1990 level. One can see on this table that at European scale baseline evolutions over 2005-2020 period implies a reduction of 13.7 % of GHG emissions to reach EU post-Kyoto objectives (from index 92.7 to 80), whereas situation of European countries toward post-Kyoto objective are very contrasted.
In EU-15 countries, emissions level in 2020 should be identical to 1990 level from NEMESIS baseline projections, with very high increases of emissions levels in southern countries as Spain (62 % increase compared to 1990) and Portugal (47 % increase). On the other hand, countries as Germany, that is 25 % below 1990 level in 2020, and also Denmark and united Kingdom, respectively 18 and 16 % their 1990 level show very virtuous evolutions.
For new member States, the decline of heavy, energy intensive industries in the 90s, allowed to lower considerably the level of GHG emissions that was in 2005 35.4 % below their 1990 level, that is to say quite far below EU Kyoto and post-Kyoto objective. With the economic recover in recent years, that is expected to continue in the baseline scenario with average GDP growth rates close from 4 % in average over 2005-2020 period, GHG emissions in new Member States should re-increase 11.5 % up to 2020, from NEMESIS baseline evolutions, but stay 28 below their 1990 level. The only exceptions are Malta and Slovenia where GHG emissions are in 2020 respectively 55 and 15 % above their 1990 level.
Figure 7: GHG emissions in EU-27 countries compared to 1990
It is this ‘Hot Air’ reserve in new Member States, and also the solidarity principle consisted to do not penalize EU countries with GDP per capita below EU average that conducted EU authorities adopting the burden sharing agreement for sectors not covered by EU ETS (Figure 8) where emissions reduction, that represent about 60 % to EU GHG emissions, are costly to achieve.
Actual (EEA) Baseline
2005 2020 Austria 118.1 125 Belgium 97.9 106 Denmark 92.2 82 Germany 81.3 75 Finland 97.5 92 France 98.1 104 Greece 125.3 130 Ireland 125.3 134 Italy 112.1 120 Luxembourg 100.0 112 Netherlands 98.8 112 Portugal 140.4 147 Spain 152.2 162 Sweeden 92.7 109 United Kingdom 84.3 84 Czech Republic 74.2 70 Estonia 48.1 48 Latvia 42.1 61 Lithuania 47.0 67 Hungary 65.4 74 Malta 154.5 155 Poland 68.0 68 Slovenia 100.5 115 Slovakia 66.3 87 Romania 54.4 77 EU-15 98.0 100 EU-12 64.6 72 EU-27 89.7 92.7 100 in 1990
Figure 8: Reduction targets per country for non EU-ETS sectors for 2020 compared to 2005
As one can see on figure 8, this burden sharing agreement will allow new Member States increase their GHG emissions in non EU ETS sectors from 3 (Malta) to 20 % (Bulgaria), while in EU-15 countries emissions should be reduced about 15 to 20 % in northern countries, objectives being less important for southern countries.
For CO2 emissions only, that represent more than 80 % of overall GHG emissions,
evolutions displayed in Figure 9 are of course similar: For 2020, EU-27 countries should globally situate 1.7 % below their 1990 level, EU-15 countries increasing 3 % their emissions above this 1990 level, and new Member States reducing 20 % their emissions compared to it. 5% 3% 13% 19% 14% 15% 17% 10% 11% 9% 20% -16% -17% -10% 1% -16% -20% -13% -20% -4% -14% -16% -20% -15% -16% -14% -30% -20% -10% 0% 10% 20% 30% Malta Slovenia Slovakia Romania Poland Lithuania Latvia Hungary Estonia Czech Republic Bulgaria United Knigdom Sweeden Spain Portugal Netherlands Luxembourg Italy Ireland Greece Germany France Finland Denmark Belgium Austria
Figure 9: CO2 emissions in EU-27 countries compared to 1990 level
3.1- Results of scenario S1: ‘no recycling of auctioning revenue’
In this first scenario, there is no recycling of auctioning revenue. This scenario allows consequently, when compared to results for scenarios S2 and S3, to assess for the efficiency of recycling schemes used in these last scenarios. It shows also the direct economic costs of increasing carbon price in EU ETS sectors and of imposing stronger limitations on GHG emissions in non EU ETS ones.
The simulation results show a decrease of EU-27 GDP of 0.65 % in 2020 (see table below) reflecting the fall in private demand that follows the rise of carbon value in EU ETS sectors that reaches 2005 euros against 24 euros in the baseline scenario. The permits price is increasing during the phase 2013 to 2020 attaining 61.17€/ton CO2-equivalent in 2020. This permits price is associated to the emission commitment introduced in the Climate Action and Renewable Energy Package. This rise in carbon value represents auctioning revenue of about 102.21 billion euros for European states, taken on EU ETS firms that are constrained to increase their production price. This increases final consumptions prices by 1.15 %, and households reduce 0.6 % their final consumption, with an equivalent reduction of their real disposable income.
Table 15: Macroeconomic results for Europe EU-27 in 2020 (S1)
Actual (EEA) Baseline
2005 2020 Austria 130.2 135 Belgium 102.5 110 Denmark 94.0 79 Germany 84.3 75 Finland 99.5 90 France 107.5 112 Greece 135.9 133 Ireland 149.0 163 Italy 114.7 121 Luxembourg 107.8 120 Netherlands 111.5 124 Portugal 156.9 164 Spain 164.5 168 Sweeden 92.6 108 United Kingdom 94.9 92 Czech Republic 78.1 71 Estonia 45.0 44 Latvia 40.5 60 Lithuania 38.6 52 Hungary 85.2 95 Malta 144.2 144 Poland 86.2 83 Slovenia 114.7 122 Slovakia 63.1 82 Romania 60.3 85 EU-15 104.3 103 EU-12 74.9 80 EU-27 97.9 98.3 100 in 1990 GDP -0.65 Final consumption -0.60 Firms' investment -2.18 Energy consumption -7.68 Extra-EU Exports -0.86 Extra-EU Imports -1.09 Private R&D 1.33 Employment -0.17
Agriculture -1,41 Food, Drink & Tobacco -0,35 Coal and Coke 0,00 Tex., Cloth & Footw. -0,66 Oil and Gas Extraction -2,76 Paper & Printing Prod. -0,55 Gas Distribution -9,53 Rubber and Plastic -1,15 Refined Oil -19,33 Other manufactures -0,89
Electricity 1,48 Construction -1,61
Water supply -0,19 Distribution -0,86
Ferr & Non Ferrous Metals -2,10 Lodging and Catering -0,48 Non Metallic Min. Prod. -1,51 Inland Transports -0,57 Chemicals -0,86 Sea and Air Transport -1,90
Metal Products -1,34 Other Transport -0,76
Agri & Industr. Mach. -1,71 Communication -0,46 Office Machines -1,51 Bank, Finance and Insurance -0,56 Electrical Goods -1,04 Other Market Services -0,74 Transport Equipment -1,15 Non market Services -0,06
deviation w.r.t. baseline (in percentage points)
Source: NEMESIS model
Energy consumption falls 7.68 %, as a consequence of high EU ETS carbon value, but also of carbon taxation in non EU ETS sectors. Firms’ investment reduces
–
2.18 %, that is more than the fall in production and reflects the complementarity existing between energy consumption and investment in capital goods in NEMESIS. Conversely the evolution of employment, which falls only 0.17 %, reflects favorable substitutions from energy and capital-intensive production techniques, to more labor intensive ones.Table 16: Impact on the sectoral industrial production in 2020
This higher balance price for carbon in EU ETS and the introduction of carbon penalties in non EU ETS impact also negatively on EU-27 foreign competitiveness, with a 0.86 % fall of exports in 2020. The reduction of EU-27 imports, by
–
1.09 % in 2020, due to the lower internal consumption and the fall of energy imports, allows nevertheless EU external balance to evolve favorably. There is an also positive impact onto private R&D expenditures that rise 1.33 %, with a much more important impact in EU ETS, energy intensive sectors, and especially power sector, where productivity improvements offset partially the cost of carbon penalty.EU ETS, energy intensive sectors encounter nevertheless a sharp fall of production in EU-27 for 2020, with–19.33 % for refined oil, 9.53 % for gas distribution sector and about 1 to 2 % for most of other energy intensive industries. Conversely, the development of renewable energies production in power sector, and favorable substitutions between energy products, induces a 1.48 % increase in electricity production. Fall of production in non EU ETS sectors are less important, and closely related to GDP evolution.
At country level, table 17 show contrasted impacts for GDP, that range in 2020 from +0.20 % in Luxembourg, to –0.41 % in France, –0.61 % in Sweden and Belgium, –1.23 % in Portugal, and –1.46 % in Spain.
Table 17: Macroeconomic impacts for the EU15 countries in 2020
There are remarkable facts:
• fall in GDP are mainly driven by private consumption especially, for example in Austria (-0.98 %), in Portugal (–1.21 %) and in Spain (–1.71 %), where the consumer price index rise importantly;
• Greece and the Netherlands encounter the worse performances for investment with respectively –1.50 % and –1.63 % in 2020.
• pressure on employment differs across European countries. The EU-15 Member countries are less impacted by the drop of employment with –0.59 % in Spain, –0.46 % in Italy, –0.29 % in Hungary and –0.09 % in Germany. There is even increases of employment in several EU-15 countries as France (+0.30), Belgium (+0.47 %), Netherlands (+0.89 %) or Ireland (+1.30 %), as a consequence of the positive substitution effects already quoted above It contrasts with evolutions in new member States where employment decreases everywhere except Lithuania;
•
fall in GDP tends to be similar for States with a GDP per capita below EU average than for EU-15 countries, with –0.09 % in Estonia, –0.20 % in Hungary, and –0.96 % in Poland and Slovenia. But, it is two of these countries, Slovakia and Romania that experience the highest negative impact on GDP with respectively –2.27 % and –2.20 % in 2020, due to importance of coal in their energy system. These countries encounter also the biggest fall in employment, with respectively–3 % and –1.85 %, and also –0.82 % in Poland.GDP Final
consumption
Firms' investment
Energy
consumption Private R&D Employment
Austria -0.58 -0.94 -2.33 -5.89 1.24 -0.04 Belgium -0.61 -0.25 -3.38 -9.27 1.49 0.47 Denmark -0.02 0.30 -1.95 -6.02 0.36 0.22 Germany -0.30 -0.42 -1.10 -6.21 1.02 -0.09 Finland -0.39 -0.23 -0.67 -7.32 0.89 0.07 France -0.41 -0.26 -2.01 -10.97 1.22 0.30 Greece -1.07 -1.15 -1.74 -5.64 2.15 -0.80 Ireland -0.34 1.20 -4.40 -6.07 0.79 1.10 Italy -1.14 -1.26 -3.25 -8.08 1.87 -0.46 Luxembourg 0.20 0.38 -1.03 -5.15 -0.99 1.20 Netherlands -0.98 0.18 -4.57 -11.98 1.43 0.89 Portugal -1.23 -1.21 -1.60 -3.52 1.91 -0.61 Spain -1.46 -1.71 -2.93 -8.40 2.45 -0.59 Sweeden -0.61 -0.59 -0.49 -5.72 1.37 -0.19 United Kingdom -0.65 -0.24 -2.16 -7.03 1.91 0.27 EU27 -0.65 -0.60 -2.18 -7.68 1.33 -0.17
deviation w.r.t. baseline (in percentage points)