HAL Id: hal-01192697
https://hal.archives-ouvertes.fr/hal-01192697
Submitted on 3 Sep 2015HAL is a multi-disciplinary open access archive for the deposit and dissemination of sci-entific research documents, whether they are pub-lished or not. The documents may come from teaching and research institutions in France or abroad, or from public or private research centers.
L’archive ouverte pluridisciplinaire HAL, est destinée au dépôt et à la diffusion de documents scientifiques de niveau recherche, publiés ou non, émanant des établissements d’enseignement et de recherche français ou étrangers, des laboratoires publics ou privés.
Experimental and numerical investigations of shock and
shear wave propagation induced by femtosecond laser
irradiation in epoxy resins
Romain Ecault, Laurent Berthe, Fabienne Touchard, Michel Boustié, Emilien
Lescoute, Arnaud Sollier, Hubert Voillaume
To cite this version:
Romain Ecault, Laurent Berthe, Fabienne Touchard, Michel Boustié, Emilien Lescoute, et al.. Exper-imental and numerical investigations of shock and shear wave propagation induced by femtosecond laser irradiation in epoxy resins. Journal of Physics D: Applied Physics, IOP Publishing, 2015, 48, pp.(9). �10.1088/0022-3727/48/9/095501�. �hal-01192697�
Science Arts & Métiers (SAM)
is an open access repository that collects the work of Arts et Métiers ParisTech researchers and makes it freely available over the web where possible.
This is an author-deposited version published in: http://sam.ensam.eu Handle ID: .http://hdl.handle.net/10985/9902
To cite this version :
Romain ECAULT, Laurent BERTHE, Fabienne TOUCHARD, Michel BOUSTIE, Emilien
LESCOUTE, Arnaud SOLLIER, Hubert VOILLAUME - Experimental and numerical investigations of shock and shear wave propagation induced by femtosecond laser irradiation in epoxy resins -Journal of Physics D: Applied Physics - Vol. 48, p.(9) - 2015
Any correspondence concerning this service should be sent to the repository Administrator : archiveouverte@ensam.eu
1. Introduction
Epoxy resins are increasingly used for manufacturing. They can be found as matrix material for a wide variety of modern fiber-reinforced materials, or by themselves for lightweight and non-critical structures with complex shape [1]. Indeed, there are important needs for such lightweight and high-strength materials for various industries including automo-tive or aerospace sectors, and also for military applications (armor materials). Because of their use, intense shocks can occur on these materials during their lifetimes, leading to heavy damage. For automotive applications, these phenomena should be studied to enhance the structural crashworthiness. This is also the case for aeronautics, since aircraft structures should withstand impacts such as bird strike or blade ejec-tion. Therefore, understanding the dynamic response of such
material is important for correct structure design. On the other hand, this understanding can also be used for industrial processes which include shocks or related phenomena, such as laser cutting [2], laser ultrasound [3], or laser shock adhesion tests [4–7]. Indeed, these techniques generate, intentionally or not, different stress waves in the material. Mastering such waves is important for the technique’s efficiency and reliability. In particular, the laser shock adhesion test is currently being investigated. It is being developed for the control of weak adhesive bonds, which is quite important for the aeronautic industry nowadays [8]. For this technique, laser-induced shock waves are produced to generate tensile loading in composite assemblies, especially located at the composite–bond interface. In this case, mastering the wave propagation enables us to develop a proof test revealing the presence of weak interfaces. Therefore, shock propagation in
Experimental and numerical investigations
of shock and shear wave propagation
induced by femtosecond laser irradiation in
epoxy resins
Romain Ecault1, Laurent Berthe2, Fabienne Touchard1, Michel Boustie1,
Emilien Lescoute3, Arnaud Sollier3, Hubert Voillaume4
1 Département Physique et Mécanique des Matériaux—ENSMA, Institut Pprime, CNRS-ENSMA-Université de Poitiers 1, Av. Clément Ader, B.P 40109, 86961 Futuroscope Cedex, France
2 PIMM, CNRS-ENSAM Paristech, 151 Bd de l’Hôpital, 75013 PARIS Cedex, France 3 CEA, DAM, DIF, 91297 Arpajon Cedex, France
4 Airbus Group Innovations, 92150 Suresnes, France E-mail: romain.ecault@ensma.fr
Abstract
In this work, original shock experiments are presented. Laser-induced shock and shear wave propagations have been observed in an epoxy resin, in the case of femtosecond laser irradiation. A specific time-resolved shadowgraphy setup has been developed using the photoelasticimetry principle to enhance the shear wave observation. Shear waves have been observed in epoxy resin after laser irradiation. Their propagation has been quantified in comparison with the main shock propagation. A discussion, hinging on numerical results, is finally given to improve understanding of the phenomenon.
Keywords: femtosecond laser shock, epoxy resins, shear wave propagation, shadowgraphy, photoelasticimetry
(Some figures may appear in colour only in the online journal)
R Ecault et al Printed in the UK 095501 JPD © 2015 IOP Publishing Ltd 2015 48
J. Phys. D: Appl. Phys.
JPD
0022-3727
10.1088/0022-3727/48/9/095501
Papers
9
Journal of Physics D: Applied Physics IOP
such complex materials is interesting to study for this applica-tion. As shock wave propagation characteristics of composite material are close to those of the matrix, studying the epoxy resin response to shocks is interesting. It is necessary to study the entire wave propagation pattern in order to develop a better use of this technique.
In the past, the dynamic response of epoxy resins was investigated by several research teams. Works mainly focus on determining Hugoniot curves for various resins [9–13]. The evolution of strength with the impact intensity level was also studied, using both longitudinal and lateral pressure gauges [11–14]. Their mechanical response to high strain rate was investigated in compression, tension and shear loadings [15–
18]. The strain rate influence on yield stress, initial modulus and strain to failure was demonstrated [19–21]. These effects are attributed to the viscoplastic behavior of epoxy resins. The epoxy dynamic response seems also to be linked to its initial state before loading (relaxed or constrained) [22]. Except in the work of Laporte [23, 24], investigations of epoxy under laser shocks are rare. Aside from these dynamic characteriza-tion studies, other original works can be quoted. A research team has recently developed strain diagnostics using mecha-nochemical sensors. They are adapted to reveal shock-induced damage inside an epoxy target. These specific sensors in fact take on a particular color depending on the pressure level. They were tested using a Hopkinson bar in compression. Thanks to this device, residual stresses along the dynamic crack have been evidenced [25]. The temperature increase associated with the shock wave propagation has also been partially studied. Epoxy resins can have different mechanical behaviors depending on the temperature. The glass transition temperature is an indicator of the thermoset curing rate, and consequently of the material mechanical properties. The most reliable data which can be obtained through the literature come from thermodynamical modeling [26–28]. There are not many experimental options. In some works, the bright-ness temperature of shock-compressed epoxy resin was investigated [29]. Thanks to ballistic plate impacts (7 km s−1
on average), a range of pressure from 18 to 40 GPa was suc-cessfully studied. The corresponding maximum temperatures observed behind the maintained shock front are respectively in the range 940–2100 K. Moreover, no evidence of a chem-ical reaction affecting the target was found below 22 GPa. The authors conclude that, in this case, no chemical modifications occurred during the shocked state in spite of the high tempera-ture state (for the recorded period).
In this context, a work has been started to understand laser-induced shock wave propagation in epoxy targets by direct observation [30]. Complementary investigations are presented in this paper. Observing physical phenomena to understand them is not a recent idea. In the 1970s, shadowgraphy and photoelasticity were used to study ultrasonic wave propaga-tion in liquids and transparent solids [31–33]. Results were particularly interesting for the development of non-destructive testing applications. In the 1980s, the observation quality was improved thanks to camera technology improvement [34], and more recently progress has been made toward quantifi-cation of stresses resulting from ultrasonic wave propagation
[35]. Shadowgraphy or stroboscopy are commonly used in fluid mechanics science [36].5 They are also used in the
shock physics and laser shock field for several kinds of inves-tigation. In particular, laser–matter interaction and related phenomena can be observed [37–40]. This can be ablation, or induced shock waves. Shadowgraphy can also be used to study the spallation phenomenon resulting from femtosecond laser irradiation [41]. It can then be used for solid printing applications. More classically, shadowgraphy is also used to complete information on Hugoniot curves [42].
In this paper, shock and shear wave observation is aimed for. The experimental setup is first described. Femtosecond-scale laser experimental results are then presented. In this work, polarizers have been added to a shadowgraphy setup to reveal shear wave propagation inside the epoxy targets, in addition to the shock wave. Shear wave velocity is quantified and compared to that of the shock wave. Finally, a discussion is given to obtain a better understanding of the shear wave propagation pattern. It is based on femtosecond laser mod-eling by finite elements.
2. Material and experimental laser shock method
2.1. Epoxy material
For the presented investigations, a classic epoxy material was used (see its main characteristics in table 1) [43, 44]. It has been chosen for several reasons. Its mechanical properties are close to those of the resin used in aeronautics. It has a high enough glass transition temperature to be representative of the epoxy resins used in CFRP (carbon fiber reinforced polymer). Each tested sample was square, and measured about 10 mm per side and 5 mm thick. Targets were cut from a larger coupon using a diamond wire saw to avoid cutting-induced residual stresses. For each sample, two opposite sides were hand-polished to obtain an excellent transparency, which enabled shock wave observation by shadowgraphy. Since the used epoxy is about 70% transparent to the infrared wavelengths, samples were covered using an aluminum painting on their front faces. This forces the laser–matter interaction to be produced on the sample surface, and thus enables shock propagation inside the epoxy target. In the following sections, the painted face is named ‘the front face’ (interaction with laser), the other face is called ‘the back face’. The two polished edges enabling the wave observation are named ‘the edges’ (see figure 1(c)).
After the sample preparation, the epoxy targets were con-trolled using an ordinary photoelasticimetry setup [30]. No particular residual stress schemes were noticed. Only large and dark fringes were observed on the monochromatic images,
Table 1. Epoxy sample properties as presented by Bertin [43, 44].
Ρ
(g cm−3) E(GPa) Poisson ratio ν (MPa)σr ε(%)r Thickness (mm) T(°C)g
1.14 3.09 0.35 29.7 0.02 5 120
5 Some applications of experimental and numerical visualization in fluid flow, heat transfer, and combustion. See [36].
which correspond to the description of the zero order (meaning no stresses). This indicates that the two surfaces and the four edges are probably loaded with tiny stresses due to the curing process and cutting procedure respectively. Considering the stress level induced by laser shock, it is assumed that there is no residual stress due to sample preparation.
2.2. Laser shock principle
The principle of laser-induced shock generation is described in figure 1. The laser is focused on the epoxy surface. Aluminum coating is ablated and turns into high pressure plasma, which expands rapidly in the vacuum chamber. A shock wave is thus created by reaction, and then propagates inside the epoxy (see figure 1(a)). The propagation of shock waves inside the material can first be described using a schematic space–time diagram (see figure 1(b)) [45, 46]. Shock propagates through the epoxy according to the material properties and geometry. When it reaches the sample back face, this incident shock wave is reflected into a release wave due to the presence of a free surface. It propagates backward and crosses the release part of the incident wave (back to the initial state). After crossing of the two release waves, local high tensile stresses could be generated, depending on shock parameters. It could lead, if the local damage threshold is exceeded, to the well known spallation phenomenon [47].
This approach relies on a 1D description. In the case of 3D propagations, such as the ones presented in this paper, the phenomena are much more complicated. Indeed, the laser spatial profile should be taken into account, for example. The laser used in this study is multi-modal. According to the laser experimental setup, and this characteristic, the laser spatial profile should be top-hat. The beam quality is controlled at several steps in the beam path to ensure a correct distribution. Nevertheless, there is no way to perform a beam analysis close to the target at each shot, all the energy being sent to the target. Moreover, to reach a 1 or 2 mm focal spot, we have to work out of the focus spot. Because of this, spot edges could be not as sharp as expected. A top-hat distribution is thus assumed,
knowing that there are some uncertainties on this parameter. The resulting pressure profile from the laser–matter interaction directly corresponds to the laser profile, since the interaction should be the same everywhere on the focal spot. Nevertheless, uncertainties on the laser spatial profile also directly propa-gate on the pressure spatial profile. In this work, the spatial distribution has been checked and regularly controlled, but it remains a source of uncertainty. Moreover, spot-edge effects or hydrodynamic weakening in the case of an ultra-short laser pulse should be taken into account. Observing such phe-nomena is thus necessary for their understanding. Precisely, these waves produce local changes in physical properties. These modifications lead to a variation of the matter optical properties [48, 49]. In particular, when density increases, the light is deflected. Therefore, the phenomenon can be recorded thanks to an adapted optical system, which is placed perpen-dicular to the loading axis. The compression due to the shock is thus translated into a contrast difference between the loaded and the unloaded zones. Consequently, shock wave propaga-tion observapropaga-tion is possible [50].
2.3. Laser shock experimental setup
Experiments were performed in the LULI (Laboratoire pour l’Utilisation des Lasers Intenses, École Polytechnique, Palaiseau, France), where several high power laser sources are available. These facilities are run by several teams in charge of the different parts of the laser sources (optics, electronics, mechanics, fluids, …). For this kind of facility, the operating rate is one shot every hour (for LULI2000) or 20 min (for ELFIE). Therefore, each shock is monitored with as many diagnostics as possible, even if it is quite complex. These sources are more and more equipped with self-automatic settings and controls, leading to a complex command room. LULI2000 and ELFIE sources have different characteristics.
• LULI2000. Two independent beams up to 1 kJ each are available. The wavelength is equal to 1053 nm, and the pulse duration is tunable between 0.6 and 5 ns. The
Figure 1. (a) Sketch of the laser-matter interaction used to study the laser induced shock wave propagation into an epoxy target. (b) Time-position diagram representing the 1D propagation of laser induced shock waves. (c) 3D schematic representation of the axes chosen for the problem description.
temporal profile is top-hat. Laser beams can be dispatched in two experimental rooms supplied with an experimental vacuum chamber.
• ELFIE. Three different beams can be provided in the short pulse range (femtosecond). The one used for this work can reach 10 J, and is about 300 fs wide. The wave-length is 1057 nm. Vacuum is also required because of the intensities at stake. This is why the beam is delivered in a vacuum chamber, including the last compression stage of the facility.
Experimental investigations presented in this paper follow preliminary studies conducted on the LULI2000 nanosecond laser source [30]. In order to push the laser shock investiga-tions for epoxy materials further, these new experiments were conducted using the ELFIE laser source, equipped with a shadowgraphy device. Indeed, for thick samples and because of hydrodynamic weakening, no spallation will occur [51]. This leaves more room for the shock wave propagation anal-ysis. Moreover, performing shocks with this laser source also enables the study of different phenomena by reducing the spa-tial distribution of each of them [52].
The shadowgraphy setup is placed orthogonal to the loading axis. A flash lamp is placed on one side of the target and faces the camera setup mounted on the opposite side [30]. In the case of laser shock experiments, phenomena are so fast that high speed cameras can only take one resolute picture each. To have several images of the same shock propagation, in terms of parameters, several cameras have to be used. For this,
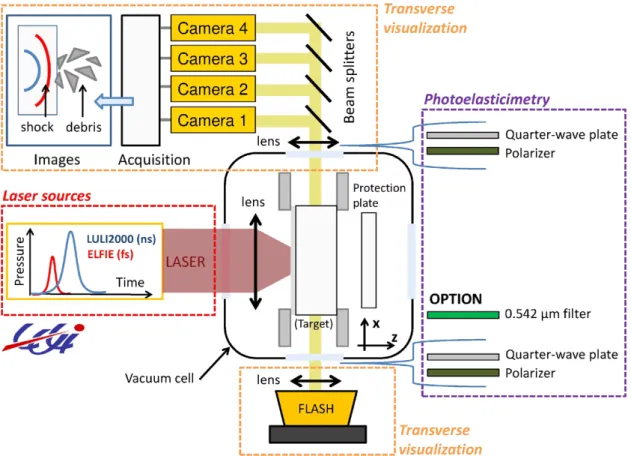
the beam containing the images is divided using beam split-ters (see figure 2). The experimental configuration is based on a high power flash lamp (Balcar Starflash 3), which provides white light (400–700 nm) during the laser experiment, and several synchronized DICAM pro cameras, the focus being made in the middle-plane of each sample, and using an expo-sure time of 3 ns [30]. In this paper, this configuration has been enhanced. Indeed, epoxy is a birefringent material. Therefore, the use of a time-resolved photoelasticimetry technique can provide information on the stress evolution during the shock wave propagation. This allows the analysis of the wave propa-gation phenomenon in these materials. For this, two circular polarizers are positioned on each side of the vacuum experi-mental chamber (see figure 2). Each polarizer is made of a linear polarizer coupled with a quarter-wave plate. They have been chosen to only visualize isochromatic fringes, which are a direct image of the stress gradient [53–56]. They were suc-cessively oriented to perform observations in both dark field (parallel polarizer) and bright field (orthogonal polarizer) with polychromatic and monochromatic light (using a filter: 0.542 ± 0.003 μm). The sample is lit on one side by the flash, and observed on the opposite side by the camera. Note that a 3D phenomenon is recorded in 2D images. The shadowgraphy setup integrates the whole 3D phenomenon along the sample width, but there is only one focus plan (with a small focal depth). 3D contributions such as shock front curvature in the shadowgraphy axis cannot be observed because they are out of focus. Thus, observed geometries could be compared with 2D geometries.
Figure 2. Experimental setup used for transverse observations. Four DICAM PRO cameras are synchronized to record four different time states of the target under a laser shock.
3. Femtosecond laser shock experimental results
3.1. Laser shock parameters
Several laser shocks were performed to obtain a complete history of the shock propagation and reverberation within the sample for a given set of parameters. Therefore, three samples were shocked with the same laser parameters for each experi-mental configuration in order to obtain 12 images of the shock propagation. The laser shock parameters are given in table 2, in which a different color refers to each sample. This color code and the sample names are then used in the phenomenon descriptions in figures 3–5. Reproducibility is fully assumed, based on previous experiments, and has been checked by cal-culating the shock velocity in each case [30].
3.2. Benefits of photoelasticimetry
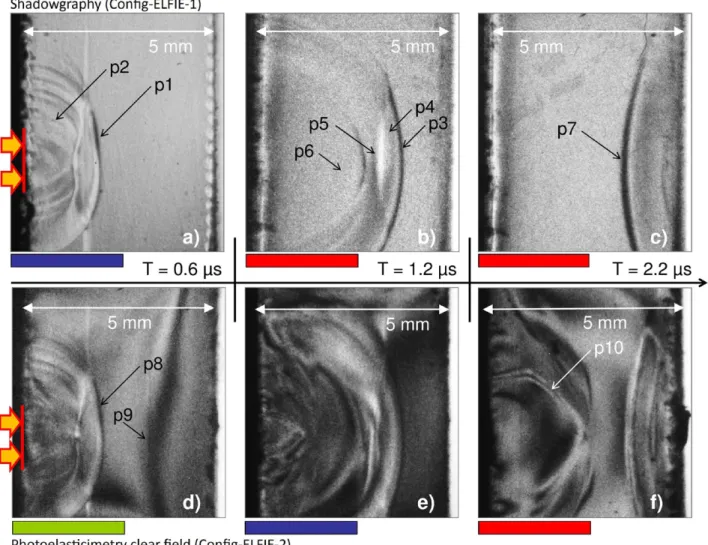
In figure 3, the same shock phenomenon is presented using two different configurations. The spot diameter here is 2 mm. In the first line, images were taken using shadowgraphy. The laser spot was small in this case, which leads to fast 3D effect formation. Indeed, in figure 3(a), a release wave network (pat-tern p2) can be observed behind the shock front (pat(pat-tern p1). These waves can be attributed to diffraction at spot edges. 0.6 µs later, the shock front (p3) propagates through the epoxy target and has reached 4 mm depth (see figure 3(b)). It is fol-lowed by a release wave, visible as a grey curved line behind the shock front (pattern p4), and a tension region due to the 3D effects (pattern p5), as observed in previous nanosecond laser experiments [30]. Nevertheless, the shock wave shape is slightly different in this case. Moreover, the deepest dark line, corresponding to the shock front, is much thinner than in the case of a nanosecond pulse. This is due to the pulse duration, which is shorter for the ELFIE laser source (0.35 ps).
It leads to a thinner instantaneous loaded zone. The 3D effect tension region is also different. Here, it is composed of a light blur with a small ‘fishtail’. When release beams have crossed each other, the material seems to be relaxed, as can be seen in figure 3(b), behind the spot-edge effect zone (see p6). The shorter the release beam, the smaller the 3D effect zone [57]. In figure 3(b), it can be observed that the laser-induced loaded region is approximately 1 mm wide. Finally, the last presented snapshot is taken after shock reverberation on the epoxy free surface. The black line corresponds to tension loading prop-agating backward into the epoxy material (pattern p7). The shock propagation described by these three images is thus similar to that observed in the previous LULI2000 experi-ments [30]. Differences can be attributed to the laser pulse shortness. Moreover, the axisymmetry can be commented on. Looking only at the main patterns (i.e. sharpest and strongest line), the axisymmetry is correct. Unbalanced differences are mainly due to the absence of homogeneity in the laser spatial distribution. Locally, some regions are less or more loaded than their neighbors, leading to some disturbances in the prop-agated waves (see all snapshots in figure 3).
The shock propagation resulting from the same shock parameters has then been observed using circular polarizers (Config-ELFIE-2). Observation has been made in bright field first to have more light on the cameras and better images. Three images are first presented in the second line of figure 3. The presented snapshots were taken at exactly the same time as the ones just described to enable comparisons. Moreover, the laser intensities were very similar for the first observa-tion by shadowgraphy and this second one by photoelastici-metry (see table 2 for shock parameters). Logically, the first two images (t = 0.6 µs) of each configuration are very close to each other (see p1 in comparison with p8). The shock front has reached the same depth in both cases and the release waves can also be compared. Regarding the shock front depth,
Ref. LULI Ref. target Energy (J) Pulse (ps) Dfoc (mm)
Intensity
(PW cm−2) Synchronization (ns) Figure no Color code
Shadowgraphy (Config-ELFIE-1)
No 12 Sep1.7 6.33 0.35 2 0.576 200–400–600–800 3–6
No 13 Sep1.9 5.83 0.35 2 0.530 1000–1200–1800–2200 3–6
Photoelasticimetry bright field (Config-ELFIE-2)
No 14 Sep1.13 6.37 0.35 2 0.579 200–400–500–600 3, 4
No 15 Sep1.12 6.35 0.35 2 0.577 800–1000–1200–1500 3, 4
No 16 Sep1.10 5.97 0.35 2 0.543 1800–2000–2200–2500 3, 4
Photoelasticimetry dark field (Config-ELFIE-4)
No 42 Sep2.1 6.54 0.35 1 2.38 100–600–800–1000 4
No 43 Sep2.5 6.39 0.35 1 2.32 200–1200–1500–1800 4
No 44 Sep2.6 5.75 0.35 1 2.09 400–2000–2200–2500
Photoelasticimetry bright field monochromatic (Config-ELFIE-3)
No 45 Sep1.6 7.03 0.35 1 2.56 400–600–800–1000 4
No 46 Sep1.11 6.46 0.35 1 2.35 100–1200–1500–1800 4
it can be concluded that the two produced shocks are identical, since they propagate with the same velocity and the same shape. Nevertheless, using polarizers enables the observation of waves which have not been seen on the first observation. Because of the use of the circular polarizer, this wave pat-tern can be correlated to stresses. It can first be observed in the snapshot presented in figure 3(d), where a black fringe is visible on the right of the shock front position (see pattern p9). This corresponds to the zero order fringe. This fringe tra-duces the fact that the right part of the epoxy target is not yet loaded, since the shock front has not reached this region yet. The following snapshot shows interesting patterns. Indeed, when nothing was observed using the shadowgraphy configu-ration, the polarizers reveal a complex stress pattern behind the 3D effect tension zone. The distribution is not obvious, but it is axisymmetrical, and centered on the laser loading axis. This stress propagation is clearly induced by the laser shock loading, but is different from the main shock propagation as described in a 1D approach. From the front face, a diamond shape starts to grow. It is centered on the laser loading axis.
In the last snapshot, presented in figure 3(f), the stresses have spread in the material thickness to reach the middle of the sample. The distribution still has a diamond shape (pattern p10). No direct fringe interpretation in terms of stresses can be made here, since the light used was not monochromatic. This observation clearly evidences stress propagation behind the main shock patterns. It corresponds to shear stresses, as is about to be demonstrated.
3.3. Quantification of wave velocities
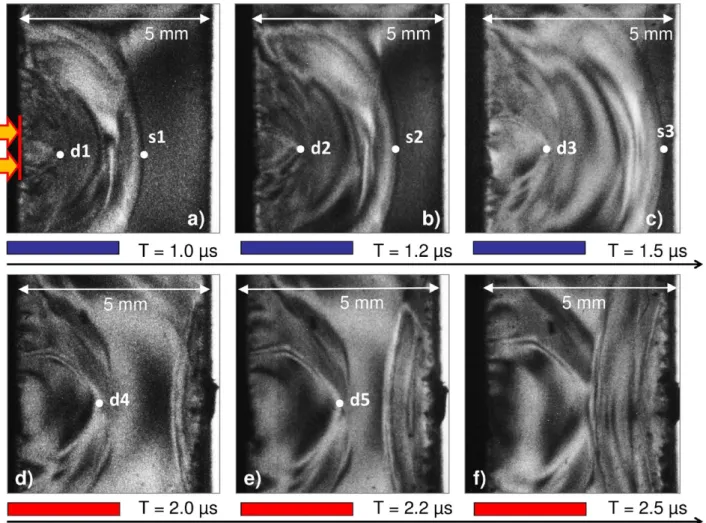
Velocities of the shock wave and the stress waves have been evaluated. For this, the whole sequence recorded using Config-ELFIE-2 has been analyzed. In figure 4, the six snapshots of the sequence are presented. Both shock and stress wave propa-gations can be observed from t = 1.0–2.5 µs after laser irradia-tion. In these images, it appears that the shock front propagates much faster than the stress waves. The stress waves reach the middle of the target while the shock has traveled through the whole epoxy thickness and has already been reflected at
Figure 3. Comparison between time resolved observations by shadowgraphy and by photoelasticimetry bright field of a shock propagation into an epoxy target: (a) at t = 0.6 µs, setting up of the shock wave by shadowgraphy (from sample Sep1.7); (b) at t = 1.2 µs, shock wave propagation with 2D edge effect by shadowgraphy (from Sep1.9); (c) at t = 2.2 µs, after shock reflection and release crossing by shadowgraphy (from Sep1.9); (d) at t = 0.6 µs, setting up of the shock wave by photoelasticimetry (from Sep1.13); (e) at t = 1.2 µs, shock wave propagation with 2D edge effect by photoelasticimetry (from Sep1.12); (f) at t = 2.2 µs, after shock reflection and release crossing by photoelasticimetry (from Sep1.10).
the free surface (figure 4(d)–( f )). These images were analyzed to evaluate both propagation velocities by using a method described in previous work [30]. For this, the shock front has been followed on the six images, as well as the diamond shape tip located on the loading axis (dots s1–s3 for the shock front, and d1–d5 for the diamond shape). Since velocities can change with time due to the pressure modification, they have been evaluated several times between each image to obtain a correct average value. Experimental results thus show that the shock front propagates on average at 2800 m s−1 when the stress
waves propagate at 1300 m s−1. This is quite different, and far
from the measurement uncertainties. The stress wave velocity corresponds to the propagation velocity of shear waves for polymer material according to the literature [58]. Therefore, it demonstrates that the observed stress waves are shear waves.
3.4. Toward quantification of stresses
Shear waves and spot-edge effects can be strongly correlated with the laser spot diameter. In the following experiments, the laser spot diameter was reduced to 1 mm to evidence its influ-ence on the shear stress distribution. This has been checked using Config-ELFIE-4 (dark field) and Config-ELFIE-3 (bright
field monochromatic). Once again, the two configurations can be compared because the laser shock parameters were kept identical between the different shocks (see figure 5). It can also be noticed that the observed patterns are identical for the two configurations, except that they are opposite in terms of con-trast. For this, patterns p1 and p3 can be compared. Note that the monochromatic observation has been made for the bright field setup, because not enough light was transmitted through polarizers in the case of the monochromatic dark field setup. The first three snapshots presented in figures 5(a)–(c), evidence that the shear distribution has changed. The diamond shape is no longer visible, and is replaced by a more spherical shape (in particular, see figure 5(c), pattern p2). Monochromatic obser-vations are particularly interesting for the snapshot taken at
t = 1.0 µs and presented in figure 5(e). Indeed, it is the only image for which a fringe network observation is possible. Fringes are circular, and their radii decrease in the direction of the front face (see pattern p4). The corresponding stress level could theo-retically be evaluated. For this, the zero order should be found, and such a fringe cannot be seen in this image. Moreover, the loading mode should also be known, which is not obvious at this time because of bending. Nevertheless, it seems clear that a stress gradient is correlated with the shear stresses.
Figure 4. Observation of the shock wave and stress wave propagations into an epoxy target using Config-ELFIE-2 (photoelasticimetry bright field)—highlighting the shear waves. (a) Snapshot at t = 1.0 µs (from sample Sep1.12). (b) Snapshot at t = 1.2 µs (from sample Sep1.12). (c) Snapshot at t = 1.5 µs (from sample Sep1.12). (d) Snapshot at t = 2.0 µs (from sample Sep1.10). (e) Snapshot at t = 2.2 µs (from sample Sep1.10). (f) Snapshot at t = 2.5 µs (from sample Sep1.12).
As a conclusion, for these experimental results, time resolved observation of shock propagation in epoxy targets using photoelasticimetry has considerably enhanced the phe-nomenon observations. It has highlighted the presence of a shear wave distribution associated with the main laser-induced shock wave propagation. This distribution changes depending on the laser spot diameter. More investigations should be made to have a better understanding of the whole phenom-enon, but so far a first comparison with numerical modeling could be performed with a twofold interest. The experimental data can be used in a first step to validate the numerical model, and then models can be used to obtain a better understanding of the observed phenomenon.
4. Discussions based on numerical modeling
4.1. Modeling challenges and choices
Modeling laser shock experiments with finite element methods can be really challenging. The shortness of the laser pulse
requires the use of a very small mesh size. For thick materials, this yields huge models, even in 2D, which are sometimes not possible to generate using conventional numerical tools. In this paper, spot-edge effects are particularly studied. This is why a full slice of epoxy has been modeled to correspond to the observation plane. Nevertheless, some work has already been performed on the subject by Cuq-Lelandais [59]. It can be used to make some hypotheses about the simulations, thus enabling the calculations. In particular, the temporal pressure profile resulting from femtosecond laser irradiation has been investigated. This was done using a 1D approach, and the ESTHER software [60]. Cuq-Lelandais showed that a 300 fs laser pulse, at 1.06 µm wavelength, at 0.6 PW cm−2, results in
Figure 5. Compared observations of the shock wave propagation into an epoxy target in the case of a smaller focal diameter and using two different configurations—observation of a fringe distribution behind the shock. (a) Snapshot at t = 0.8 µs, using Config-ELFIE-4 (from sample Sep2.1). (b) Snapshot at t = 1.0 µs, using Config-ELFIE-4 (from sample Sep2.1). (c) Snapshot at t = 1.5 µs, using Config-ELFIE-4 (from sample Sep2.5). (d) Snapshot at t = 0.8 µs, using ELFIE-3 (from sample Sep1.6). (e) Snapshot at t = 1.0 µs, using Config-ELFIE-3 (from sample Sep1.6). (f) Snapshot at t = 1.5 µs, using Config-Config-ELFIE-3 (from sample Sep1.11).
Table 3. Epoxy material properties used for polynomial law coefficient calculation, with ρ the density, c0 the initial sound speed,
s an experimental parameter, and Г0 the Mie–Grüneisen coefficient.
ρ (g cm−3) c
0 (cm µs−1) s Г0
a 100 ps pressure pulse after 4 µm of propagation in an alu-minum target. In the case of 0.6 PW cm−2 laser intensity, the
resulting pressure at the same depth is about 100 GPa [59]. Therefore, by neglecting the first few micrometers of the target, and since the ablative layer is made of aluminum, this temporal pressure profile can be used in these work calcula-tions. The spatial distribution has been assumed to be top-hat along the laser focal spot diameter, with a linear decrease over 90 µm on each edge to avoid large numerical shear. This hypothesis corresponds to the experimental conditions. Nevertheless, spatial distribution is an important parameter, which could have an influence on the numerical results, espe-cially on the shear stress distribution. LS-PREPOST and LS-DYNA software was used for the mechanical description of the phenomenon. The epoxy resin has been modeled using a 2D mesh, generated in the same plane as the experimental vis-ualization plane to enable comparisons (see figure 1(c)). The modeled material has been chosen to be elastic hydrodynamic. This can be justified by the high pressure level. Technically, a linear polynomial law, linking pressure to density, has been used. It needs few parameters for the computation of constitu-tive law coefficients, and these are given in table 3. Note that the initial sound speed c0 has been taken from the resin studied
by Laporte [23, 24]. The exact description of this law can be found in LS-DYNA manuals [61, 62].
This numerical model could be improved by using a vis-coplasticity model and damage parameters. Using a more complex constitutive law would require the use of more parameters not always available for these materials, and not validated for this kind of loading. In this work, numerical results only aim to give a first description of the phenomenon. In particular, it is interesting to see how numerical results can
complete experimental data, and help in the understanding of these complex phenomena.
4.2. Model validation
The numerical model validation is presented in figure 6. For this, comparisons between shadowgraphy results and numer-ical calculations have been made at different times. The top of each image ((a)–(c)) is made by time-resolved shadowgraphy, while numerical tension–compression stress displays are pre-sented at the bottom of each image. The separation line was chosen to be the axisymmetrical loading axis to enable easy comparisons. The σZZ stresses are represented by a color scale
changing from one image to the next, and graduated from blue to red, which respectively traduces the compression and the tension states (see figure 6). As explained in the previous sec-tion, the initial pressure is 100 GPa for the numerical mod-eling to represent the experimental conditions.
The shock is first generated and propagates (figure 6(a),
t = 0.6 µs). It propagates through the epoxy material according to its properties (figure 6(b), t = 1.2 µs). Three main features are observed: the shock front, the release wave, and the tension zone induced by spot-edge diffraction. In figure 6(b), this ten-sion zone can be identified and compared with the numerical results. In the simulation displays, blue and dark green zones respectively correspond to shock and release waves. The edge effects, inducing a sharp tension zone, are also visible behind the main shock front, as proved by the red blur on the simulation display. The numerical display at 1.2 µs particu-larly resembles the corresponding experimental snapshot. The calculated position of the shock front through the epoxy thick-ness is identical to that observed experimentally. Therefore,
Figure 6. Compared observations of the shock wave propagation into an epoxy target by shadowgraphy and numerical calculation in the case of a femtosecond laser pulse. (a) Snapshot at t = 0.6 µs, using shadowgraphy and corresponding σZZ stress distribution display, LS-DYNA simulation (100 GPa, 100 ps) LS-PREPOST. (b) Snapshot at t = 1.2 µs, using shadowgraphy and corresponding σZZ stress distribution display, LS-DYNA simulation (100 GPa, 100 ps) LS-PREPOST. (c) Snapshot at t = 2.2 µs, using shadowgraphy and corresponding σZZ stress distribution display, LS-DYNA simulation (100 GPa, 100 ps) LS-PREPOST.
the numerical model describes well at least the shock propaga-tion through the thickness, including progressive weakening. It shows that the shock is also strongly attenuated. It decays from 100 GPa at the initial time to 0.27 GPa in compression after 1.2 µs. This strong weakening is mainly due to the frequency range associated with the short laser pulse duration. After shock reflection on the sample back face, tension propagates backward and meets the spot-edge induced tension area (see
figure 6(c), t = 2.2 µs). The tension level evaluated by numerical calculation is about 140 MPa. For this last comparison, the numerical calculation is a small step in advance compared to the experimental observation. This is probably due to weakening, which is less important in the case of the calcula-tion because of modeling choices. Nevertheless, these good agreements between numerical calculation and experimental observations enable us to validate the model.
Figure 7. Display snapshots of the LS-DYNA numerical simulation of the shock wave propagation into an epoxy target 5 mm thick induced by intense laser irradiation (100 GPa, 100 ps)—representation of σZX stress (LS-PREPOST, dynamic stress color code).
4.3. Shear stress distribution
From the previous section, it is possible to conclude that the developed numerical model describes the main shock propa-gation well for a femtosecond laser pulse. Therefore, some other data can be taken from the model. The shear stress σZX
is presented in figure 7. Qualitative comparisons with the experiments described in the previous section can be made. It has been shown that the observed shear propagation was correlated to 3D effects. Looking at the first three images of figure 7, it can be observed that σZX stresses initiated at
the loading zone edges (upper and lower). For this calcula-tion, their propagation kinematics is closer to the shock front propagation (visible for example in the snapshot taken at t = 0.800 µs), contrary to what has been experimentally observed. Note also that this shear loading is axisymmetrical. Indeed, the color inversion from bottom to top is only due to the posi-tion of the coordinate origin, and the associated propagaposi-tion direction. Shear waves propagate in both x and −x directions. Even if the timing does not correspond, the diamond shape can also be observed in the numerical results. It begins ear-lier, at 0.8, 1.0, and 1.2 µs. In these three images, a diamond shape behind the shocked area can be identified. This good match, geometrically speaking, is highlighted in figure 8, in which a direct comparison between numerical calcula-tion and experimental results can be observed. Focus has been made on three different patterns, which are very similar between the experiment and the calculation. It can also be noticed that the level of shear stresses is a few megapascals. The mismatch in the shear stress propagation timing clearly shows that there is still room for model improvement. In par-ticular, adding viscosity to the model could help to obtain a better numerical description of the phenomenon, and a more accurate evaluation of the stress level. Nevertheless, this first
calculation enables us to validate the assumption made after the experimental investigations. It also gives a first idea of the shear stress level in the case of a femtosecond laser pulse in epoxy resins.
5. Conclusions
In this work, original experimental data on the dynamic response of epoxy resin under a femtosecond-laser-induced shock wave have been obtained. Shocks were generated in epoxy resin with a high power laser source (ELFIE, LULI Laboratory). The laser pulse used in our study allows for creating intense but short loading into the epoxy targets. This gave wide observation possibilities. A specific shad-owgraphy device, based on the photoelasticimetry principle using a polarizer, has enabled the time-resolved observation of shear wave propagation in epoxy resins. These waves have been experimentally evidenced, and their velocity has been quantified in comparison with the main shock propa-gation. Results also highlight the correlation between the shear wave distribution and the initial pressure loading area. The potential of the experimental technique to quantify the stress gradient during the shock propagation has been high-lighted. Finally, a discussion based on numerical results has been given. The developed model has been validated by direct comparison with experimental results. It allows for a qualitative understanding of the shear wave experimentally observed. It also provides more information on the shear stress distribution and levels. These results lead to a better understanding of the laser-induced shock waves in this type of material. Work is in progress to improve the numerical tools for deeper quantitative comparison with experimental results.
Figure 8. Comparison between experimental results (from sample Sep1.10) and numerical calculations (100 GPa, 100 ps—representation of σZX).
Acknowledgment
This work has been carried out thanks to the joint access between CNRS and CEA to the LULI National facility. All the authors would like to express their sincere thanks to the whole LULI staff, technical and administrative, for making these experiments possible. We are very grateful to CEA for kindly providing the use of the ‘CEA/ESTHER v1’ software. The research leading to these results has received funding from the European Union’s Seventh Framework Programme (FP7/2007–2013) under grant agreement ACP0-GA-2010–266226 (ENCOMB—Extended Non-Destructive Testing of Composite Bonds).
References
[1] Mazumdar S K 2002 Composites Manufacturing: Materials,
Product, and Process Engineering (Boca Raton, FL: CRC) [2] Harada Y, Ito T, Suzuki T, Nishino M, Niino H and
Teramoto T 2012 Environmental effects on mechanical behavior of CFRP using laser cutting process The 15th
European Conf. on Composite Materials (Venice, Italy, 24–28 June 2012)
[3] Campagne B and Voillaume H 2008 Development of laser ultrasonics: application to complex shape aeronautical parts
1st Int. Symp. on Laser Ultrasonics: Science, Technology and application (Montreal, Canada, 16 July–18 2008) www.ndt.net
[4] Berthe L, Arrigoni M, Boustie M, Cuq-Lelandais J P, Broussillou C, Fabre G, Jeandin M, Guipont V and Nivard M 2011 State-of-the-art laser adhesion test (LASAT)
Nondestruct. Testing Eval.26303–17
[5] Bossi R et al 2009 Laser bond testing Mater. Eval. 67 819–27 [6] Perton M, Blouin A and Monchalin J-P 2010 Adhesive bond
testing of carbon-epoxy composites by laser shockwave
J. Phys. D: Appl. Phys. 44 034012
[7] Ecault R, Boustie M, Berthe L, Touchard F, Chocinski-Arnault L, Voillaume H and Campagne B Development of the laser shock wave adhesion test on bonded CFRP composite Int.
J. Struct. Integrity 5 253–61
[8] Ecault R, Boustie M, Touchard F, Pons F, Berthe L,
Chocinski-Arnault L, Ehrhart B and Bockenheimer C 2013 A study of composite material damage induced by laser shock waves Composite A 56 54–64
[9] Munson D E and May R P 1972 Dynamically determined high-pressure compressibilities of three epoxy resin systems
J. Appl. Phys. 43962–71
[10] Carter W J and Marsh S P 1995 Hugoniot equation of state of polymers LANL Report No. LA-13006-MS
[11] Barnes N R, Bourne N K and Millett J C F 2002 The shock Hugoniot of an epoxy resin Shock Compression of
Condensed Matter-2001 ed M D Furnish et al (Melville, NY: AIP) pp 135–8
[12] Millett J C F, Bourne N K and Barnes N R 2002 The behavior of an epoxy resin under 1D shock loading J. Appl. Phys.
92 6590–4
[13] Appleby-Thomas G J, Hazell P J and Stennett C 2009 The variation in lateral and longitudinal stress gauge response within an RTM6 epoxy resin under 1D shock loading
J. Mater. Sci. 446187
[14] Millett J C F, Deas D, Bourne N K and Montgomery S T 2007 The deviatoric responce of an alumina filled epoxy composite during shock loading, J. Appl. Phys. 102 063518
[15] Gilat A, Goldberg R K and Roberts G D 2003 High strain rate response of epoxy in tensile and shear loading J. Phys. IV
France110123
[16] Gerlach R, Siviour C R, Petrinic N and Wiegand J 2008 Experimental characterization and constitutive modelling of RTM6 resin under impact loading Polymer 492728–37 [17] Naik N K, Gadipatri R, Thoram N M, Kanala V R and Ch V
2010 Shear properties of epoxy under high strain rate loading Polym. Eng. Sci. 50780
[18] Naik N K, Shankar P J, Kanala V R, Ravikumar G, Pothnis J R and Arya H 2011 High strain rate mechanical behaviour of epoxy under compressive loading:
experimental and modelling studies Mater. Sci. Eng. A 528846
[19] Jiao T and Clifton R 2013 Measurement of the response of an elastomer at pressures up to 9 GPa and strain rates of 105–106 18th Int. Conf. of APS-SCCM (Seattle, WA, USA,
7–12 July 2013)
[20] Stickle A and Ramesh K T 2013 Deformation response of rocky material for a range of stress states and strain rates
18th Int. Conf. of APS-SCCM (Seattle, WA, USA, 7–12 July 2013)
[21] Wilgeroth J, Khan A and Balzer J 2013 characterization of epoxy-based encapsulments 18th Int. Conf. of APS-SCCM
(Seattle, WA, USA, 7–12 July 2013)
[22] Pothnis J R, Ravikumar G, Joshi M, Akella K, Kumar S and Naik N K 2012 High strain rate compressive behavior of epoxy LY 556: radial constraint effect Mater. Sci. Eng. A 538210–18
[23] Laporte D, Malaise F, Hereil P L, Buzaud E and Chevalier J M 2009 Response of bonded assembly under shock wave loading Proc. DYMAT (Bruxelles, 7–11 September 2009) [24] Laporte D 2011 Analyse de la réponse d’assemblages collés
sous des solicitations en dynamique rapide. Essais et modélisations, Phd Thesis Ecole Nationale Supérieure de Mécanique et d’Aérotechnique (doi: 10.1063/1.2783843) [25] Hooper J, Smith P, Hemmer J, Read de alaniz J, Mason B
and Carney J 2013 In situ polymer strain diagnostic using mechanochemical sensor molecules 18th Int. Conf. of
APS-SCCM (Seattle, WA, USA, 7–12 July 2013)
[26] Skripov P V, Starostin A A and Puchinskis S É 2000 Heat transfer and thermal fracture of polymers in pulsed processes Doklady Phys. 45663–6 (Translated from 2000
Dokl. Akad. Nauk 375 615–8)
[27] Khishchenko K V, Fortov V E and Lomonosov I V 2002 Thermodynamic properties and physical–chemical transformations of polymer materials at high temperatures and pressures Int. J. Thermophys. 23 211–9
[28] Clements B E 2012 A continuum glassy polymer model applicable to dynamic loading J. Appl. Phys. 112 083511 [29] Taylor N, Williamson D and Jardine A 2013 Thin film metal
thermistors with microsecond time response for shock temperature measurement of polymer 18th Int. Conf. of
APS-SCCM (Seattle, WA, USA, 7–12 July 2013)
[30] Ecault R, Berthe L, Boustie M, Touchard F, Lescoute E, Sollier A, Mercier P and Benier J 2013 Observation of the shock wave propagation induced by a high-power laser irradiation into an epoxy material J. Phys. D: Appl. Phys. 46235501
[31] Wyatt R C 1972 Visualization of pulsed ultrasound using stroboscopic photoelasticity Non-Destruct. Testing 5354–8 [32] Hall G 1977 Ultrasonic wave visualization as a teaching aid in
non-destructive testing Ultrasonics 1557–69
[33] Archer-Hall J A and Hutchins D A 1979 The photoelastic visualization of ultrasonic waves in liquids Ultrasonics 17209–12
[34] Hall K G 1982 Observing ultrasonic wave propagation by stroboscopic visualization methods Ultrasonics 20159–67
[35] Nam Y-H and Lee S S 2003 A quantitative evaluation of elastic wave in solid by stroboscopic and photoelasticimetry
J. Sound Vib.2591199–207
[36] Liou T-M 2001 Exp. Thermal Fluid Sci. 25359–75 [37] Hauer M, Funk D J, Lippert T and Wokaun A 2003 Laser
ablation of polymers studied by ns-interferometry and ns-shadowgraphy measurements Appl. Surface Sci.
208–9 107–12
[38] Hauer M, Funk D J, Lippert T and Wokaun A 2004 Time resolved study of the laser ablation induced shockwave
Thin Solid Films 453–4 584–8
[39] Siew W O, Tou T Y and Wong K H 2005 Shadowgraphy of pulsed CO2 laser ablation of polymers Appl. Surface Sci.
248281–5
[40] Fardel R, Nagel M, Nüesch F, Lippert T and Wokaun A 2009 Shadowgraphy investigation of laser-induced forward transfer: front side and back side ablation of the triazene polymer sacrificial layer Appl. Surface Sci. 2555430–4 [41] Feinaeugle M, Alloncle A P, Delaporte Ph, Sones C L and Eason R W 2012 Time-resolved shadowgraph imaging of femtosecond laser-induced forward transfer of solid materials Appl. Surface Sci. 2588475–83
[42] Svingala F R, Hargather M J and Settles G S 2012 Optical techniques for measuring the shock Hugoniot using ballistic projectile and high-explosive shock initiation, Int. J. Impact
Eng. 5076–82
[43] Gentilleau B, Bertin M, Touchard F and Grandidier J-C 2011 Stress analysis in specimens made of multi-layer polymer/composite used for hydrogen storage application: comparison with experimental results Comp. Struct. 932760–7
[44] Bertin M, Touchard F and Lafarie-Frenot M-C 2010 Experimental study of the stacking sequence effect on polymer/composite multi-layers submitted to
thermomechanical cyclic loadings Int. J. Hydrogen Energy 3511397–404
[45] Zel’docvich Ya B and Raizer Yu P 2002 Physics of Shock
waves and High Hydrodynamic Phenomena ed W D Hayes and R F Probstein (New York: Dover)
[46] Sedov L I 1959 Similarity and Dimensional Methods in
Mechanics ed M Holt (London: InfoSearch) [47] Antounn T 2003 Spall Fracture (New York: Springer)
[48] Setchell R E 2002 Refractive index of sapphire at 532 nm under shock compression and release J. Appl. Phys. 91 2833 [49] Fratanduono D E, Eggert J H, Boehly T R, Barrios M A and
Meyerhofer D D 2011 Index of refraction of shock-released materials J. Appl. Phys. 110083509
[50] Settles G S (ed) 2001 Schlieren and Shadowgraph Techniques,
Visualizing Phenomena in Transparent media (Berlin: Springer)
[51] Cuq-Lelandais J P et al 2009 Spallation generated by femtosecond laser driven shocks in thin metallic targets
J. Phys. D: Appl. Phys. 42065402
[52] Zewail A H 1999 Femtochemistry: atomic scale dynamics of chemical bond using ultrafast lasers, nobel lecture, Dec 10, 1999, and biographical sketch The Nobel
Foundation—Stockholm (New York: Wiley-VCH)
[53] Frocht M M and Leven M M 1969 Photoelasticity: the Selected
Scientific Papers of M. M. Frocht (Oxford: Pergamon) [54] Aben H, Ainola L and Anton J 2000 Integrated photoelasticity
for nondestructive residual stress measurement in glass
Opt. Lasers Eng.3349–64
[55] Aben H 1979 Integrated Photoelasticity (New York: McGraw-Hill)
[56] Freire J L F and Voloshin A 2009 Photoelasticity. Experimental
Mechanics (Encyclopedia of Life Support Systems, EOLSS)
(Paris: UNESCO–EOLSS)
[57] Cuq-Lelandais J-P, Boustie M, Berthe L, Combis P, Sollier A, De Résseguier T, Lescoute E, Gay E, Soulard
LandBontaz-Carion J 2009 2D investigation of laser shock induced spallation in subpicosecond regime DYMAT (Brussels, Belgium)
[58] Etienne S and David L 2012 Introduction à la Physique des
Polymères 2ème édn (Paris: Dunod)
[59] Cuq-Lelandais J-P 2010 Etude du comportement dynamique de matériaux sous choc laser sub-picoseconde,
PhD Thesis Ecole Nationale Supérieure de Mécanique et d’Aérotechnique (https://hal.archives-ouvertes.fr/ tel-00564182)
[60] Colombier J P et al 2005 Hydrodynamic simulations of metal ablation by femtosecond laser irradiation Phys. Rev. B
71 165406
[61] LS-DYNA 2007 Keyword User’s Manual vol I and II [62] LS-DYNA 2006 Theory Manual compiled by J O Hallquist
![Table 1. Epoxy sample properties as presented by Bertin [43, 44].](https://thumb-eu.123doks.com/thumbv2/123doknet/13032200.381938/4.892.459.825.117.183/table-epoxy-sample-properties-presented-bertin.webp)