HAL Id: tel-01990594
https://tel.archives-ouvertes.fr/tel-01990594
Submitted on 23 Jan 2019
HAL is a multi-disciplinary open access archive for the deposit and dissemination of sci-entific research documents, whether they are pub-lished or not. The documents may come from
L’archive ouverte pluridisciplinaire HAL, est destinée au dépôt et à la diffusion de documents scientifiques de niveau recherche, publiés ou non, émanant des établissements d’enseignement et de
Les propriétés adhésives et rhéologie interfaciale de
mortiers colles
Alessandra Fujii Yamagata
To cite this version:
Alessandra Fujii Yamagata. Les propriétés adhésives et rhéologie interfaciale de mortiers colles. Génie civil. Université Paris-Saclay, 2018. Français. �NNT : 2018SACLN035�. �tel-01990594�
Adhesive properties and interfacial
rheology of adhesive mortars
Les propriétés adhésives et rhéologie interfaciale de mortiers collesThèse de doctorat de l'Université Paris-Saclay préparée à École Normale Supérieure Paris-Saclay
École doctorale n°579 Sciences mécaniques et énergetiques matériaux et géosciences
Spécialité de doctorat: Génie Civil
Thèse présentée et soutenue à Cachan, le 17 décembre 2018, par
Alessandra Lie Fujii Yamagata
Composition du Jury : M. Farid Benboudjema
Professeur, Université Paris-Saclay Président
M. Arnaud Perrot
Maître de Conférences, Université de Bretagne-Sud Rapporteur
M. Lazhar Benyahia
Professeur, Université du Maine Rapporteur
Evelyne Prat
Directeur R&D, ParexGroup Examinatrice
Mohend Chaouche
Directeur de Recherche CNRS, Université Paris-Saclay Directeur de thèse
Anne Daubresse
Ingénieur R&D, ParexGroup Co-encadrante
Laurent Frouin
Directeur R&D, Ecocem Materials Invité
NNT : 2 0 1 8 S A CLN 0 3 5
Acknowledgements
During this journey I believe I could finally understand the true meaning of becoming a Doctor of Philosophy. The term Doctor of Philosophy comes from the ancient Greek, and it means “lover of wisdom”. Through these years I feel that my relationship with knowledge has achieved a whole new level. I acquired the basis of critical thinking and the ability to apply the scientific method to various things in life. I am very thankful for that.
I acknowledge ParexGroup for trusting in me for this thesis, especially Anne Daubresse, Evelyne Prat and Marco Cappellari for their support, help and advices. Their knowledge, field experience and guidance were important to make this thesis more useful for real-world applications. I also hold great respect and admiration for all the professionals at the Centre d’innovation Parexgroup. They are very kind and nice people, caring for our safety and wellbeing.
I would like to thank my supervisor, Professor Mohend Chaouche, for giving me this unique opportunity. His creativity and vision were of great inspiration. Through these years I learned many important lessons about research and science from Professor Chaouche. I also would like to thank Fábio Alonso Cardoso for being a second unofficial supervisor, guiding me through difficulties and teaching me so much. His knowledge and patience were of huge inspiration to me to still desire to continue in the science path.
To all my colleagues and friends in LMT, I’m thankful for their friendship and help during my years in France. Living in a foreign country is much easier when you have friends to share happy moments with. These moments were important to make this process easier. I’d like to specially thank Rémy and Benjamin for their help with my thesis.
I’d like to also thank my family and Paulo, my life partner, for being a huge support in my life in all moments that I needed them. None of this have been possible without their love and support.
I’m also very thankful to my former supervisors at the University of Sao Paulo, Raphael Giuliano Pileggi and Roberto Cesar de Oliveira Romano, for introducing me to the world of research. Their passion will always be a great inspiration for me.
I like to think of Research as being a big project, which consists of expanding the frontiers of knowledge and human development. My thesis is perhaps one tiny grain of sand among many
community for contributing and being part of this. I feel truly honored to be part of this big project, even as a tiny grain of sand.
Finally, but not least, I’d like to thank God for all wonderful people and things he has brought to my life. I feel blessed for all opportunities I have gotten during my entire life.
Contents
Chapter 1 – Context and objective ... 1
1.1 Context and relevance ... 1
1.2 Objective ... 2
1.3 Thesis structure ... 2
Chapter 2 – State of art review: Adhesive mortars, Cement hydration, mortar additives, skin formation and adhesion ... 5
2.1 Introduction ... 5
2.1.1 Adhesive mortars ... 5
2.2 Cement hydration ... 9
2.2.1 Portland cement ... 9
2.3 Mortars additives ... 13
2.3.1 General types of additives ... 13
2.3.2 Cellulose ether (CE) ... 14
2.3.3 Other polysaccharides admixtures: guar ether and starch ether ... 25
2.3.4 Latex ... 28
2.4 Skin formation ... 34
2.4.1 Skin formation mechanism ... 35
2.4.2 Polymer migration in adhesive mortars ... 36
2.4.3 Effect of skin formation on contact generation between mortar and tile ... 38
2.4.4 Skin rheological properties ... 39
2.5 Adhesion ... 41
2.5.1 Adhesion, cohesion and related forces ... 42
2.5.4 Van der Waals forces ... 44
2.5.5 Particles agglomeration and surface charges ... 45
Chapter 3 – Bulk rheological properties of adhesive mortar with different cellulose ether contents 47 3.1 Introduction ... 47
3.2 Literature review ... 47
3.2.1 Rheology fundaments, concepts of viscosity and yield stress ... 47
3.2.2 Measurement techniques ... 53
3.3 Experiments ... 74
3.3.1 Materials and formulations ... 74
3.3.2 Methods ... 77
3.4 Results and discussion of Chapter 3 ... 79
3.4.1 Bulk oscillatory properties ... 79
3.4.2 Effect of CE types ... 82
3.4.3 Flow rheological properties of mortars with different CE content ... 84
3.4.4 Squeeze flow of adhesive mortar with different cellulose ether (CE) content ... 87
3.4.5 Tack test ... 90
3.5 Chapter conclusions ... 95
Chapter 4 – Skin formation evaluation ... 97
4.1 Introduction ... 97
4.2 Literature Review ... 98
4.2.1 Interfacial rheology ... 98
4.2.2 Magnetic Resonance Imaging (MRI) ... 100
4.3 Experimental ... 102
4.3.1 Materials ... 102
4.3.2 Formulations ... 102
4.4 Results... 105
4.4.1 MRI ... 105
4.4.2 Interfacial Rheology of skin ... 108
4.4.3 Effect of CE type ... 112
4.4.4 Wind effect for gray cement ... 113
4.5 Chapter conclusions ... 114
Chapter 5 – Microstructural evaluation with micro-tomography and adhesive stress ... 117
5.1 Chapter Introduction ... 117
5.2 Literature review ... 118
5.2.1 Fundaments of tomography ... 118
5.2.2 Influence factors of micro-tomography ... 119
5.2.3 Micro-tomography applied in cementitious materials ... 121
5.3 Experimental ... 124
5.3.1 Materials ... 124
5.3.2 Methods ... 124
5.4 Results... 127
5.4.1 CE content effect on adhesive stress ... 127
5.4.2 Concrete substrate-mortar-tile system micro-tomographic characterization ... 128
5.4.3 Ribs and flat application effect on a tile-mortar-substrate system at constant force 130 5.4.4 Pores distribution of mortar on a tile-mortar-tile system at constant gap ... 130
5.5 Chapter conclusions ... 135
Chapter 6 – Evaluation of mortar-substrate contact generation with optical microscopy 137 6.1 Introduction ... 137
6.2 State of art ... 137
6.3.1 Materials and formulations ... 139
6.3.2 Microscopical visualization method ... 140
6.3.3 Determination of wetting capability/transfer ... 141
6.4 Results and discussion of Optical microscopy ... 141
6.4.1 CE content effect on adhesive mortars contact generation ... 141
6.4.2 Impact of CE degree of substitution on contact generation ... 148
6.4.3 Transfer – effect of CE content ... 155
6.4.4 Transfer – effect of CE DS ... 158
6.5 Chapter conclusions ... 161
Chapter 7 – Final contributions ... 163
7.1 Conclusion and perspectives ... 163
List of figures
Figure 1. Examples of use of adhesive mortar system (left to right): bathroom, swimming pool,
facade. ... 6
Figure 2. Simplest adhesive mortar system: Substrate-adhesive mortar-tile. ... 6
Figure 3. Flow diagram of the dry process for portland cement manufacture [7]. ... 10
Figure 4. Mechanism of air entrainment when an anionic surfactant with a nonpolar hydrocarbon ... 13
Figure 5. Cellulose [16]. ... 16
Figure 6. Production of MHEC [15]. ... 17
Figure 7. Structure of cellulose ethers: (a) HPMC, (b) MHEC, (c) HEC.[20]. ... 18
Figure 8. Representative architectures for polymers which undergo intermolecular association in aqueous solution [21]. ... 19
Figure 9. Representative chemical structures for polymers which undergo intermolecular association in aqueous solution. Note that for several of the structures (e.g. the polysaccharide) only part of the structure suggesting the attachment sites of the hydrophobes is indicated [21]. ... 20
Figure 10. Apparent Viscosity vs. Shear Rate, 2% aqueous solutions of an MHEC of different nominal viscosities [12]. ... 21
Figure 11. Apparent Viscosity vs. Shear Rate, for Aqueous Solutions of 4,000 mPa.s CE at different concentrations ... 22
Figure 12. Temperature-dependent viscosity and gelation of methylcellulose [15]. ... 23
Figure 13. Molecular structure of Guar gum [37]. ... 26
Figure 14. Molecular structure of HydroxyPropyl Guar [35]. ... 26
Figure 15. Amylose and amylopectin chemical structure [39]. ... 27
Figure 16. Representation of the successive stages in film formation as an aqueous dispersion of polymeric microspheres dries above the minimum film forming temperature (MFFT) [45]. ... 29
Figure 17. RPP production simplified model [52]. ... 31
Figure 20. Scheme for illustrating skinning mechanism. Abbreviations: � - evaporation rate; �-
flow rate of mortar water [2]. ... 36
Figure 21. Concentration profile of VC latex in the cement–polymer matrix sampled across the mortar bed on an xy section [1]. ... 36
Figure 22. Concentration variations of CE and PVA in the cement–polymer matrix as a function of the distance from the substrate surface (along y axis in Fig. 2). (a, b) VC-modified mortar. (c, d) SA-modified mortar [1]. ... 37
Figure 23. Schematic synthesis of the mortar evolution. The nonlinear horizontal time axis highlights the major stages of the mortar evolution [1]. ... 38
Figure 24. (a–c) Deformation of fresh mortar including skin at the surface during tile ... 39
Figure 25. Dynamic in-situ micro-rheology with a Krüss tensiometer K-100 MK2 a cylindrical probe with a diameter of 2 mm is pushed with 1.2 mm/min from the mortar surface to a depth of 2.1 mm [2]. ... 40
Figure 26. Micro-rheological intrusion-force diagram of an adhesive mortar for different open times (0-60 min) [59]. ... 40
Figure 27. Plate/plate rheological response of a CE based mortar at 20min(a) and at 30min(b), Yield evaluation on shear stress response [19]. ... 41
Figure 28. Definition of various energy terms associated with the adhesion of solid surfaces and the surface area changes of liquids. Note that W and g are idealized thermodynamic quantities, assuming reversibility and smooth surfaces. In practice, only with liquids can the area be changed gradually and reversibly, as in (c). For solids, their adhesion, cohesion, and debonding processes, as in (a) or (b), usually involve plastic deformations with the dissipation of irreversible energy as heat. Note the positive sign of W (i.e., W > 0) for the work of adhesion/cohesion where, by convention, the reference state (of zero energy) is the contact state (D=0), compared to the negative values forW(D) and w(r) where, again by convention, the reference states are at D=∞, r=∞ [65]. ... 43
Figure 29. Newton model for viscosity definition two parallel sheets (or planes) of area “A”, separated by a infinitesimal distance “dx”, moving in the same direction with different velocities “�1” and “�2”. The difference between the sheets is kept by the application of an external force “F” in one of the sheets. ... 48
Figure 30. Newtonian fluid behavior ... 49
Figure 31. Basic fluids behaviors ... 50
Figure 34. Schematic diagram of a stress controlled (a) and a strain controlled (b) rheometer [93]. ... 54 Figure 35. Possible shapes of hysteresis loops [90]. ... 56 Figure 36. Imposed stress or deformation in red and deformation or stress response in blue. 57 Figure 37. Evolution of elastic moduli G’and G” of the viscous cement paste [102]. ... 59 Figure 38. The storage modulus G’ and the loss modulus G” as functions of the strain amplitude (�0) for an aqueous solution (1.25 wt%) at ω = 10 rad · s−1 and the corresponding stress response in SAOS and LAOS [104]. ... 60 Figure 39. Amplitude test – strain sweep [94]. ... 61 Figure 40. Evolution for the storage modulus G’ (a) and loss modulus G” (b) as a function of strain amplitude for different dosage rates of CE (grade MHEC-A20000). (○) 0% CE; (□) 0.03% CE; (⧫) 0.06% CE; (∆) 0.09% CE; and (�) 0.12% CE [9]. ... 62 Figure 41. Shear moduli vs. frequency sweep (w/c=0.5, T =25ºC) [119]. ... 63 Figure 42. Geometries used for rotational rheometry: (a) Cup and Bob; (b) Cone and Plate; (c) Parallel Plates. ... 64 Figure 43. Haake viscometer SV geometries: vane with six-bladed (left), serrated cylinder (middle) and smooth cylinders (Right) [123]. ... 65 Figure 44. Typical load vs. displacement curve of a displacement-controlled squeeze flow test, illustrating the three main stages of the material's behavior. Stage I: small strain — elastic deformation; Stage II: moderate strain — plastic deformation or viscous flow; and Stage III: large strain — strain hardening [138]. ... 67 Figure 45. Scheme of initial and final test conditions of squeeze flow in a constant area configuration. D = upper plate diameter; ℎ� = sample initial height; ℎ = sample final height, which depends on the plate displacement [133]. ... 68 Figure 46. Constant volume configuration. Example of flow lines for the interface slip conditions – no slip (infinite friction) and free slip (no friction) [133]. ... 69 Figure 47. Failure modes on tack test: (a) Cohesive rupture and (b) Adhesive rupture ... 72 Figure 48. Cartoon illustrating schematically three different failure modes [147]. ... 72 Figure 49. Analysis of the tack test results. (a) General shape of the tack force curves; (b) evolution of the force peak versus stretching velocity [127]. ... 73 Figure 50 . Graphical representation of failure energy. ... 74 Figure 51. Granulometric distribution of sand used in this investigation obtained from the
Figure 52. Rotational and oscillatory rheometry vane geometry and cup system dimensions used in this investigation. ... 77 Figure 53. Illustration of adhesive mortar sample preparation: the metallic comb turns around axis to form the cylindric shape of the sample ... 78 Figure 54. Scheme of squeeze flow and tack test montage – the geometry press ... 79 Figure 55. Simplified normal force/load vs time curve of a squeeze test, relaxation and tack test ... 79 Figure 56. Storage modulus (G') and Loss modulus (G'') of adhesive mortars with different CE content formulated with white cement (a) and gray cement (b). ... 81 Figure 57. Storage modulus of adhesive mortar with different cellulose content formulated with gray cement. ... 82 Figure 58. Storage modulus (G') and Loss modulus (G'') of adhesive mortars with different CE types formulated with white cement (a) and gray cement (b). ... 83 Figure 59. Flow curve cycle of acceleration (►) and deceleration (◄) of adhesive mortars formulated with gray cement and different CE content and table with thixotropy values. ... 84 Figure 60. Parameters obtained from the Herschel-Bulkley model application on deceleration of flow cycle of formulations with different CE content: (a) Yield Stress; (b) Consistency and; (c) Flow index ... 87 Figure 61. Squeeze flow graphs of adhesive mortars with different CE content (0.1%, 0.25% and 0.4%) at different open times: (a) 0 min; (b) 10 min; (c) 20 min; (d) 30 min; (e) 40 min; (f) 50 min; (g) 60 min. ... 88 Figure 62. Final normal force of squeeze flow test of adhesive mortar with different open time ... 90 Figure 63. Peak force of tack test of g_0.1% CE-A adhesive mortar with different open time ... 91 Figure 64. Peak force of tack test of g_0.25% CE-A adhesive mortar with different open time ... 92 Figure 65. Peak force of tack test of g_0.4% CE-A adhesive mortar with different open time ... 92 Figure 66. Failure energy of the tack tests of the formulations with different CE content measured at different open times, calculated by the integral of normal force vs gap curve. ... 93 Figure 67. Peak force of tack test of adhesive mortar formulation with gray cement and different CE content at 0, 10, 20, 30, 40, 50 and 60 min of open time. ... 93
Figure 68. samples after squeeze and tack test of adhesive mortars with gray cement and different CE content ... 95 Figure 69. Scheme of Langmuir trough [159] ... 99 Figure 70. Interfacial rheometry apparatus – Bicone and Nöuy Ring ... 99 Figure 71. Moisture profile of unsealed mortar samples a) 0 wt.% MHEC, b) 0.4 wt.% MHEC, c) 1.3 wt.% MHEC and d) 2.1 wt.% MHEC. All the profiles have been plotted every 24 min [165]. ... 102 Figure 72. MRI samples scheme: (a) 2D MRI – sample dimensions and section cut of signal visualization; (b) 1D MRI – sample dimensions and representation of signal distribution obtained ... 104 Figure 73. Scheme of the rheological measurements of the adhesive mortars using a vane geometry: (a) bulk measurements were done at 84.5 mm depth; (b) interfacial measurements were done at 3 mm depth with the mortar exposed to air at the interface. ... 105 Figure 74. Scheme of interfacial rheology test in windy environmental condition. ... 105 Figure 75. 2D MRI Result - 1st echo signal mitigation of water signal of an adhesive mortar sample (w_0.25% CE-A) exposed to air on the top: (a) water vanishing after 30 min; (b) water vanishing after 1 h; (c) water vanishing after 2 h. ... 106 Figure 76. 1D MRI Result – 1st echo map signal vs time of adhesive mortar samples exposed to air on the top: (a) W_0.1% CE-A; (b) W_0.25% CE-A; (c) W_0.4% CE-A ... 107 Figure 77. (a) Bulk measurements (G'bulk) and 3mm measurements (G'3mm) of adhesive mortars with different CE content formulated with white cement (b) G'interface calculated by the different of the G'3mm and G'bulk (c) G'interface vs water loss of adhesive mortars with different CE content formulated with white cement. ... 109 Figure 78. (a) G'interface of adhesive mortars with different CE content formulated with gray cement and curves of water loss over time of each formulation (b) G'interface vs water loss of adhesive mortars with different CE content formulated with gray cement ... 111 Figure 79. G'interface/Water loss vs CE content at t = 2 hours of formulations with grey and white cement. ... 112 Figure 80. G'interface of adhesive mortars with different CE types formulated with white cement (a) and gray cement (b). Each color represents a type; continuous and dashed lines are test repetitions. Water loss over time of the same formulations is represented by dotted curves. 113 Figure 81. Interfacial storage modulus of adhesive mortars with different CE content in windy
Figure 82. Illustration of the principle of a 3D acquisition by X-ray tomography from a series
of 2D radiographs obtained by a sample in a fixed axis [Source: Phoenix|X-ray]. ... 118
Figure 83. Achievable resolution vs. measuring range [174,177]. ... 119
Figure 84. A mortar sample reconstructed slice image (a), and a sectioned 3D rendering (b). In these images, the brightness is a function of X-ray absorption, with bright spots showing regions of high absorption, and dark spots showing regions of low absorption [178]. ... 122
Figure 85. Tomographic sections of a reconstruction volume of an ETICS at different states of deformation; in the left, the XY sections; and in the righ, the XZ sections at the fissuration [176]. ... 123
Figure 86. Section of a mortar sample at different evolution times [172]. ... 124
Figure 87. X-ray micro-tomographer available at ENS-Cahan (left); x-ray tube micro-oven of 225kV and detector of 3072x3888 pixels at high resolution (right). Adapted from [176]. ... 125
Figure 88. Sample example: concrete substrate on bottom, mortar with ribs and ceramic tile on top. ... 126
Figure 89. Cross and longitudinal sections of a ceramic-mortar-tile sample ... 126
Figure 90. Cross and longitudinal sections of a tile-mortar-tile sample ... 126
Figure 91. Exemplification of the zones of the sample: (a) upper, (b) middle), and (c) bottom. ... 127
Figure 92. Graph of adhesive stress of mortar formulations with different CE content (a – adhesive; c – cohesive). ... 128
Figure 93. Longitudinal section of mortar-tile contact: (a) g_0.1% CE-A; (b) g_0.25% CE-A; and (c) g_0.4% CE-A. ... 129
Figure 94. Longitudinal section of mortar-tile contact for formulations with (a) 0% and (b) 5% Latex ... 130
Figure 95. Longitudinal section of mortar-tile contact applied with a flat spatula and toothed comb (same scale) ... 130
Figure 96. Gray level distribution of formulations with different CE content ... 132
Figure 97. Gray level distribution of formulations with different Latex content ... 133
Figure 98. Sample of g_0.4% CE-A (rib) formulation mortar. ... 134
Figure 99. Mortar and tile interfaces of g_0.4% CE-A (rib) formulation: (a) Upper and (b) bottom. ... 134
Figure 100. Contact between upper tile and mortar g_0.4% CE-A with different application methods: (a) comb and (b) flat spatula ... 135
Figure 102. Experimental setup with two options for sample illumination. If the glass plate is illuminated directly from above (lamp “T” is on and lamp “S” is off), it can be observed how well the mortar rips are deformed underneath the glass plate [180] ... 138 Figure 103. (a) Photograph of 10x10 cm glass plate embedded 30 min after the mortar (formulation F-ref in Table 1) was combed. Sample produced according to EN 1347. Mortar ribs are pressed to a degree of 96 area% (measured within the marked area). (b) Same sample illuminated from the side as described by Zurbriggen et al. [180]. Skin appears dark. Bright wetting area measures 33% (measured within the marked area). ... 138 Figure 104. Contact generated [59]. ... 139 Figure 105. no-slip squeeze of a isothermal material for different compression ratio (C.R.) of a material with power-law index equal 0.3 [181] ... 139 Figure 106. Digital microscope VHX (Right) and scheme of image obtained (Left) ... 140 Figure 107. Sample mapping for image acquisition ... 141 Figure 108. Samples of adhesive mortars with different CE content for contact visualization with optical microscopy ... 142 Figure 109. Microscopy images of contact ... 143 Figure 110. g_0.1% CE-A contact visualization at different open times, at the rib and between ribs ... 145 Figure 111. g_0.25% CE-A contact visualization at different open times, at the rib and between ribs ... 146 Figure 112. g_0.4% CE-A contact visualization at different open times, at the rib and between ribs ... 147 Figure 113. Samples of microscopical visualization of adhesive mortar with different CE content at different open time ... 148 Figure 114. Contact evolution of adhesive mortar g_0.25% CE-A at rib and between ribs for different open times ... 150 Figure 115. Contact evolution of adhesive mortar g_0.25% CE-B at rib and between ribs for different open times ... 151 Figure 116. Contact evolution of adhesive mortar g_0.25% CE-C at rib and between ribs for different open times ... 152 Figure 117. Contact evolution of adhesive mortar g_0.25% CE-D at rib and between ribs for different open times ... 154
Figure 119. Transfer of g_0.1% CE-A and g_0.25% CE-A adhesive mortar formulations for different open time ... 157 Figure 120. Transfer of g_0.4% CE-A adhesive mortar formulation for different open time 158 Figure 121. Transfer of g_0.25% CE-A and g_0.25% CE-B adhesive mortar formulations for different open time ... 160 Figure 122. Transfer of g_0.25% CE-C and g_0.25% CE-D adhesive mortar formulations for different open time ... 161
List of Tables
Table 1. Main families and characteristics ... 6
Table 2. Classification and designation of industrial adhesive mortar [4] ... 7
Table 3. Oxides abbreviations ... 10
Table 4. Compounds abbreviations ... 11
Table 5. Phase compositions, density and blaine fineness of the investigated cements ... 74
Table 6. Formulations of adhesive mortars with gray cement, with different cellulose ether content and types (wt%) ... 76
Table 7. Properties of the cellulose ethers used in this investigation, as provided by the manufacturer: Viscosity (mPa.s), molar substitution (MS) and degree ... 76
Table 8. Measured peak force at 0 min open time and calculated peak force and maximum delta pressure ... 94
Table 9. Formulations of adhesive mortars with white and gray cement, with different cellulose ether content and types (wt%) ... 103
Table 10. Formulations of adhesive mortars with different cellulose ether content and types (wt%) ... 140
Chapter 1
– Context and objective
1.1
Context and relevance
Cement is the most used industrial product in volume in the world. Modern life and cities are based on cementitious foundations. The reason why cement became such an important material is that it can be easily shaped when mixed with water, and through chemical reactions with water—called hydration—cement obtains outstanding mechanical properties and durability. From this important material, different sub-products are produced, such as: concrete; grouts; and mortars (adhesive mortar, finishing mortar, bricklaying mortar, etc.). These are then used to build a great majority of our construction: dams, highways, bridges, buildings, houses, etc. All these “major systems” are made of smaller sub-systems in civil engineering, such as: foundation; structure; electric, water and sewer systems; coatings; etc. Each of them takes advantage of cementitious materials according to their requirements.
Adhesive mortar is used to glue a variety of types of materials to different surfaces; thus, this type of mortar is used either for residential and non-residential construction, for fixation of different types of tiles. Adhesive mortar is used in facades, floors, walls, swimming pools, etc. The Tile Adhesive Market will cross USD 4.5 billion by 2022, according to Tile Adhesives Market Research Report. Thus, due to its importance in system and volume, the industry has been developing to create more reliable and durable systems. Less than 50 years ago, the use of industrial pre-mixed mortars was a turning point in construction material technology, since it enabled the production of highly technological powder mixes with the use of additives, with predictable mechanical properties and more reliable application and durability.
The additives considerably improved rheological properties, mechanical uses and the productivity of adhesive mortars, and they also corrected basic formulation issues. There are many different types of additives, such as: air-entraining admixture, thickening admixture, accelerators, retarders, plasticizes, etc. In adhesive mortars, two of the main additives that started being used are cellulose ether and redispersible polymer powder (latex in redispersible form). Both additives can improve some essential characteristics of the tile adhesives.
Cellulose ether (CE) is used for thickening and water retention. This is important to create the adhesive mortar “stick” property and maintain water for cement hydration by avoiding water loss to the substrates and air. Latex is used to improve adhesion and flexibility of mortars, which is often required due flexion stresses in hardened state resulting from differential expansion of
complex and generate undesired side effects. Thus, as the mortars technology advances, the demand for research to understand how different additives work and how to improve them is growing.
The use of additives can bring improvements to tile adhesive performance, but frequently, its use is based on final performance tests and applicator feeling, and when some complex problems occur, its understanding demands further comprehension of how the additives work inside the system and in a synergic with the other components of the formulation. Furthermore, obtaining optimal formulations, with lower cost and higher performance is only possible with a deep understanding of the additive’s mechanisms and how they influence the complex system of cementitious materials.
In the adhesive mortar context, skin formation is often an issue in real application. Research has been done concerning its matter, but this problem has still many open questions [1]. The skin is a surface layer with different properties compared to the body underneath [2] and, in adhesive mortars, it is formed due to water drying from the surface layer; it is also related to film formation and carbonation [1,3]. This dry external layer (skin) at the mortar-air interface should be avoided because it may be difficult to be deformed during tile emplacement and it can hinder the mortar’s capability to wet the tile surface properly [1,2]
Not many studies focus on the rheological properties of skin, despite its major control of contact generation and ability to allow fresh material inside the rib to wet the tile. Due to its importance, different studies have tried to characterize the skin, but they fail to separate the mortars skin and the bulk properties.
1.2
Objective
The objective of this thesis is to characterize rheological properties of skin formation and understand it influence on adhesive properties.
1.3
Thesis structure
This thesis is structured with 7 Chapters, including Chapter 1, in which the context, objective and motivations of this research are presented. Chapter 2 provides an overview of adhesive mortar’s current state of art with standards and regulations; as well as an overview of additives used by industry, with deeper exploration on cellulose ether and latex redispersible polymer powder.
Results and discussions are organized in four chapters, with each exploring one aspect of adhesive mortar’s skin formation and adhesive properties. Chapter 3 covers bulk properties of adhesive mortars, evaluated by different test methods: oscillatory rheometry, rotational rheometry, squeeze test, and tack test. This chapter offers relevant rheological properties, which help explain further chapters’ results, specially contact generation on Chapter 6.
Chapter 4 introduces the concept of interfacial rheology applied to cementitious materials, describing the development of the method and evaluating the effect of CE content type on the interfacial properties of adhesive mortars. Additionally, MRI is used to assess water distribution at the interface and characterize the skin. This chapter offers the main contributions to the scientific community.
Chapter 5 covers a microstructure evaluation of adhesive mortars depending on the polymer content (CE and RPP) and application mode. Micro-tomography is used to generate 3D and 2D visualizations of the microstructure of mortars. The goal is to verify traces of the skin in the microstructure. The technique gives some indications of contact generation and the consequences of the rheological properties of the mortars.
Chapter 6 explores contact visualization and gives a transfer evaluation of different adhesive mortars formulations, observing the effect of CE content and type. It also illustrates the process of contact generation. The use of small depth of field for contact visualization is innovative and offers valuable insights on the impact of rheological properties of the bulk and interface on contact.
Finally, Chapter 7 provides overall conclusions and suggestion for the direction of future research.
Chapter 2
– State of art review: Adhesive mortars, Cement hydration,
mortar additives, skin formation and adhesion
2.1
Introduction
Adhesive mortar skin formation is the main focus of this research; thus, an overview of current “state of art” is presented in this chapter. First, adhesive mortars system, requirements and techniques are presented. This overview offers an understanding of the industrial adhesive mortar requirements for serviceability.
Second, adhesive mortars main raw materials are shown and details on their mechanisms are introduced. This includes additives such as latex and cellulose ethers admixture. In this research, MHEC is studied, and therefore, we provide an overview of cellulose ether, and details about the type of cellulose ether used will be given in this chapter.
After this overview, skin formation mechanisms, wetting, polymers impact and skin rheological properties will be introduced. This literature presentation is important when the results of this study are discussed, as it provides an understanding of the different properties.
Finally, we present an overview of concepts of adhesion, cohesion, and particle interactions. These interactions have a relevant impact on rheological behavior, which is one of the main properties evaluated in this thesis.
2.1.1 Adhesive mortars
2.1.1.1 Adhesive mortar system
Adhesive mortars are construction materials used to glue adhesive tiles to a substrate. The tiles and substrates can be of different types and can also be applied inside and outside of a building. Inside of a building, they can be used in bathrooms, offices, kitchen and many different types of rooms either in floor and walls. Outside of the building, they can be used in façades and in terraces. For each different environment, adhesive mortar should be adapted to have a better performance.
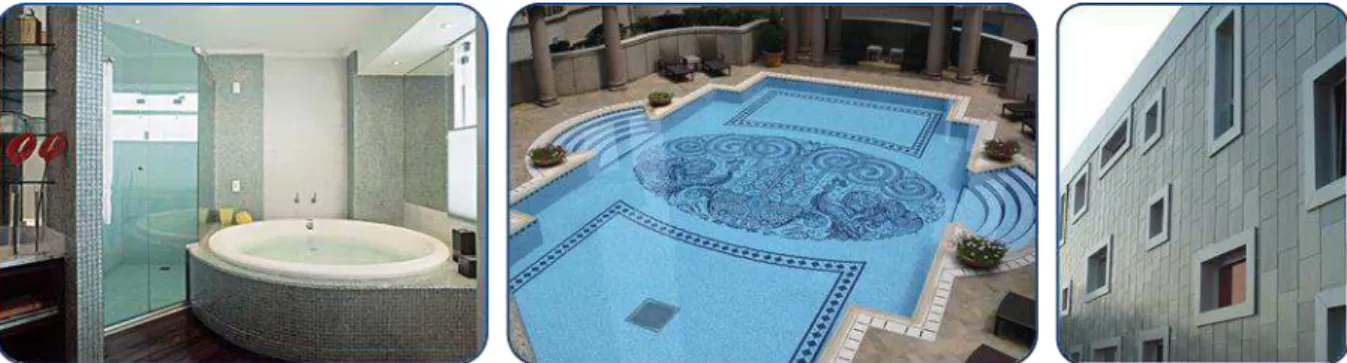
Figure 1. Examples of use of adhesive mortar system (left to right): bathroom, swimming pool, facade.
In the simplest system, the mortar is applied to a substrate where the tiles are put. They are applied with a toothed comb, so the tiles can be more easily placed.
Figure 2. Simplest adhesive mortar system: Substrate-adhesive mortar-tile.
2.1.1.2 Dry-mix adhesive mortar types
In the past, most of the adhesive mortars were produced on site, resulting in a heterogeneous and performance-varied product. With the development of construction, the necessity of industrial products grew. In France, industrial mortars started to be used around 1979-86. This “ready-to-use” industrial product came to provide constraints of costs, quality and delays. And since then, industrial mortars have increased to a huge market that provide different types of mortars.
Organic adhesives, which are non-cement based, were also developed, due to being ready to use in practical application. Today, different types of dry-mix mortars are classified depending on their application as seen in Table 2. In the following, Table 1 summarizes the main families and characteristics of commercial adhesive mortars types.
Table 1. Main families and characteristics
Family Binder
Characteristics
C1 Cement Powder
Initial tensile adhesive stress ≥ 0,5 N/mm²
Open time (after 20 min): tensile adhesive stress ≥ 0,5 N/mm²
C2 Cement + resin
Powder (mono component) or (bi component)
Initial adhesive stress ≥ 1 N/mm²
Open time (after 20 min): tensile adhesive stress ≥ 0,5 N/mm² C2S1 or C2S2 Cement + resin Powder (mono component) or powder+latex (bi component)
Initial adhesive stress ≥ 1 N/mm²
Open time (after 20 min): tensile adhesive stress ≥ 0,5 N/mm²
Deformability ≥ 2,5 mm
Table 2. Classification and designation of industrial adhesive mortar [4]
2.1.1.3 Adhesive mortars serviceability requirements
With the introduction of industrial dry-mix mortars, new serviceability requirements were also introduced to ensure minimal conditions of durability, overall stability, cracking and safety. Depending on each application requirement, adapted performance is defined. Environments that demand flexibility, resistance to inclement weather and other conditions will influence these requirements. To predict the material’s ability to attend its requirements, standard tests were introduced; though not perfect, they are able to ensure minimal quality of the products. DIN EN 12 004, which specifies the criteria for the C1 and C2 ratings (for cementitious adhesives), D1 and D2 ratings (for dispersion adhesives) and R1 and R2 (for reaction resin
2.1.1.3.1 DIN EN 12 004 Performance Requirements for Adhesives:
Cementitious mortars
C1: Normal - Tensile bond strength of ≥.5 N/mm2 when tested per ISO 13007 curing parameters, including water immersion, heat aging, and freeze-thaw cycling. Twenty-eight-day tensile adhesion bond strength ≥0.5 N/mm2 after 20 minutes open time.
C2: Improved - Tensile bond strength of 1 N /mm2 when tested per ISO 13007 curing parameters, including water immersion, heat aging, and freeze-thaw cycling. 28-day tensile adhesion bond strength ≥0.5 N/mm2 after 20 minutes open time.
Dispersion Adhesives
D1: Normal - Shear adhesion strength of ≥1 N/mm² when tested per ISO 13007 curing parameters, including heat aging. Twenty-eight-day tensile adhesion bond strength ≥0.5 N/mm2 after 20 minutes open time.
D2: Improved - D1 performance plus additional shear adhesion strength of ≥0.5 N/mm² after 21-day air cure and 7-day water immersion; also shear adhesion strength of ≥1 N/mm² at elevated temperatures.
Reaction Resin Adhesives (epoxy or polyurethane)
R1: Normal - Shear adhesion strength of ≥2 N/mm² when tested per ISO 13007 curing parameters, including water immersion. Twenty-eight-day tensile adhesion bond strength ≥0.5 N/mm2 after 20 minutes open time.
R2: Improved - R1 performance plus additional shear adhesion strength of ≥2 N/mm² after thermal shock testing.
Other requirements are applied to optional characterizes for adhesives such as: Fast-Setting/Fast-Drying, Extended Open Time, Thixotropic, Deformability and Plywood Adhesion Bond Strength.
2.1.1.3.2 Wetting standard and open time standards
Two main standards related to skin formation are the EN 1347:2007 - Adhesives for tiles — Determination of wetting capability and the EN 1346:2007 - Adhesives for tiles - determination of open time.
The EN 1347 is the European standard for adhesive for tiles to determine the wetting capability of the mortar to a tile [5]. For this test, first the adhesive is applied a thin layer of adhesive
mortar on a concrete slab with a straight edge trowel. Then, a thicker layer is applied and combed with a notched trowel. The comb should be held at an angle of approximately 60° to the substrate at a right angle to one edge of the slab and drawn across the slab parallel to that edge (in a straight line). Glass plates (10 cm X 10 cm) should then be placed on the adhesive mortar immediately and, after 10 min, 20 min and 30 min, each plate is loaded with (50 ± 0,5) N for 30 s. Care should be taken to align the adhesive ribs parallel with the edge of the glass plate, ensuring that the outer rib is flush with one edge of the glass plate. The contact surface between the combed adhesive layer and the glass plate are determined in terms of the percentage of the total area of the glass plate.
The EN 1346 is the European standard for determining the open time of adhesive mortar, evaluating the open time, by measuring the adhesive stress at 5, 20 and 30 minutes open time. For the measurements, the adhesive mortar is mixed according to EN-196-1, then it is applied with the help of a toothed comb at an angle of 45º at the standard substrate. After 5, 20 or 30 minutes of waiting time, the tiles of 5x5 cm2 are then positioned on the top of the applied mortar, and 2kg of weight are put on top of each tile for 30 seconds. For each waiting time, 10 tiles should be applied. The sample is then kept for 28 days at 23ºC and 50% RU. The days and the environmental conditions can be different depending on the specific type of test. After the 28 days, the traction test is done, and the pull-out force is measured for each tile, and from then that the pull-out strength is calculated.
2.2
Cement hydration
2.2.1 Portland cement
Cement is an inorganic or mineral binder, like lime and plaster. It is produced through the thermic transformation of its raw materials. For these materials, the binder properties are based on the chemical transformation of the chemical species present in the material, either by reaction with water or in the presence of water, obtaining consistency, originating products that have mechanical resistance. The reaction is favored by the high surface area, as they are provided as powders [6].
Cement is hydraulic binder, which means it reacts with water, and after hardening, it should resist even water action. The most common type, Portland cement, consists mainly of silicates and aluminates, and is obtained from Portland clinker grinding with the addition of calcium
depend on the used raw material. The cement industrial production process is shown in Figure 3.
The calcium sulfate (gypsum or anhydrite) addition, as will be described on the clinker phases equations, is important to avoid the “flash set” phenomenon. It occurs when one of the phases of the clinker, tricalcium aluminate, in the absence of sulfate, starts to react rapidly and exothermically to form hydrogarnet. Therefore, about 5% of calcium sulfate is added to the cement to control the setting.
Figure 3. Flow diagram of the dry process for portland cement manufacture [7].
Portland cement phases are often expressed by their abbreviations, which consists of a formula of the abbreviations of the oxides present. In Table 3 the oxides abbreviations are shown.
Table 3. Oxides abbreviations
Oxide Abbreviation Oxide Abbreviation
CaO C MgO M
SiO2 S SO3 S¯
Al2O3 A H2O H
Fe2O3 F
From these oxide abbreviations, compound abbreviation used in construction materials domain is obtained, as shown on Table 4. The hydrate is a variable composition, so it is usually called calcium silicate hydrate (C-S-H), instead of C3S2H3 or 3CaO·2SiO2·3H2O.
Table 4. Compounds abbreviations Compound Abbreviation 3CaO·SiO2 C3S 2CaO·SiO2 C2S 3CaO·Al2O3 C3A 4CaO·Al2O3·Fe2O3 C4AF 4CaO·3Al2O3·SO3 C4A3S¯ 3CaO·2SiO2·3H2O C3S2H3 CaSO4·2H2O C3S¯ H2
The main portland cement clinker phases are: Alite (C3S), Belite (C2S), aluminate (C3A) and Alumino-Ferrite (C4AF). Since cement is based on natural resources, its chemical compound is a rough approximation of the actual mineral. The high temperatures prevalent during clinker formation causes the elements present in the system, including the impurities such as magnesium, sodium, potassium, and sulfur, to combine into solid solutions with each of the major compounds of the cement in the clinker. Very small amounts of impurities in solid solution may not significantly alter the crystal structure and reactivity of a compound, but larger amounts can do so [7].
Alite is usually indicated as Ca2SiO4 (C3S). It forms distinctly hexagonal crystals. The crystal
unit cell of pure tricalcium silicate contains 27 calcium ions, 9 oxide ions and 9 orthosilicate ions. The oxide ions in its structure give its high reactivity, causing it to develop "early strength" (strength developed in mortar or concrete during the first seven days). Alite hydration is represented by the following equation:
2 Ca3SiO5 + 6 H2O → Ca3Si2O4(OH)6 + 3 Ca(OH)2, (1)
or in its abbreviated form,
C3S + 6 H2O → C-S-H + 3 Ca(OH)2. (2)
Belite is usually indicated as Ca2SiO4 (C2S). The crystal unit cell contains 8 calcium ions and
4 orthosilicate ions. Belite’s reaction with water much takes longer periods than alite, and after 28 days, only part of it is hydrated. The structure of belite in industrial cements is irregular, but the interstitial holes thus formed are much smaller, and this makes belite far less reactive than alite [7]. Belite hydration is represented by the following equation:
2 C2S + 4 H2O → C-S-H + Ca(OH)2. (4)
Aluminate or Tricalcium Aluminate, is usually indicated as Ca3Al2O6 (C3A). Aluminate has
high reactivity, which decrease for high content of substitution of alkalis. It is an interstitial phase where crystals grow to fit into the available gaps between the silicate crystals.
In the presence of calcium sulfate added to the cement, the Tricalcium Aluminate reacts to form ettringite:
Ca3Al2O6 + 3 CaSO4 + 32 H2O → Ca6Al2(SO4)3(OH)12·26H2O Ettringite
or in its abbreviated form,
C3A + 3 CaSO4 + 32 H2O → Ettringite
The final reaction of the aluminate involves slow conversion of the ettringite into "monosulfate" (AFm):
[��3(Al(��)6. 12�2O]2. (��4)3. 2�2� + 2��3��2+ 4�2� →
3[��4(Al(��)6)2. (��4).6�2O] “monosulfate”
(5)
In the absence of sulfate (if calcium sulfate is not added to the clinker) the tricalcium aluminate would react rapidly and exothermically to form hydrogarnet:
Ca3Al2O6 + 6 H2O → Ca3(Al(OH)6)2 Hydrogarnet
Tetracalcium Alumino-Ferrite, is usually indicated as approximately Ca4Al2Fe2O10 (C4Af). It is the most variable phase and can have high amounts of substitutes. Its reactivity increases as the Al/Fe is increased.
Tetracalcium Alumino-Ferrite, like tricalcium aluminate, hydrates to hydrogarnet:
��4��2��2�10+ 7�2� → ��3(��(��)6)2+ ��2�3+ ��(��)2 (6) As cement is produced from natural raw resources, a many other phases can be present, such as: free lime (CaO), Periclase (MgO), Arcanite (K2SO4), Thenardite (Na2SO4), Langbeinite (K2O.2CaO.3SO3) and Aphthitalite (3K2O.Na2O.SO3).
Different resources besides limestone can also be used to produce cement, such as slag furnace, fly ash, slag, etc. These other raw materials are used as cement additions to produce other types of cements (i.e. CP-II-F, CP-II-E, CP-IIII). In this research, the simplest type is used, CP-I, based on clinker and calcium sulfate (<5%). Two different CP-I’s are used though, with
which affects some tests, such as MRI used in this research. Cements with higher iron content, however, are more common, which is why it is still used in this research.
2.3
Mortars additives
2.3.1 General types of additives
A variety of additives exist to improve mortars to obtain desirable properties. Depending on the application, where specific behavior is desirable, different additives, mineral or organic can be used. Some additives can have multiple functions, affecting different properties of materials.
Air entraining: this type of additive is also based on surfactants, but the orientation of the
molecules determines if the effect is of plasticization or air entraining. At the air-water interface the polar groups are oriented toward the water phase lowering the surface tension, promoting bubble formation, and counteracting the tendency for the dispersed bubbles to coalesce. As illustrated on Figure 4, at the solid-water interface where directive forces exist in the cement surface, the polar groups become bound to the solid with the nonpolar groups oriented toward the water, making the cement surface hydrophobic so that air can displace water and remain attached to the solid particles as bubbles [7,8]. These effects are important when cellulose ether admixtures are discussed, since they also have an impact on bubble stabilization as associative polymers.
Figure 4. Mechanism of air entrainment when an anionic surfactant with a nonpolar hydrocarbon chain is added to the cement paste [7].
Thickener: Viscosity enhancers include mineral and polymeric additives. Mineral additives
This property is desirable for adhesive mortars, which requires high cohesiveness to hold tiles to the wall. Further details of cellulose ether mechanism and impact on cementitious materials are explored in the following sections.
Superplasticizer: This type of additive is used to avoid particle agglomeration and then
flowability. It is usually based on surfactants molecules that adsorb on particle’s surface, which generate either a physical, chemical or both types of barrier to the particles contact and interaction. This type of additive is widely known for enabling mix-design of self-compacting concretes. Also, high performance concretes, where particles packing need to be maximized, superplasticizers enable reducing entrained air, and by reducing grain friction, allow to obtain a concrete with lower liquid/solids ratio.
Accelerating admixtures: This group of accelerators consists of chemicals, which principally
influence the rate of hydration of the alite phase of Portland cement, resulting in an increase in heat evolution and C-S-H gel formation at an early age. Calorimetry can be used to demonstrate the effect of accelerators on the general hydration of Portland cement. Most are soluble salts of alkali and alkaline earth metals in which both the anion and cation contribute to the overall effect of the admixture [8].
Retarding admixtures: Similar to accelerating admixtures, retarding admixtures are used to
control cementitious materials setting. This type of admixture impedes the dissolution of the cement cations or anions, preferably that anion, which has the highest dissolving rate during the early hydration period (such as the aluminate) [7].
2.3.2 Cellulose ether (CE)
Cellulose ether has a close relation with skin formation and bibliographical review is important for comprehension of the present results in this thesis. An overview CE’s chemical properties as well as the state of art of its studies on cementitious materials is presented. Also, a smaller introduction of guar ether and starch ether is presented.
2.3.2.1 CE chemical structure
CEs are water-soluble polymers with high molecular weight derived from cellulose (consisting of a long chain of repeating anhydroglucose units) through replacement of a certain fraction of
(HPC), HydroxyPropyl Methyl Cellulose (HPMC/MHPC), Hydroxyl Ethyl Methyl Cellulose (HEMC/MHEC), etc. Fundamentally, the substitution process allows for transforming the water-insoluble cellulose into a water-soluble polymer, which can then be easily dispersed in various industrial products that comprise an aqueous phase [9,10].
The number of substituent groups on the anhydroglucose units of cellulose can be designated by weight percent or by the average number of substituent groups attached to the ring, a concept known to cellulose chemists as "degree of substitution" (DS). The number of substituent groups on the ring determines the CE properties, such as water solubility. Too low DS may generate a CE with lower water solubility, leading to additives that are only soluble in caustic solutions. Too high DS may produce additives that are soluble only in organic solvents. The degree of substitution may vary up to 3.0 since there are three available positions on each anhydroglucose unit. The kind of substitution also has an effect on the physical properties of the cellulose material [11]. The Molar substitution (MS) reports the number of moles of hydroxypropyl groups per mole of anhydroglucose [12].
Another parameter that characterizes CE is the “degree of polymerization” (DP), which is the number of monomer units in a macromolecule, polymer or oligomer molecule [13]. This number will define the length of the polymer as well as the molecular weight of the polymer. This parameter is used also to adjust the desired viscosity when solubilized; the Mark-Houwink-Sakurada equation gives the relation between intrinsic viscosity (η) and molecular weight (M) [14]:
[η] = K. ��, (7)
where α and K are Mark–Houwink parameters depending on the solvent, polymer and the environmental conditions.
2.3.2.2 Synthesis of CE
The manufacturing process of Cellulose ether (CE) undergoes different steps, summarized in Figure 6 for MHEC. Cellulose is a polyvalent alcohol and is used as the raw material, the hydroxyl groups of cellulose, however, form inter- and intramolecular hydrogen bonds, which prevent direct etherification. Thus, the cellulose goes through a process of alkalization to dissolve the H-bridges, producing the “Alkali cellulose” [15]. In Figure 5, cellulose’s chemical structure is shown.
Figure 5. Cellulose [16].
In the preparation of the alkali cellulose, caustic soda (NaOH) is usually used, typically at 18-50% concentration to penetrate between the associated cellulose chains, then break the hydrogen bond between the adjacent OH groups, and thus loosen the rigid structure. This produces an expansion of the lattice structure of the cellulose [15]. Treating the cellulose with caustic alkaline solution disrupts hydrogen bonding between and within the polymeric strands, making the majority of the hydroxyl groups available for modification, with the C2 and C6 hydroxyl sites typically more reactive than a C3 site [17].
Depending if high viscosities are desired or if the pulp has low degree of polymerization, the Alkali Cellulose can be submitted to a maturation process. This process is a controlled alkaline oxidation.
The main industrial synthesis processes of CE are the Alkylation (Williamson ether synthesis) and base-catalysed oxyalkylation. In the Williamson ether synthesis, a nucleophilic alkoxide ion reacts with an alkyl halide to give an ether and a salt [16]. For the addition of epoxides to the OH groups of cellulose, the cellulose has to be ‘opened’ also with alkalis, through base-catalysed oxyalkylation process [15].
(a) Williamson ether synthesis:
(8)
(b) Base-catalysed oxyalkylation:
(9)
Depending on the type of cellulose ether, one or the other, or the combination of both are generally used. MHEC used in this research synthesis is carried out through a reaction with methyl chloride and then a reaction with ethylene oxide [18].
After the synthesis, the product is then purified, where undesired products that are formed during the process are removed. These substances can be alcohols, alcoholates, or alkoxides, or other ethers, depending on the type of ether process. This purification varied according to the
moist products are dried and brought to the desired particle size, using appropriate methods (grinding, screening, sifting) [15,16].
Figure 6. Production of MHEC [15].
2.3.2.3 Types of CE
The commercial relevance of additives in various industries led to the development different types of cellulose ethers polymers and multifunctional additives. Advances on this type of polymer are currently occurring, with introduction of new modified versions every year. The most commonly used cellulose ethers in cementitious materials today are: methyl cellulose (MC), HydroxyPropyl Methyl Cellulose (HPMC/MHPC), Methyl Hydroxyethyl Cellulose (HEMC/MHEC) and hydroxyethyl cellulose (HEC) [19]. Some of these type’s chemical structure are illustrated on Figure 7. In this research, Methyl Hydroxyethyl Cellulose (MHEC) is used. For adhesive mortar use, it is considered an effective additive.
Figure 7. Structure of cellulose ethers: (a) HPMC, (b) MHEC, (c) HEC.[20].
2.3.2.4 CE in aqueous solution
2.3.2.4.1 Associative polymer characteristics
Cellulose ether is part of this group called “Associative polymers”, which are water-soluble polymers with pendant hydrophobic substituents that associate in water to form extended structures [21]. This ability gives these polymers interesting rheological properties [22], which is why they are often used as rheology modifiers.
Figure 8 shows various architectures of polymers that have been employed as rheology modifiers and Figure 9 shows the backbone chemical structures of some of the more common HM- polymers. Both architecture and chemical structure are a way to classify these polymers [21]. These characters control the tendency for the different types of association [23].
In aqueous solution, the hydrophobic groups form locally phase-separated entities which resemble micelles. For individual polymer molecules to associate into networks, they must contain at least two hydrophobic substituents so that the polymer backbone can form bridges between micelles [21]. They have the tendency to associate with each other to minimize the surface of contact with water [23,24].
Figure 8. Representative architectures for polymers which undergo intermolecular association in aqueous solution [21].
The association model can be influenced not only by the polymer characteristics, but also by external factors, such as pH, ionic force, temperature, concentration, shear and other additives. In an association network, there may be weak interactions that may be broken depending on the test conditions, as temperature or shear rate for example [23].
Figure 9. Representative chemical structures for polymers which undergo intermolecular association in aqueous solution. Note that for several of the structures (e.g. the polysaccharide) only part of the structure suggesting the
attachment sites of the hydrophobes is indicated [21].
2.3.2.4.2 Solubility
Etherification causes transfer of the water-insoluble cellulose into a swellable to completely water-soluble derivative. For the properties of the cellulose ethers – especially their solubility – the following factors are relevant [15,25]:
• Type and size of the substituents
• Uniformity of substitution: statistical distribution (uniform and eve) or block-wise distribution (irregular and uneven). The more evenly distributed the substituents are, the lower the degree of substitution for which a specific solubility of the cellulose ether is achieved
• Degree of substation (DS) • Molar substitution (MS) • Degree of polymerization (DP)
Besides the polymer characteristics, external factors also will influence solubility, as the temperature, pH, etc. Studies have demonstrated that increase of salinity generates a reduction of solubility, while surfactants have the opposite impact [26].
2.3.2.4.3 Rheological behavior
MHEC are in the family of Methyl Cellulose (MC) family. The solution behavior of the nonionic MC is markedly different from that of the ionic types; the effect of pH is especially reduced, and the temperature-dependent rheology is much more complex. When dissolved in water these gums give clear, smooth-flowing solutions that are pseudoplastic and nonthixotropic [16,27]. Molecular weight, concentration, temperature and the presence of other solutes can also affect rheology of a CE aqueous solution.
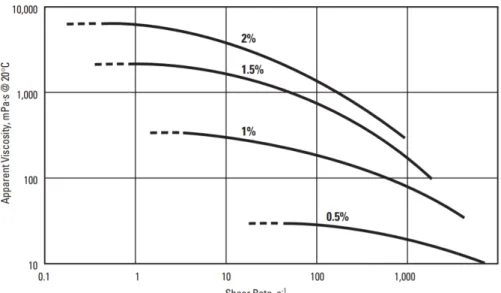
Cellulose ethers, as many other associative polymers have a characteristic polymeric behavior with appearing to be Newtonian in the very low shear rates [12,23]. This behavior can be observed in Figure 10, with different nominal viscosities MHECs at 2% concentration. The pseudoplastic behavior of MC is a function of molecular weight, with MC of higher molecular weight exhibiting greater pseudoplasticity [16]. This pseudoplastic behavior is related to the reduction of the viscosity, consequence of the destructuration of the associative network and an orientation of the polymeric chains in the direction of the shear [23].
Figure 10. Apparent Viscosity vs. Shear Rate, 2% aqueous solutions of an MHEC of different nominal viscosities [12].
Figure 11. Apparent Viscosity vs. Shear Rate, for Aqueous Solutions of 4,000 mPa.s CE at different concentrations
2.3.2.4.4 Gelation of CE
MC and HPMC behave inversely to the classic gel formers gelatine and κ-carrageenans. At room temperature, there is a viscous solution that gels (‘flocculates’) upon heating and then, upon cooling, reverts 100% reversibly back into the viscous state. Figure 12 shows the behavior of methylated cellulose ethers during heating and cooling [15]. The mortars are at the stage 1 of the curve.
Bulk thermal gelation is primarily caused by a hydrophobic interaction between molecules containing methoxyl groups. In a solution state at lower temperatures, molecules are hydrated and there is little polymer-to-polymer interaction other than simple entanglement. As the temperature is increased, the polymers gradually lose their water of hydration, and viscosity decreases. When the gel point is reached, sufficient dehydration of the polymer occurs to cause polymer-to-polymer association, and the solution begins to gel. Gel strength continues to build as the temperature is held above the gel point. When the solution is cooled, the gel effect begins to reverse, and viscosity drops rapidly. Finally, the viscosity of the cooling solution merges with the original heating curve and increases as the temperature decreases. Once the solution has cooled, the viscosity is the same as it was originally. Thus, the thermal gelation process is reversible [12].
Figure 12. Temperature-dependent viscosity and gelation of methylcellulose [15].
The gelation temperature is controlled and influenced by the following factors: type and level of substitution; concentration of CE; total solid content in the system; type of solvent and presence of additives that influence gelation point [15].
2.3.2.5 CE in cementitious materials
In construction, CE is used in mortars as thickening and water retaining agents [28]. Due to its surfactant behavior, it also influences air entrainment and air-voids stabilization. The addition of CE in mortars is important in adhesive mortars, to improve workability, guarantee stickiness and extend open time. Air-entrainment and bubble stabilization can improve workability and efficiency. Its thickening effect improves tackiness and stickiness, so the tile and the substrate work well when attached during a fresh state [29]. The water retaining effect is important to maintain enough water for hydration and allow longer open times (time between the mortar spreading and tile application where good adhesive properties are obtained). In this section, the main impact of CE on cementitious materials will be presented.
2.3.2.5.1 Rheological impact
Cellulose ether is as an associative polymer, and in solution, it has the ability to form a network and keep water physically connected, avoiding its mobility and, consequently, reducing its exudation, segregation and ionic transport [30]. This viscosity increases the effect of water
with many different substances. Using them to their “full potential” requires resolution of many of the issues of general interest to the scientific community [21].
CEs mode of action can be classified in three categories [30]:
(1) Adsorption: The long-chain polymer molecules adhesive to the periphery of water molecules, thus adsorbing and fixing part of the mix water and thereby expanding. This increases the viscosity of the mix water and that of the cement-based product.
(2) Association: Molecules in adjacent polymer chains can develop attractive forces, thus further blocking the motion of water, causing a gel formation and an increase in viscosity.
(3) Intertwining: At low rates of shear, and especially at high concentrations, the polymer chains can intertwine and entangle, resulting in an increase in the apparent viscosity. Such entanglement can disaggregate, and the polymer chains can align in the direction of the flow at high shear rates, hence resulting in shear thinning.
2.3.2.5.2 Effect on water retention
Cementitious materials mechanical strength is mainly obtained by cement hydration. Losing water in the system may result in anhydrate cement that will not react, with a direct consequence on its mechanical properties. Water retention is a mortar property that prevents the rapid loss of water to the substrate by suction. This property avoids bleeding or “water loss” when the mortar is in contact with relatively permeable surfaces. They are also important to reduce segregation [20].
By solubilizing CE, interstitial solution’s viscosity increases, affecting its mobility to be absorbed by the substrate or migrate to the surface, influencing the water evaporation. Depending on the CE nature, MHEC and MHPC have stronger water retaining effect in comparison to HEC [20]. This can be related to the slower dissolution speed and associative mechanism smaller of HEC, therefore, smaller impact over the viscosity of the media [23]. Pourchez considered two hypotheses: (i) a rheological effect similar to those produced by other polysaccharides; (ii) an effect that could be inherent to cellulose ethers, such as a modification of the porous network in the fresh state, osmotic pressure, or the presence of a cellulose ether film playing the role of diffusion barrier [31]. Jenni et al. [1] observed film formation that may play an important role on water retention.
Patural et al [20] demonstrated that the molecular weight is crucial to control water retention and mortar consistency. Also, molecular weight improved water retention; on the contrary, the
The particle’s size has also a small impact over the water retention, and the smaller the particle’s size, the more water retention increases. The reduction of particle size allows a faster dissolution of CE, and thus, for the same mixing, a higher concentration of polymer will be solubilized [32].
2.3.2.5.3 Effect on hydration
One of the main disadvantages of CE is its impact on cement hydration. This is related to the adsorption ability of the polymer over the cement particles [23]. CE adsorption on the clinker phases inhibits the growth of portlandite [33]. CE strongly effects C-S-H precipitation, leading to a decrease in the amount of initial S-H nuclei, delaying the formation of a continuous C-S-H shell around the C3S grain, and finally delaying the formation of a thicker and more permeable hydrated calcium silicate layer. When CE is added, a gradual reduction of C3A dissolution rate is observed; this is also associated with ettringite and calcium hydroaluminate precipitation [19].
HEC induces a stronger adsorption on calcium hydroaluminates and a longer C3A hydration delay than does HPMC [9]. The lower the content of methoxyl groups, the larger will be the retardation of cement setting time [19]. Thus, DS is a key parameter that governs the delay of precipitation of portlandite. The Degree of etherification has a higher impact on solubility and water absorption, while the molecular weight on the mechanical properties [34].
2.3.3 Other polysaccharides admixtures: guar ether and starch ether
In this section, other polysaccharides admixtures used in cementitious materials are introduced. Guar ether and starch ether, like cellulose ether, are natural resources used as thickeners. Commercially available admixtures are often a combination of different polymers and additions and can also have multiple functions. Some manufactures produce additives that can combine cellulose with starch, guar and other polysaccharides to obtain higher performing additives.
2.3.3.1 Guar ether
Guar ether is a polymer admixture derived from guar gum. It is a thickener admixture commonly applied in food industry and others (cosmetics, paper manufacturing, cementitious materials, coatings) [23]. Guar gum is a high molecular weight, hydrophilic, non-ionic natural polysaccharide extracted from the endospermic seed of Cyamopsis tetragonolobus. Guar gum
of mannose to galactose units ranges from 1.6:1 to 1.8:1 apparently due to climate variation [36].
Figure 13. Molecular structure of Guar gum [37].
The most common guar derivate admixtures in constructions materials are the Hydroxypropyl guars (HPGs). They are obtained from the original guar gum via an irreversible nucleophilic substitution, using propylene oxide in the presence of an alkaline catalyst. Thanks to its branched-chain structure and the numerous hydroxyl groups, guar gum exhibits a high chemical reactivity and is soluble in cold water [35].
Depending on gum purity and method of isolation, guar gums may contain as much as 10-14% insoluble residue. This “residue” is not desirable for commercial applications. Additionally, its molecules have a tendency to aggregate mainly due to intermolecular hydrogen bonding [36]. For this matter some attempts to produce low-residue derivatives of guar gum have been developed. Treatment of guar with ethylene oxide, propylene oxide, and chloroacetic acid in an alkaline medium results in the formation of hydroxyethyl guar, hydroxypropyl guar, and carboxymethylguar, respectively [36].
Figure 14. Molecular structure of HydroxyPropyl Guar [35].
The same parameters such as molar substitution (MS) and degree of substitution (DS) also apply to guar ethers. Cheng et al. studied the intermolecular interactions of hydropropil guar solutions, evaluating the different MS levels on the solution properties. The study’s experiments
![Figure 3. Flow diagram of the dry process for portland cement manufacture [7].](https://thumb-eu.123doks.com/thumbv2/123doknet/14675412.557839/28.892.111.787.323.745/figure-flow-diagram-dry-process-portland-cement-manufacture.webp)
![Figure 8. Representative architectures for polymers which undergo intermolecular association in aqueous solution [21]](https://thumb-eu.123doks.com/thumbv2/123doknet/14675412.557839/37.892.264.630.104.518/figure-representative-architectures-polymers-undergo-intermolecular-association-solution.webp)
![Figure 19. Simplified model of process of polymer film formation on cement hydrates [56]](https://thumb-eu.123doks.com/thumbv2/123doknet/14675412.557839/52.892.278.618.106.401/figure-simplified-model-process-polymer-formation-cement-hydrates.webp)
![Figure 20. Scheme for illustrating skinning mechanism. Abbreviations: �̇ - evaporation rate; �́ - flow rate of mortar water [2]](https://thumb-eu.123doks.com/thumbv2/123doknet/14675412.557839/54.892.223.672.107.336/figure-scheme-illustrating-skinning-mechanism-abbreviations-evaporation-mortar.webp)
![Figure 23. Schematic synthesis of the mortar evolution. The nonlinear horizontal time axis highlights the major stages of the mortar evolution [1]](https://thumb-eu.123doks.com/thumbv2/123doknet/14675412.557839/56.892.120.767.110.710/figure-schematic-synthesis-evolution-nonlinear-horizontal-highlights-evolution.webp)
![Figure 26. Micro-rheological intrusion-force diagram of an adhesive mortar for different waiting times (0-60 min) [61]](https://thumb-eu.123doks.com/thumbv2/123doknet/14675412.557839/58.892.109.783.463.763/figure-micro-rheological-intrusion-diagram-adhesive-different-waiting.webp)
![Figure 27. Plate/plate rheological response of a CE based mortar at 20min(a) and at 30min(b), Yield evaluation on shear stress response [19]](https://thumb-eu.123doks.com/thumbv2/123doknet/14675412.557839/59.892.220.665.119.642/figure-plate-rheological-response-mortar-yield-evaluation-response.webp)
