HAL Id: inserm-00318497
https://www.hal.inserm.fr/inserm-00318497
Submitted on 4 Jan 2010
HAL is a multi-disciplinary open access archive for the deposit and dissemination of sci-entific research documents, whether they are pub-lished or not. The documents may come from teaching and research institutions in France or abroad, or from public or private research centers.
L’archive ouverte pluridisciplinaire HAL, est destinée au dépôt et à la diffusion de documents scientifiques de niveau recherche, publiés ou non, émanant des établissements d’enseignement et de recherche français ou étrangers, des laboratoires publics ou privés.
Association between maternal seafood consumption
before pregnancy and fetal growth: evidence for an
association in overweight women. The EDEN
mother-child cohort.
Peggy Drouillet, Monique Kaminski, Blandine de Lauzon-Guillain, Anne
Forhan, Pierre Ducimetière, Michel Schweitzer, Guillaume Magnin, Valérie
Goua, Olivier Thiébaugeorges, Marie-Aline Charles
To cite this version:
Peggy Drouillet, Monique Kaminski, Blandine de Lauzon-Guillain, Anne Forhan, Pierre Ducimetière, et al.. Association between maternal seafood consumption before pregnancy and fetal growth: evidence for an association in overweight women. The EDEN mother-child cohort.. Paediatric and Perinatal Epidemiology, Wiley, 2009, 23 (1), pp.76-86. �10.1111/j.1365-3016.2008.00982.x�. �inserm-00318497�
Association between maternal seafood consumption before pregnancy and fetal growth: evidence for an association in overweight women. The “EDEN mother-child” cohort (study of pre and early postnatal determinants of the child’s development and health)
Ms Peggy Drouillet1,2,3*, Ms Monique Kaminski2,4,5, Ms Blandine De Lauzon-Guillain1,2,3, Ms Anne Forhan1,2,3, M Pierre Ducimetière1,2,3, Prof Michel Schweitzer6, Prof Guillaume Magnin7, Dr Valérie Goua7, Dr Olivier Thiébaugeorges6, Dr. Marie-Aline Charles1,2,3
Authors’ affiliations
1 INSERM, Unit 780, Villejuif, France 2 IFR69, Villejuif, France
3Univ Paris-Sud, Orsay, France 4 INSERM, Unit 149, Villejuif, France 5Univ Paris-VI, Paris, France
6 Regional maternity, University Hospital of Nancy, France
7 Gynaecology and obstetric department, University Hospital of Poitiers, France
*Correspondance: Peggy Drouillet
16 avenue Paul Vaillant Couturier. 94807 Villejuif cedex. France Telephone: 33 1 45 59 60 52 / FAX: 33 1 47 26 94 54
SUMMARY
Studies, in countries with high seafood consumption, suggested its benefit on fetal growth and child development. The objective of our study was to determine the association between seafood consumption in French pregnant women and fetal growth. Pregnant women included in the EDEN mother-child cohort study completed two food frequency questionnaires on their usual diet in the year before and during the last three months of pregnancy (n=1805). Fetal circumferences were measured by ultrasound, and anthropometry at birth. Variables were compared across tertiles of the mother’s seafood consumption by multiple linear regressions adjusted for confounding variables. Analyses were stratified according to maternal overweight because of interaction (p<0.01). As results, there was no association between seafood intake and fetal growth in the whole sample of women. For overweight women (n=464), a higher consumption before pregnancy was associated with higher fetal biparietal and abdominal circumferences and anthropometric measures. From the lowest to the highest tertiles, mean birthweight was 167g higher (p=0.002). No significant association was found with consumption at the end of pregnancy. In conclusion, high seafood consumption before pregnancy is positively associated with fetal growth in overweight women. Follow-up of the infants may help determine potential beneficial consequences for the child’s health and development.
Abbreviations (p)BMI: (pre-pregnancy) Body Mass Index WA: Weeks of Amenorrhea
FFQ(s): Food Frequency Questionnaire(s) FA(s): Fatty Acid(s)
INTRODUCTION
A high intake of marine fat rich in long-chain n-3 Fatty Acids (FAs) is associated with an increase in birthweight in humans.(1) In both epidemiologic(2-7) and intervention studies,(8-10) mainly performed in women from Denmark and the Faroe Islands, intake of fish or marine n-3 FAs by pregnant women increased birthweight by both prolonging duration of pregnancy and increasing fetal growth rate. Marine fat has been shown to reduce the risk of pre-term delivery(11, 12) and intrauterine growth retardation.(13) Several mechanisms have been suggested for this association. The first one is a delayed spontaneous delivery, resulting from altered balance between the prostaglandins involved in the initiation of labour.(1) Indeed n-3 FAs may decrease the endogenous production of arachidonic acid-derived eicosanoids such as prostaglandins PGF2α and PGE2.(14) The second one is an increased fetal growth rate, resulting from improved placental blood flow due to lowered thromboxane/prostacyclin ratio(15) and blood viscosity.(5)
Beside birthweight, neonatal head circumference has been positively related to fish intake. In a fishing community, Thorsdottir et al.(16) found that newborns of women consuming less fish and fish oil had a smaller head circumference than those of women consuming higher levels. Studies from other parts of the world (USA, …) did not find such association between fish consumption and birth size,(17) or even found an inverse relationship between seafood intake during pregnancy and fetal growth.(18) A randomised controlled trial,(19) including women with a low dietary fish intake, did not find any differences in spontaneous delivery between fish oil supplemented and control groups. Thus, the role of maternal seafood consumption on fetal growth remains controversial.
Several studies found relations between maternal body mass index (BMI) and fetal growth (20-22) and maternal BMI may be associated with difference in food intake. Nevertheless, studies
interested in the association between seafood and/or marine n-3 FA and fetal growth did not take into account potential influence of overweight in this relation.
In the context of the well established association between smaller size at birth and adult metabolic and cardiovascular risk, the investigation of nutritional factors potentially affecting fetal growth in humans is warranted.(23-26)
The aim of the present study was therefore to explore the relationship between seafood consumption before and during pregnancy and fetal growth in a French population, with a particular care to the potential effect of maternal overweight on this relation.
METHODS
Population and study design
Pregnant women seen for a prenatal visit at the departments of Obstetrics and Gynaecology of the University Hospitals of Nancy and Poitiers before 24 weeks of amenorrhea (WA) were invited to participate. Enrolment started in 2003 in February in Poitiers and September in Nancy, lasted 27 months in each center and ended up in the inclusion of 2002 women (969 in Poitiers, 1033 in Nancy). Exclusion criteria were twin pregnancies, known diabetes before pregnancy, not being able to speak and read French, planned moving away from the region. Among women who fulfilled these inclusion criteria, 55% agreed to participate.
The study was approved by the Ethic Committee of the Bicêtre Hospital. Written consents were obtained from the mother for herself at inclusion and for her newborn child after delivery.
Standard ultrasound fetal measurements were recorded from routine examinations performed between 20-24 and 30-34 WA. Measurements included head, biparietal and abdominal circumferences and femur length. All ultrasound examinations were performed by a limited number of specialists who standardised procedures before the study.
At a visit performed between 24-28 WA by midwives research assistants, maternal height was measured with a wall Seca 206 stadiometer (Hamburg, Germany) to the nearest 0.2cm and maternal weight was measured using electronic Terraillon SL 351 scales (Hanson Ltd, UK) to the nearest 0.1kg. Skinfolds were measured using a commercial Harpenden caliper (Chasmor Ltd, London, UK) three times in the following order: tricipital (posterior aspect of the arm, at midpoint between the acromion and the olecranon), bicipital (anterior aspect of the arm, at midpoint between the acromion and the olecranon), subscapular (1cm below the lower angle at the scapula) and supra-iliac (1cm over the iliac crest, at the midaxillary line). After a five minute rest, three measures of systolic and diastolic blood pressures were performed at two-minute intervals with an Omron M4I device (Omron Healthcare Europe, Hoofddorp, The Netherlands). Women came to the examination in a fasting state and received a 50g glucose load. Glucose concentrations were measured on fasting and one hour after challenge. Weight before pregnancy, educational level and smoking habits during pregnancy were obtained by interview. Prepregnancy body mass index (pBMI) was computed as reported weight (kg) / measured height squared (m²). According to references of the International Obesity Task Force, overweight was defined as a BMI of 25kg/m² and above and obesity as a BMI of 30kg/m² and above.
A second visit was performed by the same research assistants 1.8 days (range 0-16) after delivery. Mother’s weight and skinfolds were obtained with the same protocol as above. Several anthropometric measurements were performed on the newborn. Circumferences were measured to the nearest 0.1cm in duplicate using a tape: left arm circumference measured at
midpoint between the acromion and the olecranon; left wrist circumference measured at the level of the styloid processes of the radius and ulna; head circumference measured at the largest occipitofrontal circumference. Skinfolds were measured in triplicate using a commercial Holtain caliper (Chasmor Ltd, London, UK)) in the following order: tricipital skinfold measured at the same level as the midarm circumference; subscapular skinfold measured at the lower angle of the scapula - It has been shown that in neonates, the sum of skinfolds is well correlated with fat mass as measured by Dual-Energy X-Ray.(27)
Gestational age at delivery (determined from the date of the last menstrual period and early ultrasound assessment), birthweight, recumbent length and weight on the day of the post-partum examination, placental weight (in Poitiers only) were extracted from clinical record. In the two obstetric departments, electronic Seca scales (Hamburg, Germany: Seca 737 in Nancy and Seca 335 in Poitiers) were used to measure infant weight and wooden somatometer (Testut, Béthune, France) to measure length.
Large- and Small-for-gestational age neonates were defined as babies with a birthweight respectively over the 90th percentile and below the 10th percentile of French gestational age and gender specific reference curves.(28)
Dietary assessment
Mothers completed two food frequency questionnaires (FFQs) similar to the questionnaire developed for the French population in the Fleurbaix-Laventie Ville Santé Study.(29) This FFQ has been validated against a series of 24 hour recalls.(30) The questionnaire used in the EDEN Study is very close to that of the FLVS Study with the addition of some questions for a more specific assessment of the intake of fish and trophallergic foods, foods rich in folates, n-3 FAs
and vitamin A. It inquires about the intake of 137 different foods or food groups with a 7-item scale ranking from never to more than once a day.
The first-trimester FFQ (completed at recruitment) concerned the usual diet during the year before pregnancy; the second FFQ (completed in the first few days following delivery) investigated food intake during the last three months of pregnancy. Six questions inquired about seafood consumption. They were “At which frequency did you eat”: 1) fresh or frozen fish (bought unprocessed); 2) oily fish; 3) smoked or salted fish; 4) breaded fish; 5) dishes containing fish; 6) shellfish. We combined responses to the six questions and generated an average frequency of seafood servings per month for each woman, by weighing each frequency with the midpoint of the category (i.e. 2 for the category 1-3 servings/month). To calculate energy and nutrient intakes, we multiplied, for each food, the intake frequency by the nutrient composition for a portion size. Portion sizes were determined using pictures for 12 food types (meat, French fries, pasta, vegetables, cakes, cheese) on a three level scale or were standard portions for the French adult population for other food types.(31) We then summed contributions across all foods to obtain total intake of energy and various macro- and micronutrients. Food composition was obtained from the SU.VI.MAX. nutrient composition database(32) which is based on a French nutrient composition database(33) and on US department of Agriculture publications; it is continually incremented by other published sources and personal communications from laboratories and manufacturers.(34-36) Energy and nutrient intakes were not estimated when more than 3 items of the FFQ were missing. Moreover, these estimations were not taken into account when total energy intake was under 1000 kcal/day or over 5000 kcal/day.
To study the hypothesis that other food frequently eaten by seafood eaters, could confound the studied relationship, dietary patterns were identified in a principal component analysis performed on the 33 food groups created from the 137 items of the FFQ.
Variable description and statistical analyses
The mean frequency of monthly seafood servings was compared between centers by Student’s t test. Relationships between socio-demographic characteristics of women and seafood consumption were studied by linear regressions adjusted for center and mother’s age. To study relationships between seafood consumption and fetal growth, we divided women into approximate tertiles according to their average seafood consumption (tertile 1 < once a week / tertile 3 > twice a week) (the number of women reporting no consumption of seafood was too small to be analysed separately. However, analyses were run with and without including these women). Fetal growth was characterized by anthropometric measures at birth and ultrasound measures. Relationships between seafood consumption and these variables were studied by multiple linear regressions adjusted for center, mother’s age, smoking habits, height, parity, gestational age, newborn’s sex; variables were compared across tertiles of the mother’s seafood consumption. Moreover risks of large- and small-for-gestational age newborns were studied according to seafood intake by logistic regression. Separate analyses were performed for seafood intake before pregnancy and during the last three months of pregnancy. Interaction terms between seafood consumption, before and in the last three months of pregnancy and gestational age (p=0.08 and 0.26 respectively), maternal BMI before pregnancy (p=0.003 and 0.38 respectively), average number of cigarettes smoked per day during pregnancy (p=0.47 and 0.31 respectively) and maternal educational level (p=0.11 and 0.67 respectively) were estimated for birthweight. Several adjustments for educational level, maternal food consumptions (energy and lipid intakes, alcohol intake, dietary pattern, vitamins and/or minerals supplementation), and maternal health (systolic/diastolic arterial pressure, fasting plasma glucose and triglycerides) were also performed.
RESULTS
Subjects characteristics
Data at birth were available for 1896 women out of 2002 included in the study because mainly of women who decided to stop the study, women lost for follow-up and miscarriages or fetal deaths. Analyses included 1805 women who completed the two FFQs and for whom seafood consumption was assessed (67 not included because of at least one missing FFQ, 13 for missing data on seafood consumption). Women for whom time between delivery and clinical exam were spaced from more than 7 days were not included also (n=11). The main characteristics of included women (and their newborns), compared with the 91 excluded ones, are shown in Table 1. Mean maternal age was 29 years (range 17-45), whereas excluded women were slightly younger. This latter group had less often reached a university level and were more often single. Among included women, mean pBMI was 23kg/m², 10.1% had a pBMI < 18.5kg/m², 17.5% were overweight and 8.3% were obese.
Mean birthweight of the offspring of included women was 3284g. The average frequency of seafood intake before pregnancy was 8.5 times/month. The most frequently consumed fish was white fish (60%). A reduction in the seafood consumption was observed over time falling to 8.2 times/month during the last three months of pregnancy (p=0.09). This was mainly due to a decrease in the intake of shellfish.
Sociodemographic characteristics of women and seafood consumption before pregnancy
Seafood consumption was higher with age by 13% per decade (p=0.0003). Overweight women ate less seafood than the others (7.9 vs. 8.7 times/month; p=0.05). Women with a
university level ate seafood more often than the others (9.0 vs. 7.9 times/month; p=0.001). Income level was also associated with seafood intake, with a higher consumption for women whose household’s income was higher than 3,000 Euros/month compared to women with lower income (9.4 vs. 8.1 times/month; p=0.003). Women living alone ate seafood more often than the others (9.6 vs. 8.4 times/month; p=0.07). Seafood consumption was not significantly lower in women who had smoked at some point of the pregnancy than in women who had never smoked during their pregnancy (p=0.40), but decreased when the number of cigarettes smoked increased (p=0.13). Seafood intake did not differ according to the season when the dietary assessment was made (p=0.58). Seafood and alcohol consumptions were positively associated (p=0.003). Women who were supplemented with vitamins and/or minerals ate seafood more often (9.0 vs. 8.3 times/month; p=0.07).
All these relationships were also observed for seafood consumption during the last three months of pregnancy, except for those with vitamins and mineral supplementation and for alcohol consumption.
Seafood consumption and fetal growth
There was no relationship between seafood intake and newborn anthropometric, as well as ultrasound measures in the whole sample of women (Table 2). However, maternal overweight before pregnancy modified the relationship between seafood consumption and several outcomes (for birthweight and others newborn anthropometric variables: p for interaction < 0.01).
Mean birthweight was significantly greater with higher seafood consumption in overweight women whereas this relation was not observed in non-overweight women (Figure 1). Because
maternal overweight was identified as a factor of interaction, results are given separately for women with a pBMI < and > 25kg/m².
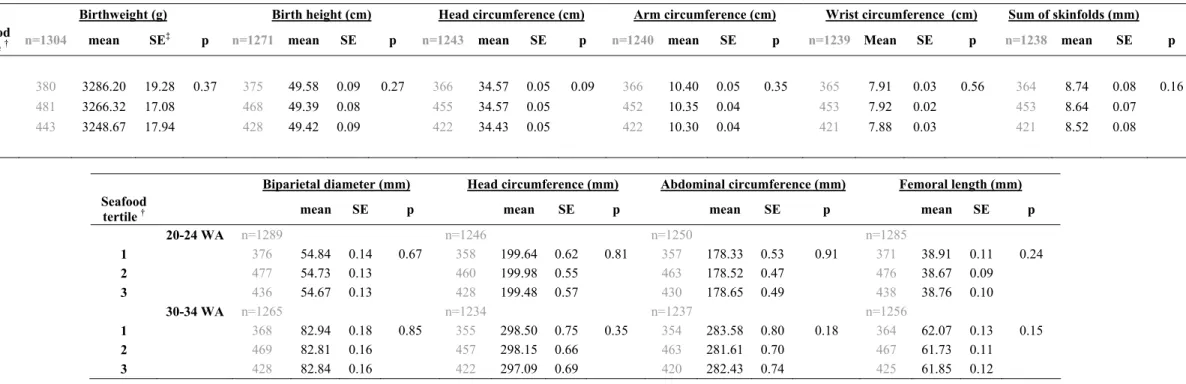
In non-overweight women, fetal growth was not associated with seafood consumption prior to pregnancy (Table 3A, Table 4, Table 5); whereas in overweight women, fetal growth was significantly associated with seafood consumption prior to pregnancy. In a first regression model adjusted for confounding variables, seafood consumption was considered with tertiles. In overweight women, a difference in pre-pregnancy seafood consumption from less than five times to more than nine times/month was associated with on average an increase in birthweight of 5.1%, height of 1.4%, head circumference of 1.3%, arm circumference of 4.4% and wrist circumference of 3.2% (Table 3B). Moreover, the sum of skinfolds was also greater, a mean difference of 8.0% was observed between the two extreme tertiles. After adjustment for maternal educational level or household’s income, results remained unchanged: mean birthweight between low and high tertiles of seafood intake was 171 (5.3%) after adjustment for educational level.
A subsequent adjustment for total energy, lipid or alcohol intakes did not change the measures of association (Data not shown). One dietary pattern identified by principal component analysis was characterized by a high intake of fruit, vegetables, whole grain, and seafood and a low intake of food rich in fats and sugar. Spearman correlation between seafood consumption and the score for this pattern derived from the principal component analysis was 0.31 (p<0.0001). This pattern was associated with newborn anthropometry with the same trend as for seafood consumption (data not shown). When the model was adjusted for the pattern score, seafood consumption remained associated with newborn anthropometry whereas the pattern score was no longer significant. Mean birthweight difference between low and high tertiles of seafood intake was 163g (4.8%).
After further adjustments for maternal vitamins and/or minerals supplementation and for systolic or diastolic arterial pressure, fasting plasma glucose and triglycerides (at 6th month of pregnancy) or number of days between birth and measurements for those not performed at birth these associations remained unchanged: when all these variables were included in the model, the average birthweight difference between the lowest and highest tertiles of seafood consumption was 206g (6.3%), compared to 167g in the model without these additional adjustments (data not shown).
For ultrasound measures (Table 3B), between the first and the third tertiles of seafood consumption, abdominal circumference was 2.2% larger and head circumference 1.2% larger at 20-24 WA. At 30-34 WA, these observations followed the same trend but were not significant. However, similar observation was made for the biparietal diameter with a difference of 1.3% between the two extreme tertiles. No other significant association was found.
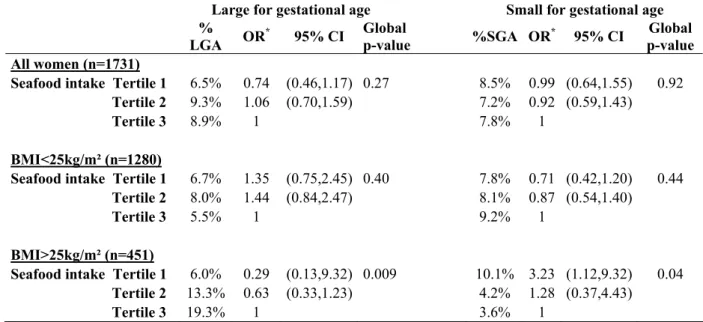
Furthermore, risks for large-or small-for-gestational age neonates did not vary according to seafood intake in all women or in non-overweight women (Table 5). In overweight women, the risk for small-for-gestational age neonates increased with decreasing seafood intake (OR=3.23 between tertile 1 and tertile 3, p=0.04), while the risk of large-for-gestational age neonates decreased (OR=0.29, p=0.009).
Results remained unchanged when shellfish were not taken into account, but relationships were less strong. Mean birthweight difference between low and high tertiles was 157g (4.8%;
from the analyses, results were unchanged: the increase in BW between the two extreme tertiles of seafood consumption was 170g (5.2%; p=0.002).
No association was found between seafood intake and placental weight or length of gestation (data not shown). No statistically significant associations were found in non-overweight women.
DISCUSSION
In the French “EDEN mother-child” cohort, higher consumption of seafood before pregnancy was associated with greater fetal growth, in overweight women only. This relation included birthweight, height, head, arm and wrist circumferences and sum of skinfolds, with a similar trend for some ultrasound measures. Several other epidemiologic studies have shown that intake of fish or marine n-3 FAs by pregnant women is associated with an increase in birthweight occurring through both an increase in duration of pregnancy and fetal growth rate.(7, 37, 38) An increase in head circumference was also noted by Odent et al.(39) and Thorsdottir et al..(16) Several previously published studies demonstrated a heavier placenta(5) and a longer gestation(11, 12) among women who consumed more fish but we did not observe these associations.
However in these studies mainly performed in population with high all fish and shellfish intake, the observation was not limited to overweight women. This may be due to higher seafood consumption than that observed in our study. In the intervention study by Olsen et al. the level of n-3 FA intake was 6.1g/day in the intervention group vs. 2.7g/day in the control group, whereas in our study estimated mean intake was 1.2g/day.
Another difference lies in the fact that our study focused on seafood whereas many of the studies were often interested in fish or fish oil intake only.(7, 37, 38) In our study, results were unchanged when shellfish were not taken into account, but relationships were less strong.
Results found in subgroups analyses must be taken with caution because they are more prone to false positive errors. No study reported before an interaction between seafood intake and mother’s overweight status for fetal growth. One study found an association between seafood
intake and birthweight only in non-smokers.(5) The interaction with smoking was tested and found non significant in our study. .
There may be however some biological explanation for an association stronger with higher mother’s fat mass. A regular intake of fish before pregnancy may be associated with variations in the FAs composition stored in the adipose tissue. Overweight women have an enhanced ability to release FAs from adipose tissue to sustain fetal growth. The assumption of a role of stored FAs in the relationship seafood consumption and fetal growth is reinforced by the fact that seafood consumption before pregnancy is more strongly associated with fetal growth than consumption during the last three months of pregnancy. The storage of long chain polyunsaturated FAs and the balance of the n-3 and n-6 families in maternal adipose tissue is of great importance since it is a reserve of these FAs for the developing foetus;(40-43) they are among the materials required for fetal brain, nervous system and retinal growth.(44) All of the n-6 and n-3 FAs accumulated by the foetus are derived by transfer across the placenta, which is provided with a specific system to ensure this function. Placental FAs transfer involves diffusion as well as membrane and cytosolic FA binding proteins; membrane binding proteins that favour n-6 and n-3 FAs over non-essential FAs and arachidonic and docosahexaenoic acid over linoleic and α-linolenic acid may be important in facilitating placental transfer of the latter longer chain n-6 and n-3 FAs to the fetus. The substrate of the placenta is provided by the maternal diet and the high rate of mobilization from maternal adipose stores.
Our study is not based on a representative sample which may limit the applicability of the results to whole population. Compared to a national perinatal survey performed in 2003 on a representative sample of French women after delivery,(45) the 55% of eligible women who agreed to participate in the EDEN study had similar age, proportion of unmarried couples,
birthweight of the offspring, prematurity rate but had a higher frequency of university level (53 vs 43 %).
In conclusion, our study shows a relationship between maternal seafood intake and fetal growth in the French population, which seems to be specific to overweight women. We suggest that the enrichment in long chain n-3 FAs in the maternal adipose tissue stored before conception is a possible mediator of this relationship.
ACKNOWLEDGMENTS
We are indebted to the participating families, to the midwife research assistants (L Douhaud, S Bedel, B Lortholary, S Gabriel, M Rogeon, M Malinbaum) for data collection and to P Lavoine for checking, coding and data entry.
We acknowledge all the funding sources for the EDEN study: Fondation pour la Recherche Médicale (FRM), French Ministry of Research: IFR program, INSERM Nutrition Research Program, French Ministry of Health Perinatality Program, French Agency for Environment Security (AFFSET), French National Institute for Population Health Surveillance (INVS), Paris–Sud University, French National Institute for Health Education (INPES), Nestlé, Mutuelle Générale de l’Education Nationale (MGEN), French speaking association for the study of diabetes and metabolism (Alfediam), National Agency for Research (ANR non thematic program)
REFERENCES
1. Olsen SF, Hansen HS, Sorensen TI, et al. Intake of marine fat, rich in (n-3)-polyunsaturated fatty acids, may increase birthweight by prolonging gestation. Lancet 1986;2:367-9.
2. Olsen SF, Hansen HS, Sommer S, et al. Gestational age in relation to marine n-3 fatty acids in maternal erythrocytes: a study of women in the Faroe Islands and Denmark. Am J Obstet Gynecol 1991;164:1203-9.
3. Harper V, MacInnes R, Campbell D, Hall M. Increased birth weight in northerly islands: is fish consumption a red herring? Bmj 1991;303:166.
4. Olsen SF, Hansen HS, Jensen B, Sorensen TI. Pregnancy duration and the ratio of long-chain n-3 fatty acids to arachidonic acid in erythrocytes from Faroese women. J Intern Med Suppl 1989;731:185-9.
5. Olsen SF, Olsen J, Frische G. Does fish consumption during pregnancy increase fetal growth? A study of the size of the newborn, placental weight and gestational age in relation to fish consumption during pregnancy. Int J Epidemiol 1990;19:971-7.
6. Olsen SF, Grandjean P, Weihe P, Videro T. Frequency of seafood intake in pregnancy as a determinant of birth weight: evidence for a dose dependent relationship. J Epidemiol Community Health 1993;47:436-40.
7. Olsen SF, Osterdal ML, Salvig JD, et al. Duration of pregnancy in relation to seafood intake during early and mid pregnancy: prospective cohort. Eur J Epidemiol 2006;21:749-58.
8. Olsen SF, Sorensen JD, Secher NJ, et al. Randomised controlled trial of effect of fish-oil supplementation on pregnancy duration. Lancet 1992;339:1003-7.
9. Olsen SF, Secher NJ. A possible preventive effect of low-dose fish oil on early delivery and pre-eclampsia: indications from a 50-year-old controlled trial. Br J Nutr 1990;64:599-609.
10. Olsen SF, Soorensen JD, Secher NJ, et al. [Fish oil supplementation and duration of pregnancy. A randomized controlled trial]. Ugeskr Laeger 1994;156:1302-7.
11. Olsen SF, Secher NJ, Tabor A, Weber T, Walker JJ, Gluud C. Randomised clinical trials of fish oil supplementation in high risk pregnancies. Fish Oil Trials In Pregnancy (FOTIP) Team. Bjog 2000;107:382-95.
12. Olsen SF, Secher NJ. Low consumption of seafood in early pregnancy as a risk factor for preterm delivery: prospective cohort study. Bmj 2002;324:447.
13. Rogers I, Emmett P, Ness A, Golding J. Maternal fish intake in late pregnancy and the frequency of low birth weight and intrauterine growth retardation in a cohort of British infants. J Epidemiol Community Health 2004;58:486-92.
14. Hansen HS, Olsen SF. Dietary (n-3)-fatty acids, prostaglandins, and prolonged gestation in humans. Prog Clin Biol Res 1988;282:305-17.
15. Andersen HJ, Andersen LF, Fuchs AR. Diet, pre-eclampsia, and intrauterine growth retardation. Lancet 1989;1:1146.
16. Thorsdottir I, Birgisdottir BE, Halldorsdottir S, Geirsson RT. Association of fish and fish liver oil intake in pregnancy with infant size at birth among women of normal weight before pregnancy in a fishing community. Am J Epidemiol 2004;160:460-5. 17. Buck GM, Tee GP, Fitzgerald EF, et al. Maternal fish consumption and infant birth
18. Oken E, Kleinman KP, Olsen SF, Rich-Edwards JW, Gillman MW. Associations of seafood and elongated n-3 fatty acid intake with fetal growth and length of gestation: results from a US pregnancy cohort. Am J Epidemiol 2004;160:774-83.
19. Knudsen VK, Hansen HS, Osterdal ML, Mikkelsen TB, Mu H, Olsen SF. Fish oil in various doses or flax oil in pregnancy and timing of spontaneous delivery: a randomised controlled trial. Bjog 2006;113:536-43.
20. Cogswell ME, Yip R. The influence of fetal and maternal factors on the distribution of birthweight. Semin Perinatol 1995;19:222-40.
21. Clausen T, Burski TK, Oyen N, Godang K, Bollerslev J, Henriksen T. Maternal anthropometric and metabolic factors in the first half of pregnancy and risk of neonatal macrosomia in term pregnancies. A prospective study. Eur J Endocrinol 2005;153:887-94.
22. Fiala JE, Egan JF, Lashgari M. The influence of body mass index on pregnancy outcomes. Conn Med 2006;70:21-3.
23. Gunnarsdottir I, Birgisdottir BE, Thorsdottir I, Gudnason V, Benediktsson R. Size at birth and coronary artery disease in a population with high birth weight. Am J Clin Nutr 2002;76:1290-4.
24. Gunnarsdottir I, Birgisdottir BE, Benediktsson R, Gudnason V, Thorsdottir I. Relationship between size at birth and hypertension in a genetically homogeneous population of high birth weight. J Hypertens 2002;20:623-8.
25. Birgisdottir BE, Gunnarsdottir I, Thorsdottir I, Gudnason V, Benediktsson R. Size at birth and glucose intolerance in a relatively genetically homogeneous, high-birth weight population. Am J Clin Nutr 2002;76:399-403.
26. de Boo HA, Harding JE. The developmental origins of adult disease (Barker) hypothesis. Aust N Z J Obstet Gynaecol 2006;46:4-14.
27. Koo WW, Walters JC, Hockman EM. Body composition in neonates: relationship between measured and derived anthropometry with dual-energy X-ray absorptiometry measurements. Pediatr Res 2004;56:694-700.
28. Mamelle N, Munoz F, Grandjean H. [Fetal growth from the AUDIPOG study. I. Establishment of reference curves]. J Gynecol Obstet Biol Reprod (Paris) 1996;25:61-70.
29. de Lauzon B, Romon M, Deschamps V, et al. The Three-Factor Eating Questionnaire-R18 is able to distinguish among different eating patterns in a general population. J Nutr 2004;134:2372-80.
30. Deschamps V, de Lauzon-Guillain B, Lafay L, Borys J, Charles M, Romon M. Reproducibility and relative validity of a Food Frequency Questionnaire among French adults and adolescents. European Journal of Clinical Nutrition 2007.
31. SU.VI.MAX. Portions alimentaires - Manuel photos pour l'estimation des quantités. Economica ed. Paris, 2002.
32. SU.VI.MAX. Table de composition des aliments. INSERM Economica ed. Paris, 2006.
33. Favier J, Ireland-Ripert J, Toque C, Feinberg M. Répertoire général des aliments, table de composition, 2ème édition. Paris, 1995.
34. Ireland J, Favier J, Feinberg M, CIQUAL. Répertoire général des aliments, table de composition. Tome 2, Produits laitiers. Paris, 2002.
35. US Department of Agriculture, service AR. USDA National Nutrient Database for Standard Reference, 2003.
36. Ministry of Agriculture FaF. Fatty acids. Supplement to McCance & Woddowson's The Composition of Foods. Cambridge, Royal Society of Chemistry, 1998.
37. Olsen SF. Consumption of marine n-3 fatty acids during pregnancy as a possible determinant of birth weight. A review of the current epidemiologic evidence. Epidemiol Rev 1993;15:399-413.
38. Olsen SF, Secher NJ, Bjornsson S, Weber T, Atke A. The potential benefits of using fish oil in relation to preterm labor: the case for a randomized controlled trial? Acta Obstet Gynecol Scand 2003;82:978-82.
39. Odent MR, McMillan L, Kimmel T. Prenatal care and sea fish. Eur J Obstet Gynecol Reprod Biol 1996;68:49-51.
40. Haggarty P. Effect of placental function on fatty acid requirements during pregnancy. Eur J Clin Nutr 2004;58:1559-70.
41. Dutta-Roy AK. Transport mechanisms for long-chain polyunsaturated fatty acids in the human placenta. Am J Clin Nutr 2000;71:315S-22S.
42. Haggarty P. Placental regulation of fatty acid delivery and its effect on fetal growth--a review. Placenta 2002;23 Suppl A:S28-38.
43. Innis SM. Essential fatty acid transfer and fetal development. Placenta 2005;26 Suppl A:S70-5.
44. McCann JC, Ames BN. Is docosahexaenoic acid, an n-3 long-chain polyunsaturated fatty acid, required for development of normal brain function? An overview of evidence from cognitive and behavioral tests in humans and animals. Am J Clin Nutr 2005;82:281-95.
45. Blondel B, Supernant K, Du Mazaubrun C, Breart G. [Trends in perinatal health in metropolitan France between 1995 and 2003: results from the National Perinatal Surveys]. J Gynecol Obstet Biol Reprod (Paris) 2006;35:373-87.
Table 1 Maternal and neonatal characteristics of the cohort (n=1896) Mean (SE) or % Included (n=1805) Not included (n=91) p (t test) Mothers Age (years) 29.1 (4.9) 27.0 (5.0) <0.0001 Height (m) 1.64 (0.06) 1.63 (0.06) 0.15 Prepregnant BMI (kg/m²) 23.2 (4.5) 23.6 (5.5) 0.42 Overweight (%) 26.2% 27.6% 0.78 Centre (% Poitiers) 49.4% 45.1% 0.42 University Level 53% 42% 0.03 Income >3000€/month (%) 27.4% 19.8% 0.11 Multipara 55% 55% 0.97 Single 7% 14% 0.02
Smoking during pregnancy 26% 32% 0.21
Intakes
Seafood(1) (times/month) 8.5 (7.3)
Seafood(2) (times/month) 8.2 (7.4) Total energy intake(1) (kcal/d) * 2303.6 (769.5) Total energy intake(2) (kcal/d) * 2376.5 (778.1) Total lipid intake(1) (g/d) * 97.7 (39.8)
Total lipid intake(2) (g/d) * 104.1 (41.0)
Alcohol intake(1) (g/d) * 7.6 (15.2)
Alcohol intake(2) (g/d) * 1.4 (4.1)
Newborn
Males (%) 52.6% 51.1% 0.79
Gestational length (weeks) 39.3 (1.7) 38.8 (2.3) 0.03
Birthweight (g) * 3284.0 (507.6) 3167.0 (602.6) 0.04
Birth length (cm) 49.6 (2.3) 49.1 (2.7) 0.06
Placental weight (g) † 546.7 (122.0) 540.7 (151.6) 0.77
(1) Intakes before pregnancy, (2) Intakes in the last three months of pregnancy
* Only for women whom nutrient intakes has been estimated (n=1601)
Table 2 Newborn anthropometric and ultrasound measures at 20-24 and 30-34 WA according to average seafood intake per month before pregnancy in the EDEN Study (n=1805) *
Birthweight (g) Birth height (cm) Head circumference (cm) Arm circumference (cm) Wrist circumference (cm) Sum of skinfolds (mm) Seafood
tertile † n=1802 d mean*Adjuste SE‡ p n=1755 mean SE p n=1712 mean SE p n=1709 mean SE p n=1707 mean SE p n=1704 mean SE p
1 563 3269.70 16.53 0.56 555 49.54 0.08 0.54 545 34.53 0.05 0.30 545 10.36 0.04 0.56 543 7.89 0.02 0.32 542 8.67 0.07 0.49
2 642 3292.43 15.40 626 49.51 0.07 606 34.62 0.04 603 10.40 0.04 604 7.92 0.02 602 8.79 0.07
3 597 3289.95 16.04 574 49.62 0.08 561 34.56 0.05 561 10.41 0.04 560 7.93 0.02 560 8.71 0.07
Biparietal diameter (mm) Head circumference (mm) Abdominal circumference (mm) Femoral length (mm) Seafood
tertile † mean SE p mean SE p mean SE p mean SE p
20-24 WA n=1780 n=1719 n=1729 n=1770 1 555 54.66 0.12 0.79 528 199.37 0.50 0.40 532 178.19 0.45 0.09 550 38.89 0.09 0.56 2 637 54.75 0.11 614 200.30 0.46 616 178.65 0.41 634 38.77 0.08 3 588 54.65 0.11 577 199.91 0.47 581 179.53 0.43 586 38.87 0.09 30-34 WA n=1743 n=1706 n=1710 n=1733 1 548 82.69 0.16 0.50 533 298.12 0.64 0.56 532 283.79 0.67 0.38 544 62.07 0.11 0.17 2 621 82.84 0.15 607 298.31 0.60 614 282.70 0.62 618 61.81 0.10 3 574 82.95 0.15 566 297.42 0.62 564 283.79 0.65 571 62.04 0.11
* Model: adjusted for center, mother's age and height, smoking habits, parity, gestational age (at birth or at ultrasound assessment) and newborn's sex
†
Tertile 1: [0 - 5[ times a month / Tertile 2: [5 - 9[ times a month / Tertile 3: > 9 times a month ‡ Standard Error
Table 3A Newborn anthropometric and ultrasound measures at 20-24 and 30-34 WA according to average seafood intake per month before pregnancy in non-overweight women in the EDEN Study (n=1306) *
Birthweight (g) Birth height (cm) Head circumference (cm) Arm circumference (cm) Wrist circumference (cm) Sum of skinfolds (mm) Seafood
tertile † n=1304 mean SE‡ p n=1271 mean SE p n=1243 mean SE p n=1240 mean SE p n=1239 Mean SE p n=1238 mean SE p
1 380 3286.20 19.28 0.37 375 49.58 0.09 0.27 366 34.57 0.05 0.09 366 10.40 0.05 0.35 365 7.91 0.03 0.56 364 8.74 0.08 0.16
2 481 3266.32 17.08 468 49.39 0.08 455 34.57 0.05 452 10.35 0.04 453 7.92 0.02 453 8.64 0.07
3 443 3248.67 17.94 428 49.42 0.09 422 34.43 0.05 422 10.30 0.04 421 7.88 0.03 421 8.52 0.08
Biparietal diameter (mm) Head circumference (mm) Abdominal circumference (mm) Femoral length (mm) Seafood
tertile † mean SE p mean SE p mean SE p mean SE p
20-24 WA n=1289 n=1246 n=1250 n=1285 1 376 54.84 0.14 0.67 358 199.64 0.62 0.81 357 178.33 0.53 0.91 371 38.91 0.11 0.24 2 477 54.73 0.13 460 199.98 0.55 463 178.52 0.47 476 38.67 0.09 3 436 54.67 0.13 428 199.48 0.57 430 178.65 0.49 438 38.76 0.10 30-34 WA n=1265 n=1234 n=1237 n=1256 1 368 82.94 0.18 0.85 355 298.50 0.75 0.35 354 283.58 0.80 0.18 364 62.07 0.13 0.15 2 469 82.81 0.16 457 298.15 0.66 463 281.61 0.70 467 61.73 0.11 3 428 82.84 0.16 422 297.09 0.69 420 282.43 0.74 425 61.85 0.12
* Model: adjusted for center, mother's age and height, smoking habits, parity, gestational age (at birth or at ultrasound assessment) and newborn's sex
†
Tertile 1: [0 - 5[ times a month / Tertile 2: [5 - 9[ times a month / Tertile 3: > 9 times a month ‡ Standard Error
Table 3B Newborn anthropometric and ultrasound measures at 20-24 and 30-34 WA according to average seafood intake per month before pregnancy in overweight women in the EDEN Study (n=464) *
Birthweight (g) Birth height (cm) Head circumference (cm) Arm circumference (cm) Wrist circumference (cm) Sum of skinfolds (mm) Seafood
tertile † n=464 mean SE‡ p n=464 mean SE p n=464 mean SE p n=464 mean SE p n=464 mean SE p n=464 mean SE p
1 173 3250.20 31.87 0.002 170 49.53 0.15 0.009 169 34.51 0.09 0.004 169 10.30 0.07 0.0001 168 7.84 0.04 0.0002 168 8.62 0.13 0.001
2 149 3359.40 34.29 147 49.82 0.16 140 34.74 0.10 140 10.51 0.08 140 7.91 0.04 138 9.18 0.15
3 142 3416.74 34.92 135 50.22 0.17 129 34.95 0.10 129 10.75 0.08 129 8.09 0.05 129 9.31 0.15
Biparietal diameter (mm) Head circumference (mm) Abdominal circumference (mm) Femoral length (mm) Seafood
tertile † mean SE p mean SE p mean SE p mean SE p
20-24 WA n=457 n=439 n=446 n=452 1 169 54.23 0.21 0.17 160 198.93 0.77 0.06 165 178.07 0.84 0.004 170 38.90 0.16 0.44 2 148 54.81 0.22 142 201.20 0.81 142 178.98 0.90 146 39.04 0.17 3 140 54.60 0.23 137 201.25 0.83 139 182.10 0.90 136 39.21 0.18 30-34 WA n=444 n=444 n=444 n=444 1 169 82.14 0.33 0.06 167 297.68 1.24 0.89 167 284.95 1.24 0.23 169 62.14 0.20 0.17 2 140 83.02 0.36 139 298.46 1.35 140 285.53 1.34 139 62.05 0.22 3 135 83.24 0.36 133 298.00 1.37 133 288.02 1.37 135 62.59 0.22
* Model: adjusted for center, mother's age and height, smoking habits, parity, gestational age (at birth or at ultrasound assessment) and newborn's sex
†
Tertile 1: [0 - 5[ times a month / Tertile 2: [5 - 9[ times a month / Tertile 3: > 9 times a month ‡ Standard Error
Table 4 Mean birthweight according to average seafood intake per month before pregnancy separately in non-overweight and overweight women in the EDEN Study (n=1770)*
BMI < 25 kg/m² (n=1306) BMI > 25 kg/m² (n=464) β† 95% CIs Global p-value β† 95% CIs Global p-value Seafood tertile † 1 37.53 [-14.51; 89.57] 0.37 -166.54 [-260.15; -72.93] 0.002 2 17.66 [-31.03; 66.35] -57.34 [-153.42; 38.74] 3 0 0 Centre (Nancy/Poitiers) -45.54 [-87.07; -4.01] 0.03 18,14 [-58.71; 94.99] 0.64
Mother’s age (years) -3.70 [-8.48; 1.08] 0.13 7.91 [-0,75; 16.57] 0.07
Mother’s height (m) 13.81 [10.34; 17.28] <0.0001 9.66 [3.90; 15.42] 0.001
Smoking habits (n) -20.56 [-26.73; -14.39] <0.0001 -8.08 [-18.62; 2.46] 0.13
Parity (n) 63.27 [38.52; 88.02] <0.0001 52.64 [13.01; 92.27] 0.01
Gestational age (WG) 180.57 [168.38; 192.76] <0.0001 167.56 [146.59; 188.53] <0.0001
Newborn’s sex (Female vs. Male) -127.19 [-168.02; -86.36] <0.0001 -161.56 [-237.61; -85.51] <0.0001 * Adjusted for center, mother's age and height, smoking habits (average number of cigarettes smoked during
pregnancy), parity (number of previous pregnancies), gestational age (weeks of gestation) and newborn's sex
†
Table 5 Seafood intake before pregnancy in relation to risks of Large- and Small-for-Gestational Age neonates (LGA and SGA) in the EDEN Study (n=1731)
Large for gestational age Small for gestational age
%
LGA OR* 95% CI Global p-value %SGA OR* 95% CI p-value Global All women (n=1731)
Seafood intake Tertile 1 6.5% 0.74 (0.46,1.17) 0.27 8.5% 0.99 (0.64,1.55) 0.92
Tertile 2 9.3% 1.06 (0.70,1.59) 7.2% 0.92 (0.59,1.43)
Tertile 3 8.9% 1 7.8% 1
BMI<25kg/m² (n=1280)
Seafood intake Tertile 1 6.7% 1.35 (0.75,2.45) 0.40 7.8% 0.71 (0.42,1.20) 0.44
Tertile 2 8.0% 1.44 (0.84,2.47) 8.1% 0.87 (0.54,1.40)
Tertile 3 5.5% 1 9.2% 1
BMI>25kg/m² (n=451)
Seafood intake Tertile 1 6.0% 0.29 (0.13,9.32) 0.009 10.1% 3.23 (1.12,9.32) 0.04
Tertile 2 13.3% 0.63 (0.33,1.23) 4.2% 1.28 (0.37,4.43)
Tertile 3 19.3% 1 3.6% 1
* Odds Ratios adjusted for center, mother's age and height, smoking habits, parity, gestational age and newborn's sex
Figure 1 Mean birthweight and average seafood consumption per week, according to maternal BMI. The EDEN study.
3100 3200 3300 3400 3500
< 1 time/week [1-2] times/week > 2 times/week
Seafood consumption
BMI < 25 kg/m²; p for trend = 0.37 BMI > 25 kg/m²; p for trend = 0.002
Birthweight (g ) p for interaction : p=0.003 3100 3200 3300 3400 3500 1 2 3