HAL Id: hal-03030065
https://hal.archives-ouvertes.fr/hal-03030065
Submitted on 5 Dec 2020
HAL is a multi-disciplinary open access
archive for the deposit and dissemination of
sci-entific research documents, whether they are
pub-lished or not. The documents may come from
teaching and research institutions in France or
L’archive ouverte pluridisciplinaire HAL, est
destinée au dépôt et à la diffusion de documents
scientifiques de niveau recherche, publiés ou non,
émanant des établissements d’enseignement et de
recherche français ou étrangers, des laboratoires
Learning urban capabilities from behaviours. A focus on
visitors values for urban planning
Giovanna Fancello, Alexis Tsoukias
To cite this version:
Giovanna Fancello, Alexis Tsoukias.
Learning urban capabilities from behaviours.
A focus on
visitors values for urban planning. Socio-Economic Planning Sciences, Elsevier, 2020, pp.100969.
�10.1016/j.seps.2020.100969�. �hal-03030065�
Learning urban capabilities from behaviours. A focus on visitors values for
urban planning.
Giovanna Fancelloa,∗∗, Alexis Tsoukiàsa
aLAMSADE, PSL University, CNRS, Paris Dauphine, Place du Maréchal de Lattre de Tassigny,75016, Paris, FR
Abstract
Evaluating environmental resources such as urban and territorial opportunities means understanding their value. Monetary values are not always suitable to synthesize the opportunity that such resources give to the development of individuals in urban space. We propose a spatial multi-criteria analysis method oriented to analyse values that individuals give to different urban and territorial opportunities within a capability approach framework. We analyse visitors’ behaviour in space and we learn their urban capabilities considering the values they give to environmental resources and assets. In order to learn such values we use a multi-attribute value measurement method. Furthermore, we define groups of people with similar values of urban opportunities and with similar relevant urban capabilities. This consents to design more legitimated policies aimed to expand the set of relevant capabilities for a given population target. The method is experimented and illustrated with a case study of urban planning for the city of Alghero. Keywords: Policy analytics, spatial multi-criteria analysis, Capability Approach, Multi-attribute Value Theory, visitors
1. Introduction
There exist resources for which we cannot define an economic value. There might be several reasons for that. Public and common goods (Ostrom, 2015), for example, may not have an economic value representing their characteristics of exclusion and subtractability. There may be no observable market for these resources and there is no proxy which can be used as a substitute that fully explains their value. Besides, even when
5
an economic value might be observable, such a value might not be our principal aim.
Environmental resources and cultural assets are some of such goods. A real market does not exist for them, and the evaluation of their value is a well known problem in literature (Dasgupta, 2001; Haab et al., 2002; Robinson, 2001). Evaluating environmental resources, such as urban and territorial opportunities, means understanding the value of these commons for the inhabitants and the society even if this is not a
10
monetary one (Robinson, 2001). On the other side, analysing such resources is a necessary step in order to design public policies managing or implying them.
Several methods - hedonic prices, travel costs, contingent evaluation, conjoint analysis - help in the analysis of values of environmental resources considering revealed preferences or stated preferences that allow to define the demand curve of an hypothetical market. Although such methods are frequently used
15
in environmental economics in order to evaluate the impact of a project in space (Pearce, 1998), they have been criticised due to the economic vision of the space (Sen, 1995), which is not representative of the whole value of such resources and assets. They consider behaviours and preferences as explicable by normative
∗Funding: This project was supported by the PSL Research University with the Project MMAP "Measuring the maps". ∗∗Corresponding author
Present address: Sorbonne Université, INSERM, Institut Pierre Louis d’Épidémiologie et de Santé Publique, Nemesis research team, F (75012), Paris, France
models that look at people as rational consumers choosing to do something because of an hypothetical or imaginative economic return. Such a consumer is a standard one, acting just following economic rationality
20
principles. All such methods are unable to determine subjective values which can be associated to individuals leaving or using a given space or territory. With reference to such critiques we note Sen’s (Sen, 1995) work about environmental evaluation and social choice in which he suggests considering the individual not just as an operator in a market, but as a inhabitant that judges alternatives from a social perspective, including (among others) his wellbeing.
25
From a decision aiding perspective our issue is to establish the value for a given individual (or group of inhabitants) that such environmental goods have for their development in the society. We are not interested in a generic economic value which is representative of nothing specific (except for the ones who have a policy of giving an economic value to everything), but in the value that each individual gives to environmental assets for his wellbeing. We consider the individuals as a inhabitant, with their preferences and subjective
30
values (Keeney, 1992).
More specifically, we are interested in values in space in terms of capabilities (Nussbaum, 2005; Sen, 1999, 2009), those capabilities that people value as important, which we name "relevant capabilities". What we claim is the possibility to use the Capability Approach (Nussbaum, 2005; Sen, 1999, 2009) in order to analyse how people value environmental resources and assets in terms of urban and territorial opportunities
35
for the development of the individual capabilities in the city. The use of the capability approach in order to assess the quality of life in cities and territories is a new field of study, developed only in recent years by few studies (Blečić et al., 2015b,a, 2013; Frediani, 2015). We contribute by proposing a method analysing the individual values with respect to environmental opportunities, in terms of preference of choice of different "relevant urban capabilities".
40
According to the Capability Approach (Nussbaum, 2005; Sen, 1999, 2009), different individuals within the same territory can have different capabilities with respect to personal characteristics and contextual factors (environmental and social opportunities). Then individuals choose to develop capabilities they value as important (possible behaviours or states) in functionings (real behaviours or state). The Capability Approach suggests people should be described not by their personal characteristics or by their endowments in resources
45
or their wealthiness, but by their possible behaviour with respect (among others) to the environmental opportunities, as these behaviours capture their preferences and driving values that norm the choice of capabilities. Possible behaviours (i.e. capabilities) can be thus studied by the values that people give to environmental opportunities.
If the problem is to give a "value" to environmental resources then our idea is the following: (1)such
50
goods / assets / commons have a value for each single inhabitant in terms of opportunity for his development of wellbeing and (2) this (subjective) value can be learned observing the single inhabitant behaviour in the territory, i.e his functionings and the values that guide his choice to do and to be in space. (3) We consider that the set of value functions characterising how a single individual values a set of goods / assets / commons (in terms of opportunity) can be considered as being representative of his/her capability set. To be more
55
precise: on how this capability set is structured being the Pareto frontier of the simultaneous maximization of these functions. (4) Supposing we know the subjective value of a given good/asset/common for each single individual we can cluster the inhabitants having similar values for that precise good/asset/common. Moreover, we suppose that (5) knowing the value functions governing each single individual behaviour we can cluster the inhabitants having similar value functions, that is similar capability sets. (6) The value of
60
a given good/common/asset will then be definable only with respect to a given cluster of inhabitants and (7) the acceptability/legitimacy of a given policy (territorial policy, urban development policy) can then be checked with respect to a cluster of inhabitants for which we pursue the expansion of their capability sets.
With reference to these premises, we aim at defining groups of people with similar preferences (values) with respect to environmental resources (i.e. opportunities in space) and with similar needs, in order to
65
determine an approximation of their capability set (possible behaviours). This implies studying both peoples’ behaviours (functionings) and the values that guide their choice to do and to be in space. Evaluating values in space entails also understanding how values (preferences) are distributed in the territory in order to build maps helping in decision making.
However, even if the development of MCDM methods and of GIS services in spatial planning are know
numerous in literature, there is a lack of integration among these systems (Malczewski and Rinner, 2015; Harju et al., 2018). There is a growing need to build Multiple Criteria Spatial Decision Support Systems that consider decision makers’ values (preferences) and the spatial analysis tools of GIS services in an integrate way. This paper tries to deal with this challenge and to develop a first step in the development of a more integrated MCDM-GIS method designed to study the geography of urban capabilities (Blečić et al., 2013).
75
In the following paragraphs we first synthesised the theoretical background that guided this study, then we illustrated our method for the analysis of environmental values in space and the definition of urban capabilities for different groups of population. Finally we experimented the method, which we claim of general validity, with respect to the behaviour of a precise category of population, the visitors, and we experimentally validated it with data collected from a survey study in the territory of Alghero (Sassari,
80
Italy).
2. Theoretical background 2.1. Capability Approach
The Capability Approach (Sen, 1999, 2009) goes beyond the economic concept of wellbeing, stressing the importance of evaluating not primary goods, but substantive freedoms (named capabilities) to choose
85
a "life one has reason to value" (Sen, 1999). The concept of capability entails two components (Blečić et al., 2015b; Sen, 1999): the abilities of an individual, with respect to his personal characteristics, and the opportunities, i.e. the presence of external conditions. The individual has the capability to do or to be something if she/he has the opportunity to do or to be something and she/he is able to do it. Thus, the capability set of an individual depends both on individual and contextual conditions and commodities
90
(Figure 1). Under the capability approach, individual wellbeing is not given by the measure of resources owned by individuals, rather by the freedom people have to choose their beings and doings thanks to the conversion of such commodities and conditions in advantage for their wellbeing development.
Figure 1: Conversion process of commodities in capabilities in a particular social and personal context. Inspired by Blečić et al. (2015b); Robeyns (2005)
In that conversion process human diversity is fundamental as the notion of advantage deals with a person’s real opportunities to use commodities compared to others (Sen, 2009). The advantage that people
95
have thanks to the opportunity offered by the commodities is different for every individual. Peoples can develop different functionings (things a person has valued to do or to be) and capabilities (the combination of possible functionings) with respect to personal and socio-environmental factors (see Figure 1 for the conversion process). The same person can convert the same asset differently in different contexts, in the same way two different persons in the same place may convert the same asset in a different set of functionings.
100
For this reason, the context plays a key role in the individual development process.
The Capability approach is a theoretical framework useful for modelling different quality of life issues (health, education, food, life expectancy,. . . ) that is largely used to measure inequalities. The Alkyre-Foster (AF) method (Alkire et al., 2015) is one example of the operationalization of the Capability Approach for policy design and evaluation. This method aims to measure the multidimensional poverty counting the
different type of deprivation that individuals experience (lack of education, employment, health,. . . ). For what concerns urban issues, there was not many implementation of the capability approach. Blecic et al. Blečić et al. (2013) develop the concept of “urban capabilities” and a model to analyse the walkability in the city considering the pedestrian freedom to access by foot to urban opportunities. In his works Frediani Frediani (2015) explore the poverty process in a capability approach perspective and inquire about the role
110
of space as determinant of poverty.
Moreover, following Blečić et al. (2013, 2015b,a), we claim there is a particular set of capabilities that is influenced by urban and territorial factors and the social context named "urban capabilities". Urban capabilities depend on urban and environmental opportunities that are the contextual factors that we can modify with an urban public policy.
115
With respect to these premises, we are interested to determine peoples’ values of urban and environmental opportunities (here named named also environmental resources). These opportunities are the contextual factors that consent the development of "relevant urban capabilities": the set of "urban capabilities" that people value as important.
In our idea, each person should itself choose which capability set to develop in functioning with respect
120
to his values (Sen, 2009).Thus, the evaluation of capabilities can be considered as a multi-objective opti-mization problem in which the capability components are included in the process of choice of functionings of every inhabitant and learned from their behaviours. We suppose that urban capabilities are a set of not dominated solutions defined by the ability and opportunity components mentioned in this paragraph. Urban opportunities Ψ are analysed by considering the values z that people give to the development of
125
urban functionings, while the ability component is given by the socioeconomic characteristics of inhabitants Φ. In this perspective, the value functions z and the socioeconomic characteristics Φ represent the variables used for evaluating the urban capabilities.
In order to explain our idea we consider an individual who can spend an amount of time (720 minutes) in exploiting two urban opportunities i and j (a garden and a public library) internal to the set of urban
130
opportunities Ψ. Let’s denote with xi and xj the amount of time spent on each of the two opportunities
respectively. Consider now three welfare indicators, let’s call them culture (c), health (h) and education (e). Then we have three value functions ∈ z that map the subjective value of any amount of time to an interval scale [0, 1], here denoted with vc(x), vh(x), ve(x)such that vl: [0, 720] 7→ [0, 1] l ∈ {c, h, e}. Note that such
subjective value depend also on the personal characteristics Φ of the inhabitant analysed. Considering this
135
problem, the expected behaviour of our inhabitant should be represented by: max vc(xi) + vc(xj)
max vh(xi) + vh(xj)
max ve(xi) + ve(xj) (1)
subjet to
xj+ xj ≤ 720
In case we know the shape of these functions (for instance): - vc(x) = log(x + 1)
- vh(x) = p30x
- ve(x) = ex/360− 1
1 1.2 1.4 1.6 1 1.2 1.4 0.5 0.6 0.7 0.8 0.9 1 vc vh ve Pareto front
Figure 2: Pareto front example
0 360 720 0 0.5 1 Time(minutes) vc log(x+1) log(720+1) 0 360 720 0 0.5 1 Time(minutes) vh √ x 30 √ 720 30 0 360 720 0 0.5 1 Time(minutes) ve ex/360−1 e720/360−1
In order to be solved, such objective functions must trade-off among the time x spent on the different urban opportunities c, h, e ( culture, education, health, ...). This multi-objective problem presents a set of solutions, that are defined by the Pareto frontier of non-dominated solutions (see the Figure 2 for a graphic example). The set of non-dominated solutions defined by this frontier represents the approximation of the
145
set of urban capabilities for each individual.
We can compute the Pareto frontier for our inhabitant, that it’s the set of non dominated solutions for the system (1). Such solutions represent time allocations to the two opportunities in such a way that any improvement along one of the welfare indicators imply worsening along at least another one. In other terms there is no way to improve further and simultaneously the overall welfare of our inhabitant. Under such a
150
perspective it is safe to assume that our inhabitant will choose any among such behaviours which means that this set represents all possible functionings of this inhabitant with respect to these two urban opportunities. This is exactly what a capability set should be: the set of all possible functionings, maximising the welfare of this inhabitant, welfare subjectively evaluated.
The welfare dimensions considered for this analysis are arbitrary and supposed to be complete. Indeed,
155
if we add a new dimension, for example "leisure", the Pareto frontier will change. If we suppose that the dimensions considered are complete, then we can build the set of objective functions and the Pareto frontier for each individual by analysing his behaviour: why people do what they do? which are their objective functions?
Finally we claim that environmental opportunities valued as important by an inhabitant could be valued
160
important by other inhabitants. Equally we know that each inhabitant can be characterised by a vector of socio-economic characteristics and as such (s)he can be similar to other inhabitants. However, having similar socio-economic characteristics does not entail having the same values (and value functions) and sharing the same values does not imply having similar socio-economic characteristics.
Designing a public policy means designing a reallocation of public resources (and/or access to commons)
165
in order to pursue a political objective (such as improving the life of a group of inhabitants, the ones targeted by that policy). That said, our claim is that the effectiveness and the legitimacy of a policy should be measured not with respect to the reallocation of endowments, but with respect to the (subjective) satisfaction of aspirations offering more and better opportunities. Under such a perspective the target of a public policy should be inhabitants valuing similarly such opportunities that can be converted in capabilities.
170
In other terms if the new policy consists in expanding green areas, the target of the policy are not only the inhabitants lacking access to such areas, but the ones who either already appreciate accessing such areas or the ones who will appreciate this opportunity (once available) although today they do not do it. This last group is essentially revealed through the construction of its relevant capabilities set.
Clustering the inhabitants according both to their socio-economic characteristics and their capabilities
175
sets (measured through their subjective value functions) allows to identify targets of public policies who will positively appreciate such a policy and legitimate it. On the other hand it is the time for policy makers to state explicitly who are the inhabitants benefiting from a certain public policy and how. Being able to associate policies to inhabitants and their capabilities sets allows to pursue exactly such a purpose. Our proposal, thus, should be viewed as a tool helping policy makers or relevant stakeholders to design policies
180
or to argue against them, on the basis of the inhabitants included (or excluded) by any given policy and to explain why.
2.2. Urban and Environmental assets
Urban and environmental assets are relevant for a given target population with reference to the oppor-tunities they offer for the development of capabilities. The freedom to access to urban and environmental
185
opportunities consents to live and act in the city and to practice the right to the city (Harvey, 2003) im-proving people’s urban quality of life (Blečić et al., 2015a). Therefore, the quality and characteristics of the environmental opportunities are determinant for a given population.
Moreover, environmental opportunities are the only components of urban capabilities that we can modify with a project. People can convert urban opportunities into capabilities considering the advantages they
190
may obtain. What is important is the presence and access to opportunities, besides what people can do with such opportunities. For example, the presence and accessibility to a park may influence the development of the "capability to recreate in the city". However, it is important also the quality of the opportunity: if the park is equipped with areas where children can play safely. These characteristics can expand or limit the capability set of a population with reference to the level of advantage they give for development.
195
Another element we need to consider when we talk about environmental opportunities is the spatial dimension that influences the assessment of such assets. The assessment of the same urban opportunity is different in two different spaces. A change in space entails a change in the final evaluation of the alternatives (the urban opportunities) offered by the city. Actually, the city is a system with numerous relations that we need to consider in order to understand the phenomena that influence the development of people’s quality
200
of life. Moreover, the spatial dimension is fundamental in order to unveil the urban and environmental (in)justices (Soja, 2010) and to design public policies following such analysis. Malczewski and Rinner (2015) discuss the importance of considering the spatial dimension in the definition of GIS systems integrated with MCDA (multi-criteria decision aiding) methods.
Considering the spatial dimension and unveiling the environmental (in)justices in the city helps the
205
policy maker to design new shapes of such assets. The urban project can be used in order to modify the characteristics of the environmental assets in order to modify the advantage for a group of people. More precisely, we can modify the quality of the assets and the resources in order to enrich the possibility of people to choose to act and be in the city. This consents to enlarge people’s capability set. For example, a
public policy can be focused to improve the access to urban opportunities designing new spatial elements
210
for people with reduced mobility. This entails the enlargement or the change of the set of urban capabilities for disabled people. Furthermore, a policy can focus on healthy ageing and on the implementation of all those opportunities that encourage elderly people to act and socialize in the city by planning high quality neighbourhood with leisure activities and walkable paths. Similarly, a policy oriented to children wellbeing will be one interested in the development of the autonomy of movement in the city by designing safe and
215
playable pedestrian paths.
These urban and environmental opportunities can therefore be redesigned considering people abilities and advantages to use such assets. That is what different groups of people can do with such assets. This consents to have public policies more legitimated and oriented to the enlargement of people capabilities. 2.3. Measuring Values
220
If we want to learn about values we need to measure them. We need to learn subjective values (for a given target population or for an observed one). We may also need to learn values in order to be able to cluster the population in groups with “similar” values.
Subjective values can be measured through formal and well established procedures (Raiffa, 1969; Rescher, 1969). Measurement of subjective values is an appropriate way to learn about peoples’ preferences in all
225
such cases where markets either do not exist (markets being a potential revelator of preferences) or because the notion of market simply does not fit (Ostrom, 2015).
We make the hypothesis that values can be measured upon a number of separable and independent attributes. Separability means that the set of chosen attributes is strictly necessary and sufficient in order to be able to describe revealed preferences. Less attributes leave the description incomplete and more attributes
230
are redundant ant thus potentially biasing (Keeney and Raiffa, 1976; Roy and Vincke, 1981). Independent attributes mean that preferences expressed along one attribute are independent from preferences expressed on any other attribute or subset of attributes.
If the above hypothesis is accepted then we can use MAVT (Multi-attribute value theory) (Keeney and Raiffa, 1976; von Winterfeldt and Edwards, 1986) and more precisely we can accept that values can be
235
measured using additive value functions.
Multi-attribute value theory enables to score each alternative with respect to a function that represents the subjective difference of values on an interval scale (for a given decision maker or user) (Keeney and Raiffa, 1976). Multi-attribute value theory is a method representing preferences, but also a way to measure preferences in terms of their intensities (how much A is better than B?). This is a unique feature since it
240
allows to compare decision makers with respect to their values. This unique feature allows us to generate groups of people with similar values. This value-based information helps to design and plan public policies with respect to what inhabitants and stakeholders appreciate. Moreover, this decision analytic methodology consents to measure individual preferences in non-monetary terms, fostering its use for the analysis of environmental values (the reader interested in similar case studies can see Ananda and Herath (2003);
245
Beinat (1997); Ferretti et al. (2014); Martin et al. (2000)).
That said, the practical problem is how to learn and construct such functions. What we really know are observations of direct or indirect preference statements which are revealed through the real behaviour of an observed population. Moreover, when we deal with a public policy it is impossible to interview all inhabitants, even if we are interested in all their preferences. For this reason we claim that holistic or indirect
250
methods of construction of value functions (Beinat, 1997) are more useful in analysing values of environmental opportunities in space and unveil the desirability of a possible set of future public policies. The holistic or indirect strategy is based on overall value judgements of multi-attribute profiles and a successive estimation of the marginal value function with fitting techniques (regression models, ...). It is a representation of the set of preferences and values that the decision maker uses to make a choice. For this reason we are going to use
255
methods which "learn" the value functions out of examples of actual observed choice behaviour (preference learning). Given our hypothesis allowing the existence of separable and additive value functions, we are going to use a precise class of "disaggregation methods" ((Jacquet-Lagrèze and Siskos, 2001)) the archetype of which are the UTA methods (Siskos et al., 2016).
2.4. The UTA method
260
Our purpose is to experiment how to learn value functions. Our experiment has been conducted using the multiattribute value method named UTA+ (Kostkowski and Slowinski, 1996), a well known method based on the preference disaggregation approach. We estimate value functions from holistic or indirect judgements deducted observing people’s behaviour. This method consents to investigate indirectly large sets of preferences considering at the same time behaviours or judgments and allows to obtain easily interpretable
265
results.
The UTA method was originally proposed by Jaquet-Lagreze and Siskos (Jacquet-Lagrèze and Siskos, 1982) and then developed in different forms (Siskos et al., 2005). The method builds a set of additive value functions from a ranking on a reference set A given by the decision maker. It uses linear programming in order to estimate the family of the utility functions with the minimum possible error and to compute the
270
optimal set of functions as consistent as possible with the given preferences. The reader should note that our choice presents some limitations.
• The hypothesis that the subjective values of each inhabitant are representable through a set of separable additive value functions is reasonable, but “arbitrary”. Other forms of value functions and models could fit (possibly better) the observable behaviour.
275
• The set of value functions “explaining” the observable behaviour is infinite under affine transformations of such functions.
However, for the purpose of this paper our choice is sufficiently reasonable. What we want to show is that given an observable behaviour of the inhabitants with respect to environmental opportunities it is possible to learn a value model explaining this behaviour and allowing to construct a “measure” of their capability
280
sets, thus allowing a more fine clustering of the population. The precise value model chosen here is simple and straightforward and allows to show exactly our purpose, but other models could do the same.
The criteria aggregation model in UTA is an additive value function (Jacquet-Lagrèze and Siskos, 1982): u(g) =
n
X
i=1
p1ui(gi) (2)
where ui , i = 1, 2, . . . , n are non-decreasing real valued functions, named marginal value or utility
functions, which are normalized between 0 and 1, and and pi represent the trade-offs among the criteria.
This method was used in decision aiding for different multi-criteria problems and in the environmental
285
field for the evaluation of projects (the interested reader can see case studies developed by Beinat (1997); Demesouka et al. (2013); Siskos and Assimakopoulos (1989); Valiakos and Siskos (2015)). Here we propose to use this family of methods in order to analyse people values and preferences in a way that represents people behaviour.
We use an implementation of the UTA method in the first phase of the analysis (see figure 3): the
290
UTA+ algorithm (Kostkowski and Slowinski, 1996). The UTA+ algorithm gives a score to each alternative starting from a weak order among a subset of alternatives. This method, based on a principle of ordinal regression, consents to solve the linear problem proposing a set of marginal utility functions compatible with the preferences of the decision maker. The particularity of UTA+ software is that it consents to modify interactively the utility functions (paying attention to the sensitivity analysis) in order to meet the
295
preferences of the decision maker. Finally, a post-optimal analysis (using the Kendall coefficient τ) is made in order to measure the correlation between the ranking defined by the user and the ranking obtained using the utility function found by ordinal regression (Kostkowski and Slowinski, 1996).
3. The Method
We propose a policy analytic method aimed to define groups of people with similar preferences and values
300
of environmental opportunities in space (from now named "values in space"). A method aiding in designing public policies aimed to improve the capability set of people with similar preferences, values and needs.
The proposed method is based on a multi-criteria model that combines preference learning (Fürnkranz and Hüllermeier, 2010) methods with cluster analysis (Kaufman et al., 2005) in order to estimate parameters (i.e. the values, preferences) for the best territorial offer for each group of people. Such parameters can be
305
used to define the Pareto frontier and in order to estimate the subset of urban capabilities. The method is composed of different phases as we can see in Figure 3:
1. Survey and data collection. The survey is aimed to collect data useful for the analysis. For the analysis we may use primary data, (collected by the researcher for the principal aim to satisfy a specific analysis) or secondary data (collected by other researches and different aims but that can
310
be useful for the study).Here we used GPS traking and questionnaires collected during a survey we developed.
2. Multiple-criteria decision analysis of preferences. In this phase we define the set of criteria that describe our problem and analyse the preferences and values of people involved in the survey. More in detail, this phase aims to analyse the set of value functions z useful for the definition of the objective function
315
of each individual. MAVT with the UTA+ method is used for the analysis of such value functions. 3. Selection of relevant factors for personalization. This phase is aimed to define which are the
socioeco-nomic factors Φ that influence the objective functions of inhabitants. In detail, the aim is to simplify the model removing the socioeconomic factors that, even if we consider as important, do not change the final result. It is composed by a [1] cluster analysis of the utility functions and [2] a rough set
320
analysis that considers both the utility functions and the socioeconomic factors.
4. Cluster analysis: profiling. The final phase consents to group people with similar preferences, i.e value functions z , and similar socioeconomic factors Φ.
5. Recommendation. Final recommendations consent to give useful information to the policy maker for the design of new policies for the different groups of inhabitants and considering their values z and
325
socioeconomic characteristics Φ.
In the following paragraphs we describe the case study and we deepen the phases of the method.
Figure 3: The method
4. The case study
In this paper we develop an experiment aimed to understand and explain what people value in the territory. We aim to enlarge the territorial offer of capabilities and not only to propose doings and beings
330
already existing in the territory. Moreover, we go further to an economic development of the territory, giving attention to the improvement of the possibilities to do and act in the city for different categories of peoples. The inhabitants interested in the study are not only the groups analysed in the case study, but all the inhabitants of a territory. The aim is, in fact, to improve the set of urban opportunities that consent a community development of quality of life (as intended in the capability approach (Sen, 2009).
In order to test our method, we used a set of data we collected for a past study. We analysed visitors’ behaviour in the city of Alghero, and proposed to enlarge the territorial offer with respect to the driving values of the visitor population. Even if the experiment is done with a population, the visitors, that is usually associated with a socio-economic development of the territory, we claim it is important to understand their needs and values as inhabitants. In this perspective, the results of our experiment will be useful for defining
340
public policies aimed to improve the quality of life of all groups of inhabitants (Martinotti, 1993).
Alghero is a city of about 40.000 citizens in the north west coast of the island of Sardinia (ITALY), characterized by an economic dependance from the visitor season for the development of the territory. Data collected by the observatory of tourism show how the city experience each year about 800.000 occasional "population of visitors", among city users, visitors, and business people with a constant growth in the last
345
years (Cannaos et al., 2014).
These visitor inhabitants (Nuvolati, 2003) are concentrated above all in the months of July and August, with officially data that point out a pick of 12.000 occasional population during the mid-August holiday (14-15-16 August). Whereas the months of June, September and October register important numbers of occasional population (more than 100.000 inhabitants per month), that choose to spend from 3 to 8 days
350
in the city, fewer are the numbers of visitors that choose to stay in Alghero for just a weekend between November and April (an average of about 10.000 per month).
These data stress the seasonality of this visitor economy and emphasise the necessity to design public policies oriented to a deseasonalization in order to foster a sustainable development of the territory. The aim is to integrate the tourism activities of the low season period with the environmental assets of the territory
355
in order to offer new opportunities for all the inhabitants and not only for the visitors. We are not interested in the economic development of the territory but in the new possibilities to do and to be in the space for the whole population. For this reason we concentrate the study of visitor’s behaviour in the low season period. Looking at the low season period trends we can frame better the problem. Data collected in October-November 2014 (Blečić et al., 2016) show that this seasonal population usually travels in couple (46,67 %)
360
or alone (17 %), while groups of families, couples with children and groups of friends cover each about a 9 % share of the sample. They choose to stay in Alghero for the favourable climate, the possibility to relax and enjoy food and wine traditions in a environment of high quality. This demonstrates the attractiveness of this location despite the end of the bathing season. A previous work (Blečić et al., 2016) shows that the main places of interest are concentrated between the historical centre and the waterfront. More precisely
365
it is possible to distinguish some historical and archaeological elements located in the city centre and in the whole territory of the city, like the cathedral, the bastions, and the historical settlements located near the city centre linked to the Nuragic civilization, as well as the most recent settlements founded during the period of land reclamation characterized by a rationalist architecture (like Fertilia and Santa Maria). Environmental resources (both local and territorial) are considered indispensable destinations also in the
370
low season period: the beach of the city (Lido), the Nettuno caves and the numerous beaches and panoramic viewpoints that surround the gulf are just some examples of such places. Finally there are some cultural elements (like the civic theater, the museums, . . . ) and the leisure (waterfront, public gardens, the harbor, . . . ) and food services (the civic market, the typical restaurants, . . . ) that are important attractors for the visitors.
375
According with the community and the local government’s aims for the development of the territory, we want to attract visitors during the off-season in order to deseasonalise this economic activity and to improve the urban opportunities for all inhabitants of the city. An economic development heavily exploiting tourism can bring both positive and negative consequences. A "temporal" economy risks to influence the territorial development, at the same time urban and environmental opportunities need to be strategically improved in
380
order to meet the will of the different populations that live the city (Martinotti, 1993).
For this purpose the local government needs to identify which environmental resources should be devel-oped and how. Moreover, the policy maker needs to identify the values and the needs of the people that live in the city with respect to these urban opportunities.
Considering this problem, in our experiment we look at the low-season visitor period, in order (1) to
385
analyse the values and characteristics of visitors that came in Alghero city during this period and (2) to design new public policies aimed to increase the set of urban capabilities for the whole population. There
are different method usually used in literature in order to analyse visitors’ behaviour in space for design public policies.
4.1. Visitors’ behaviours in space. A brief literature review.
390
The analysis of visitors’ behaviour in space is a part of the "time geography" field (Herstraand, 1970; Shoval et al., 2015). Time geography focuses on the constraints on human activities in space and time (Miller, 2005). It deals with the relationship between space and time, considering the constraints and trade-offs for the development of activities given a limited time. Methods surveying and analysing spatio-temporal behaviour are highly developed in transportation research and in social sciences in general (Kwan, 2002),
395
however little attention has been paid to the analysis of spatial and temporal behaviour of visitors (Shoval and Isaacson, 2010). This is due, essentially, to the difficulty to gather data.
In recent years scholars have started to break ground in this specific domain of applied research, ex-perimenting and exploring advantages and disadvantages of satellite-based positioning technologies for the study of visitors’ spatio-temporal behaviours (Shoval and Isaacson, 2007, 2010; Shoval et al., 2014).
Dif-400
ferent methods have been reported for tracking visitor spatio-temporal behaviours by Kellner and Egger (2016): direct observation of visitors’ activities, with interviews or remote observations; time-space budget techniques (Pearce and Pearce, 1988) which analyse visitors’ activities within destinations by using diaries, questionnaires and interviews; video-based tracking analysis, used to track visitors movements through video footage; smartphones with apps using positioning systems; specialized GPS tracking devices; land-based
405
tracking systems that collect data thanks to radio technology.
Among the different visitor’s location, many studies focus on particular urban areas or activities that have a clearly defined entry and exit point, such as natural parks or historical centres (Shoval et al., 2014). Also many urban contexts have been analysed, among which Rome (Calabrese and Ratti, 2006), Lago del Garda (Bruno et al., 2010), Canberra and Sydney (Edwards et al., 2009), Salzburg (Kellner and Egger,
410
2016), Bilbao (Aranburu et al., 2016), Hong Kong (Shoval et al., 2015). On the other side, there are studies that attempt to analyse visitor behaviour at a very large scale (e.g. on the national scale, by using mobile phones data (Ahas et al., 2007).
Different statistical and visualisation techniques are used in order to summarize the analysis of such data. Frequently spatial temporal data are used to describe the visitors track frequency in maps. Sometimes these
415
spatial maps combine information collected through questionnaires. This allows to link spatio-temporal behaviours to a specific visitor category of population with classical statistical methods (age pyramid, employment,...). Furthermore, there are studies trying to predict visitors whereabouts, how long they will stay in a place, or carry out a specific activity (Chhetri et al., 2010), and studies that analyse the sequence of movements in space for different groups of people (Shoval et al., 2015). Particularly, Shoval et al. (2015)
420
use a sequence alignment method to determine which type of location are visited and in which order from different groups of visitors. Only few studies try to analyse the relation between space and the visitors’ behaviour. One example is given by Aranburu et al. (2016) that use network analysis in order to determine the central places of Bilbao and analyse the spatial interaction between cultural sites starting from the GPS network points of interest.
425
All such studies analyse data in order to determine behaviours in space, the concentration of individuals in particular areas and the possible relations among individuals and space. These studies analyse what people actually do in space, without considering what people can do thanks to space configuration and activities (the capability set) or how people value a different space configuration (in case of a new project). Under such a perspective, we claim the importance to consider also subjective values in space in a value
430
theory approach (Keeney, 1994). 4.2. Survey and data collection
We analyse the visitor population in Alghero city during the 2014 visitor low season (October-November), considering that Alghero’s peek period is the summer season with highest visitor concentration between July and September. We choose to collect data in this period because we want to catch urban limits and
435
opportunities due to the reduction of urban activities. We also expect to catch significant information for the design of a public policy aimed to deseasonalize this trend.
Two types of data were collected in the survey: interviews inspecting expectations and degree of satisfac-tion as well as GPS movement tracking exploring visitors’ movements in the territory. For more informasatisfac-tion about the survey method see Blecic et al.’s work Blečić et al. (2016).
440
Especially, we dispose of 75 questionnaires representing a set T of 225 visitors described by a set of attributes A.
A = {gender, age, country, level_of_study, profession, willingness_to_pay} (3) We know the visitors’ paths in the territory, in a space described by Coordinates and Time. Let S denote the set of possible coordinates and τ the set of possible times. A path is a set of points P ⊆ S × τ.
Finally we define a set of Categories of attractions C ∈ S that a visitor can choose in Alghero city (Table 1). These Categories are chosen considering the main places of interest as defined from a previous study (the reader interested can found more information in Blečić et al. (2016)).
445
Criteria: Categories of attractions Attractions Environmental elements (local) Lido, M. Pia, . . . Environmental elements
(territo-rial) Grotte di Nettuno, Punta Giglio, Spi-aggia del Lazzaretto, . . . Historical and archaeological
ele-ments (local) Cattedrale,Bastioni,Historical centre,. . . Historical and archaeological
ele-ments (territorial) Fertilia, Castelsardo, Stintino, nuraghePalmavera, . . . Cultural Elements Theater, Cinema, Museum, . . .
Food services Restaurants, Market,. . .
Leisure Waterfront, Public Gardens, Harbor,. . . Other Stay in the Hotel, friends’ home, Routefrom one place to another, . . .
Table 1: Set of Criteria: Categories of attractions and examples of attractions
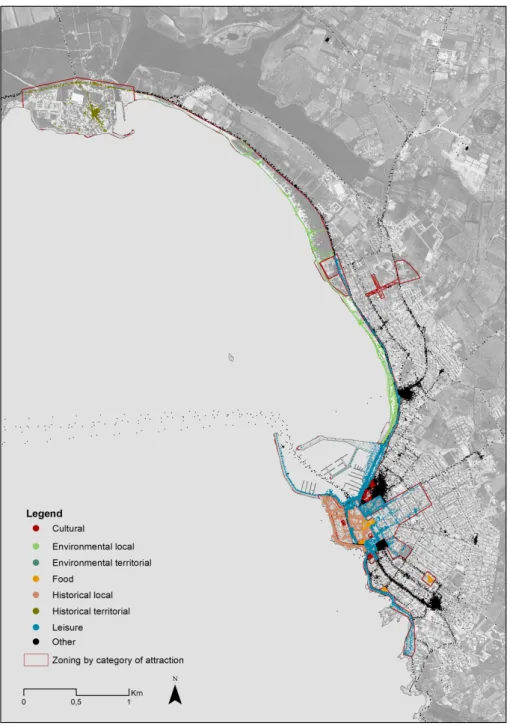
In order to divided GPS points in categories of attractions we did a spatial classification analysis of GPS points (Figure 4). The main phases are summarized as follow:
1. Split the space. Subdivide the territory in different places p representing the environmental opportu-nities. Alghero territory was divided into polygons, with each polygon representing a single Category of attraction (Figure 4). If the same point in space belongs to different categories of attractions,
450
then we consider the most relevant. Polygons represent specific environmental, historical and cultural attractions (Table1), visitor services and the major urban shopping and dining districts commonly frequented by visitors.
2. Characterise spaces. Assign a Category c to each attraction. Let C = {c1, . . . , c8} denote the set of
categories of attraction.
455
3. Count the time. For each visitors’ path we analyse the time spent for any category of attraction c. For each visitor t we analyse how much time (it
∈ R+ the total number of seconds) he has spent during
his trip in the different category of attraction c. The time spent in any category is given by the sum of the different ranges of time in this category of place xt(c
v). Finally we consider that each visitor
has 15 hours to spend in a day.
460
Then, we define a vector path x : C → R+ as a function that maps each category of attraction to a
number of seconds and X = R+C the set of all possible vector paths. We associate to each visitor t ∈ T
a vector path xtand consider that among all the vector paths, the visitor chose a path using a preference
relation. A preference relation is given when the visitor can freely choose a path rather than another whit respect to his\her individual characteristics (age, gender,. . . ) and to his\her personal (income, goods,. . . )
and spatial resources (means of transport, spatial distribution of activities, . . . ), expanding his set of urban capabilities (Blečić et al., 2015b; Sen, 2009).
Our objective is to associate to each visitor t ∈ T a preference relation St which represents, according
to our model, the way the visitor evaluates the possible paths in the Alghero territory, i.e. how that visitor values the different opportunities in space. This preference relation can also reveal important elements for
470
the design of new paths with respect to the demand of opportunities of the visitor population in Alghero. Summary of data Description
T Set of visitors (t a visitor) it
∈ R+
Intensity corresponding to t: the total number of seconds visitor t has spent on his trip in the different categories of space.
CV The categories of places in Alghero that can be
vis-ited, thus including staying home. xt: C
V → R+
The vector path chosen by visitor t that associates a number of seconds to each category of place. By definition, Pc∈CV x
t(c) = it.
Table 2: Summary of data
4.3. Multiple-criteria decision analysis of preferences
This step (see figure 3) aims to define people’s preferences with respect to the criteria selected for the evaluation of space. We consider that each visitor is a decision maker needing to be aided in order to understand his\her priorities and values in terms of what he can do in the Alghero territory. What he\she
475
can freely choose to develop in terms of urban capabilities thanks to the urban environment and his\her personal characteristics.
The analysis of space can be then intended as a multi-criteria decision making problem that aims to rank a set of finite alternatives, i.e. all the possible paths offered by the territory and valued as important by the visitors and similar inhabitants. In that model the criteria are represented by the different opportunities
480
given by the territory, and are described by the intensity of time it
∈ R+ that each visitor has spent in
each category of place CV. The set of criteria are defined in the table 1 and are: Environmental element
(local); Environmental element (territorial); Historical and archaeological elements (local); Historical and archaeological elements (territorial); Cultural Elements; Food services; Leisure; Other.
As stated above, preferences and values can be learned with different methods. In this case we estimate
485
the value functions from holistic judgements deducted from people behaviour using the UTA (Jacquet-Lagrèze and Siskos, 1982) method that elaborates the problem under multi-attribute value theory.
According to this method, we represent the preference relations S using additive value functions. Let ut
denote the value function of visitor t. We define Stfrom ut as follows:
(x1, x2) ∈ Stiff ut(x1) ≥ ut(x2). (4)
Our objective is thus to obtain the utility ut from the path data of each visitor xt. We assume that ut
can be represented as a weighted sum of marginal value functions: ut(x) =X
c∈C
uc(xc)wtc, (5)
where wt∈ [0, 1]represents the trade-offs among criteria that the visitor t is supposed to give over categories
Cof places that represent the criteria in this model.
Moreover, given a category of attraction c ∈ C, we define a marginal value function uc : R+ → [0, 1].
490
We assume for now that such marginal value functions {uc}and the trade-offs may depend on inhabitants’
the visitor gives to spending it seconds in the category of attraction c (for example: environmental local
attractions), not taking into account the partial weight wt
c. Finally, we define each partial utility function
uc as a two linear piecewise increasing function.
495
At the beginning we just know the behaviour of each visitor t and his\her declared preferences. In order to learn the set of visitors’ preferences as actually performed we consider the relation among the path chosen by the visitor and a set of "typical paths". We define a typical path as a path that a visitor can freely choose with respect to his personal characteristics and spatial and personal resources and assets (in a capability theory framework (Sen, 1999)). A typical path is a combination of categories of attractions C and time τ
500
the visitor ideally spend in (with a maximum of 15 hours of visit per day).
We define the typical paths with an expert of the territory (an urban planner working in the city of Alghero). The set of typical paths consider the trends in the visits (Blečić et al., 2016) and include not expensive and reachable on foot attractions, accessible by all the visitors (see Table 3). We consider the set of typical paths as a set of "visitors’ relevant urban capabilities". These are ten typical paths xO1, . . . , xO10 505
that we assume visitors have considered because are standard paths available for all people and that allows to develop a set of visitor relevant urban capability. With respect to this, we assume that the visitor t prefers the path xthe\she has chosen to each of the typical paths ut(xt) ≥ ut(x
Oi), 1 ≤ i ≤ 10, such that the weak
order considered is xtP T p1 I T p2I T p3 I T p4 I T p5 I T p6 I T p7I T p8 I T p9 I T p10. Tp EL ET HT HL FS LS CL OT Tp1 6 0 0 0 3 1 1 4 Tp2 0 7 0 0 3 0 0 5 Tp3 0 0 0 2 2 6 2 3 Tp4 0 0 0 4 1 3 0 7 Tp5 0 0 7 3 3 0 0 2 Tp6 6 4 0 1 3 0 1 0 Tp7 7 6 0 0 1 1 0 0 Tp8 2 0 0 6 2 3 2 0 Tp9 2 0 6 0 1 3 2 1 Tp10 1 0 6 0 3 2 2 1
Table 3: Soft set. Number of hours for category of places in the Typical Paths (Tp).
Finally, we define the set of value function for each visitor (see the figure 5) using the UTA+ software.
510
The final set of value functions represents the z set of objective function useful for the approximation of the urban capabilities for that visitor. Such a set also provides the trade-offs among urban opportunities for a visitor and can be used to determine the Paretian frontier that defines his capability set.
4.4. Selection of relevant factors for personalization
This step (see figure 3) of the analysis method aims to select the relevant socioeconomic factors that
515
influence the choice of a particular path by the visitors, and consequently the value of the different urban opportunities. In fact, different people in the same place can choose different paths with respect to personal and contextual factors (in a Capability Approach framework (Sen, 1999), see Figure 1 for the conversion process). Here we want to focus on personal factors (gender, age, profession, ...) that influence the choice of people, that is the ability component of the capability (see the paragraph 1 Capability Approach).
520
In order to analyse the relation between the values given to the different urban opportunities by the visitor xtand the ability factors (personal characteristics), we propose a two-step analysis. First we made
a cluster analysis of the preferences stand alone, then we performed a rough set analysis within the class of the cluster and the personal information of visitors in order to find the relevant set of features.
We classify the visitors considering the value functions as revealed by the UTA+ software. Specifically,
525
we made a hierarchical cluster analysis of the value functions (central and maximal point) for the different categories of spaces. We performed some validation tests in order to define the better number of cluster
Figure 5: Example of the set of partial value function of the visitor t1 for the different Categories of Attractions
for different type of cluster analysis (Kassambara, 2017). The validation methods suggested a model with 3 components.
Then we perform a rough set feature selection analysis in order to find a subset of features which have the
530
same quality as the complete feature set. The purpose of the rough set feature selection method (Pawlak, 1982) is to select the relevant features and eliminate the not relevant ones. We use this method in order to isolate the socioeconomic features that are useful for the classification of visitors with respect to the cluster families of value functions (previous step).
Starting from the knowledge of Y we select the set of attributes ∈ A
A = {hotel, gender, age, country, level_of_study, profession, travelling_with} (6) The final rough set analysis eliminated the level of study feature from A, creating a feature subset of 6 attributes Y :
A1= {hotel, gender, age, country, prof ession, travelling_with} (7) This two-step phases defined a set of 6 attributes (hotel, gender, age, country, profession, travelling_with)
535
that can be considered as representative of the ability components that determine the choice of the capability set by a visitor t.
4.5. Cluster Analysis.
This step of analysis (see the figure 3) aimed to build homogeneous groups of people with similar value function of urban opportunities and similar socioeconomic characteristics. In this regard, we performed a
540
cluster analysis of the max and medium values of utilities functions together with the socioeconomic A1
data in order to find homogeneous groups of people that value space similarly. That is, groups of people that give the same importance to spending time in particular location of the Alghero’s territory. Moreover, we assume that such clusters represents the groups of people that have similar urban capabilities, because starting from the same set of opportunities and a similar set of abilities they choose to perform similar
545
functionings..
Having to deal with numerical (values) and categorical data (socioeconomic information), we cannot use the usual metric distance matrix in order to build the clusters. The Gower dissimilarity index (Gower, 1971) is suggested in such cases in order to define distances and centroids for the clusters. The Gower distance calculates for each variable a distance metric fitting that type of variable, then the distance is scaled between
550
0 and 1. If the variables are quantitative the coefficient used is the range-normalized Manhattan distance converted into similarity. When the variables are nominal the Dice matching coefficient is used that recodes variables into dummy ones. Finally, the final distance matrix is calculated using a linear combination with user-specified weights (an average).
We performed the Hierarchical agglomerative Cluster method (HC) which consents to calculate clusters
555
without knowing a-priori the number of clusters. To calculate clusters, the HC method begins by inserting any alternatives in its cluster and then pairs the two closest ones by examining the distances. There are different methods to examine distances, among that we choose to use one of the more appropriates for the unsupervised classification: the Ward classification (Ward, 1963) that minimizes the total within-cluster variance. Among the cluster agglomeration methods Ward is preferred as it merges at each step the pair of
560
clusters with minimum between-cluster distance.
The results of the classification shows a dendrogram with 5 distinct clusters as suggested by the maximum point of silhouette width visible in (Figure 6).
Figure 6: Dendrogram
The resulting clusters show different compositions of individuals and of value functions that we synthesize in Figure 7, 8, 9 and in Tables 4 and 5. More in details, Figure 7 and Table 5 represent the different personal
565
characteristics that compose the clusters, revealing people with different ages and provenance having similar interests, while Figure 8 and Table 4 illustrate the trade-offs of values for each cluster. For example, the Cluster2 is composed by European individuals aged 30-39 and 50-59, which travel in couple and prefer to visit historical (both local and territorial) opportunities, to enjoy of the food services and taking time to relax in the hotel. The Cluster3 is mainly composed by 40-49 years old individuals coming from Europe,
570
public employees travelling with group of friends, interested in food services and leisure activities. This group is also interested in visit historical local opportunities but for just few hours, while for a long visit they prefer environmental attractions and historical territorial opportunities. Moreover, we can observe that the Cluster5 is composed by a 70% of people travelling alone of non-European nation, meanwhile Cluster 4 is composed by retired people (aged more than 60 years old), coming from European nations, that travel in
575
family or group and are interested in environmental local opportunities.
Finally, Figure 9 illustrates the values of the same urban opportunity for different groups of visitors. For example, historical local attractions have a range of values from 0 for the Cluster4 to 0.13 for the Cluster2, the food services value range from 0.03 for the Cluster2 to 0.22 for the Cluster3, the interest to relax in the hotel range from 0.20 for the Cluster3 to 0.8 for the Cluster4 (composed by more than 60 years old people).
580
Beyond the analysis of results that can be useful for a policy maker, we can use that final data to define an approximation of the urban capabilities for the 5 groups of people. These can be useful information for the policy maker that try to enlarge or to limit such a set of capabilities with reference to a population target. For example, the Cluster 4 is composed by more than 60 years old retired people, travelling in family
Figure 7: Personal Characteristics
Cluster 1 Cluster 2 Cluster 3 Cluster 4 Cluster 5 Environmental local 0,07 0,13 0,10 0,35 0,07 Environmental territorial 0,05 0,06 0,08 0,02 0,04 Historican territorial 0,08 0,14 0,10 0,02 0,06 Historcal local 0,04 0,13 0,07 0,02 0,03 Food 0,16 0,04 0,19 0,04 0,14 Leisure 0,19 0,02 0,17 0,03 0,12 Culture 0,00 0,01 0,03 0,00 0,00 Other 0,41 0,47 0,27 0,53 0,53
Table 4: Value function maximum value.
or group and that are mostly interested in environmental local opportunities and stayed in hotel less time
585
than other groups of people. If the local government wants to attract such a group of people in the visitor low-season, then a new public policy needs to take into account the preferences and needs of such groups and focus, for example, on environmental elements and services that support the access of environmental local opportunities also in the winter season. This will expand the opportunity set valued from this group of visitors and improve their quality of life. Moreover such a policy will consent to develop new services
590
accessible by other group of inhabitants, thus enhancing their capability set. One more example: the Cluster 5 is composed by workers travelling alone from Italy or extra-European nations, that are interested in food and wine spaces and in leisure spaces. In this case we suggested the design of a policy that provides an agreement between hotel activities and recreational activities in order to suggest and encourage such group of visitors to spend in Alghero city more days than those planned for their work. These are only some of
595
Cluster 1 Cluster 2 Cluster 3 Cluster 4 Cluster 5 Age 20-29 15 0 0 0 0 30-39 20 45 0 36 17 40-49 25 18 55 14 42 50-59 20 36 27 14 33 >60 20 0 18 36 8 Nationality eu 65 73 82 93 42 extraeu 5 0 0 0 17 italia 30 27 18 7 42 Profession Housewife 0 0 0 21 0 Public employee 0 18 73 14 33 employee 50 54 18 29 41 freelance 30 27 9 21 17 retired 15 0 0 14 0 student 5 0 0 0 0 other 0 0 0 0 8 Travelling with alone 5 9 0 14 67 colleague 5 0 0 7 0 couple 75 64 36 50 8 family 10 18 27 21 17 friends 5 9 18 7 8 group 0 0 18 0 0
Table 5: Socio-demographic composition of clusters (%)
can focus on one group (as the example we gave) or on the inequalities among groups, thus considering how the context or a new policy can improve or limit some inhabitants. It depends on the interests of the policy maker how the information offered by our model can be used.
4.6. Towards decision maps.
600
Finally, the method we proposed consents to unveil the spatial distribution of values and capabilities and to design spatial decision maps helping in the policy making process.
In Figure 10 we propose a first attempt of spatialization of the values of urban attractions (i.e. urban opportunities) for the different clusters of inhabitants. We use the existent paths in order to understand the different distribution of values in space (the intensity of color in the map indicates an intensity of preference
605
for that urban opportunity type). Figure 10 shows how the different groups of visitors value differenty the possibility to use the space with respect to the opportunity offered by the different categories of attractions. This representation can be seen as the set of possible paths K that can be offered to the visitors that belongs in the same cluster. Meaning that a visitor that spent his day in the path xt∈ K is also interested
in spending time in other paths internal to the K set.
610
Such spatial information is fundamental if we want to improve the set of urban capabilities of visitors with respect to their values, designing legitimated public policies. Improving the set of urban capabilities of visitors in a low season period means designing a strategic policy oriented to visitor deseasonalization and fostering a sustainable development of the territory.
Figure 8: Utility Functions
Figure 9: Boxplot of opportunities values for the different groups of visitors
4.7. Limitations and future works.
615
The proposed method has several limitations that we will improve in future works. We tested the method only in one city and with one population (the visitors). On this behalf, we warn the reader that the model should be customized for a different city. For example, the measure of the urban and environmental values in a different city may entail the analysis of a different set of urban and territorial opportunity sets. In
Figure 10: Spatial decision map: summary of clusters. (In order, 1-2-3-4-5 cluster)
addition, results of the study cannot be replicable for other cities because are context embedded and depend
620
on the population composition we analysed. We are conscious that the survey should be improved: an ad hoc survey will be the best way to collect behavioural information, moreover, the data collection sample size should be larger, as well as the period of time for collecting data should be enlarged. The method should be tested with a more large and differentiated group of city users (inhabitants of the city) in order to give a more complete and useful information to policy makers. Moreover, the method as presented here,
625
is composed of several steps that take a large amount of time for the elaboration. This is due because of the lack of softwares that work in an integrated way with spatial information and the multicriteria analysis of value functions. Finally, the method to build the value functions could be enhanced considering the spatial variability of the functions. Authors are conscious that the value functions may differ in different point in space.
630
5. Conclusions.
In this work we proposed a replicable method for policy analytics aimed to determine inhabitants’ val-ues of space: valval-ues that individuals give to different territorial opportunities in space within a capability approach framework using multi-attribute value theory. The problem consisted in assessing individual pref-erences about space in order to allow designing legitimated public policies. Our main aim was to demonstrate
635
the necessity to consider how individual’s values matter when we evaluate environmental opportunities and to propose and test a new method for the analysis of such values in space. We claim that multi-attribute value theory can offer useful methods in order to unveil the values of what people do and what they believe in space (i.e. developing a set of capabilities). Values of space are useful in order to unveil the desirability of future public policies for different categories of inhabitants. This is due to the overturning from the
640
evaluation of alternatives (endowments and conditions offered by the context) to the evaluation of the value of the opportunities given by such alternatives. These values allows to evaluate the urban capabilities people are interested to choose and develop.
Results of the experiment proposed in this paper allow to define groups of people that value similarly the different set of urban opportunities. This confirmed our thesis about the subjective values of spaces.
645
Moreover, these results consented to define the Pareto frontier that describes an approximation of the urban capability set of such groups of inhabitants.