Design and Deploy: Co-Creative Public Transport Planning Using
a Web -Based Stakeholder Engagement Tool
by
Xin Zheng
B.E. Urban Planning
Peking University, China (2015)
Submitted to the Department of Civil and Environmental Engineering
in partial fulfillment of the requirements for the degree of
Master of Science in Transportation
at the
MASSACHUSETTS INSTITUTE OF TECHNOLOGY
Feb 2018
Massachusetts Institute of Technology 2018. All rights reserved.
Author ... ..
...
Department of Civil and Environmental Engineering
({Dec 13, 2017
Certified by...
...
Associate ProfessorP
ces Christ pher Zegras
Department of Urban Studies and Planning
71
Accepted by ...
MAWSSUETS INSTITUTE F TECHNOLOGYAPR 13
2018
LIBRARIES
V
,The.5jsjSupervisor
Professor Jesse Kroll
Chair, Graduate Program Committee
Design and Deploy: Co-Creative Public Transport Planning Using
a Web -Based Stakeholder Engagement Tool
by Xin Zheng
Submitted to the Department of Civil and Environmental Engineering on Dec 1 3th, 2017 in partial fulfillment of the
Requirements for the degree of Master of Science in Transportation
ABSTRACT
Using new technologies, such as web-based applications and online map visualizations, to help public engagement for public transit campaigns is an emerging trend in the urban planning field. Scenario simulations and map-based visualizations to show accessibility or travel time impacts can provide users insights into the possible results of new transportation projects. CoAXs (Collaborative Accessibility-based Stakeholder Engagement platform) is a web-based application that has been implemented in experimental public engagement exercises in three cities in the United States to test its potential for facilitating the public engagement process around public transit advocacy.
In 2016 and 2017, two types of experiments were conducted using CoAXs in Boston, New Orleans and Atlanta. One used a workshop-based approach, in which participants were gathered in a room and used CoAXs with facilitators' help. The other experiment took an online, remote approach, in which people used CoAXs by themselves, with the help of an online tutorial. By using a web log and survey data, this research found that the self-learning process works in the remote version and the more a user uses it, the more s/he thinks CoAXs is easy to use. However, the remote version performed worse than the workshop approach in terms of usability and possibility for inspiring imagination.
Thesis Supervisor: Pericles Christopher Zegras
ACKNOWLEDGM ENT
Firstly, I would like to thank my thesis advisor Professor and informal ringleader of CoAXs team, Chris Zegras, for his guidance and support. I have learned a lot from him in both academic field and project management field.
Thanks to all the teammates in CoAXs team, Kelly Blynn, Peter Damrosch, Jonathan Leape, Xinhui Li, Ceasar McDowell, Cristian Navas Duk, Ricardo Sanchez Lang, Ayesha Shahid, Thiago Sobral. The different skill sets of you make CoAXs better and better in many perspectives. I am so happy to work with you guys.
Special thanks to Anson Stewart, for his help in the development of CoAXs. One year ago, it was Anson recruit me into CoAXs team. He helped me understand the previous codebase and give
me the freedom to rewrite CoAXs using React. The new version of CoAXs would not have been possible without his help. Thanks for the time you dedicate to all phases of the project. Thanks also to the TransitCenter which sponsored the project on which this thesis research is based.
Last but not least, thank you, mom and dad. I was blessed with gracious, caring parents. And furthermore, this work is for my grandfather who just passed away three months ago. His greatest wish is watching my graduation. Hope you live well in the heaven.
TABLE OF CONTENTS
ABSTRACT...3 ACKNOW LEDGMENT ... 5 TABLE OF CONTENTS...7 LIST OF FIGURES ... 9 LIST OF TABLES...10 1 Overview ... 12 1.1 Introduction ... 12 1.2 Background ... 13 1.3 Research questions ... 15 1.4 Thesis organization ... 16 2 Literature review ... 17 3 Redesign of CoAXs...19 3.1 M edia change...193.2 User interface Adjustm ent... 20
3.3 Sim plified workflow ... 23
3.4 Online self-guided learning experience ... 26
3.5 Landing page...28
3.6 Login session and random redirection... 28
3.7 Incentive ... 29
3.8 Grow ing w ith open source com m unity ... 29
4 Experim ent overview ... 32
4.1 Introduction to the Boston workshops ... 32
4.2 Introduction to the New Orleans rem ote experim ent... 33
4.3 Introduction to the Atlanta rem ote experim ent... 36
5 Data collection ... 38
5.1 W eb log ... 38
5.2 User survey ... 39
6 Experim ent result ... 40
6.1 Enter tim es and active duration... 40
6.2 Drop out point ... 44
6.3 Operation tim eline analysis ... 46
6.5 Rem ote versus workshop approaches ... 53
7 Conclusion ... 59
7.1 M ajor findings and im plications... 59
7.2 Shortcom ing and Future research ... 60
LIST OF FIGURES
Figure 1-1 Technical flow of CoAXs (Drawn by Jonathan Hoagland Leape) ... 14
Figure 3-1 The map resolution in the workshop version of CoAXs ... 22
Figure 3-2 The map resolution in the remote version of CoAXs ... 22
Figure 3-3 The work flow in the workshop version of CoAXs... 24
Figure 3-4 The workflow in the remote version of CoAXs...25
Figure 3-5 The screenshot of the "Get to know CoAXs" tutorial... 27
Figure 3-6 The screenshot of the "create your own scenario" tutorial...27
Figure 4-1 User interface of Boston version of CoAXs ... 33
Figure 4-2 The proposed extension for New Orleans... 35
Figure 4-3 User interface of New Orleans version of CoAXs ... 35
Figure 4-4 Map of selected projects in Atlanta ... 37
Figure 4-5 User interface of Atlanta version of CoAXs ... 37
Figure 6-1 Entry tim es for each city ... 40
Figure 6-2 Histogram of average active time for each user ... 42
Figure 6-3 Average active time for each city... 43
Figure 6-4 Drop out point for each city ... 45
Figure 6-5 Interaction timeline for each user... 46
Figure 6-6 Histogram of the number of operations for accessibility and point-to-point version .47 Figure 6-7 histogram of operation times for each city...48
Figure 6-8 Percentage of each operation type for New Orleans...49
Figure 6-9 Percentage of each operation type for Atlanta...49
Figure 6-10 The average use time according to reported complexity of use (Response to statement: "I found CoAXs unnecessarily complex.")... 52
Figure 6-11 The average number of user operations according to reported ease of learning (Response to statement: "I would imagine that most people would learn to use CoAXs very q u ickly") ... 53
Figure 6-12 Usability Comparison between remote version and workshop version ... 55
LIST OF TABLES
Table 3-1 The typical desktop screen resolutions in the United State (November 2017)...21
Table 5-1 The w eb log data schem a ... 38
Table 6-1 Average number of enter times per user (n=23)...41
Table 6-2 Operation category match up ... 44
1 Overview
11 Introduction
Public Transit typically consists of a complex network that makes it difficult for transit planners or transit agencies to show the impacts of upcoming transit projects to stakeholders and the public. This situation may lead to inefficiency and misunderstandings in a transit campaign or public engagement. CoAXs, a Collaborative Accessibility-Based Stakeholder Engagement Platform for transit planning, has been developed to try to figure out this puzzle by using web-based technology to represent the different impacts of scenarios on various stakeholders.
From September 2016 to June 2017, in collaboration with local partners, we implemented three CoAXs instances in Boston, New Orleans and Atlanta.' The practical experiments used different versions of, and different approaches to, CoAXs. The workshop approach gathered people in one
room, with a facilitator to instruct on key concepts and provide guidance on how to use CoAXs. In a workshop setting, people can talk to each other about the possible alternative scenarios and their impacts, creating a real-time dialogue opportunity. In such a setting, however, each
specific person must basically obey the routine of the workflow, which means they have less opportunity to independently explore with the app and create her "own" scenario. We conducted the Boston experiment in a workshop style in November 2016.
In contrast, the alternative approach is with an online, "remote" version, which includes self-learning videos to teach the user the main concepts of the app and how to use it. In this approach, users have to learn the system by themselves and explore the scenario creation and see the results alone. But, this version gives a user more flexibility to manipulate the scenarios
and freedom to understand the impacts of different start/end points. For the remote approach, we redesigned and rewrote CoAXs from January to March, 2017, and started the remote
experiments at the beginning of May.
In both approaches, we used two different versions to provide users two different ways to explore the transit system impacts - accessibility and point-to-point. The accessibility version lets the user choose an origin and show them how many opportunities (e.g., jobs) s/he can get to in specific amount of time, like 30 min or 1 hour. In the point-to-point version, the user
defines an origin-destination pair and CoAXs will show the time difference between two scenarios.
So, how does the "remote" approach of CoAXs work for the user? How does the user use CoAXs in the remote approach and how does this differ from the workshop approach regarding usability and effectiveness? This thesis attempts to answer these questions using survey responses and weblogging data of applications in three cities.
1.2 Background
To improve public participation in transit planning, CoAXs was developed by a team at the Massachusetts Institute of Technology (MIT) to provide an opportunity for users to examine possible changes to current public transit networks in their cities and assess their impacts in an intuitive and interactive way.
CoAXs uses Conveyal R5, an open source transit modeling software,2
as the main calculation tool to test different transit scenarios "on-the-fly." Equipped with the schedule of current transit network data, Conveyal R5 can apply modifications which the user selects and then calculates
the travel time from the specific origin to every destination in the scope of region. CoAXs then takes those results as input and demonstrates the estimated resulting travel time changes and the isochrones of travel range from a specific point under specific amount of time. With
underlying spatial data on available opportunities -like jobs, housing- CoAXs can also present the number of those opportunities that a person can reach under the given travel time by public transit (Stewart and Zegras, 2016).
GTFS
Travel time
Structure and scheduie of
current and potenthal transit
anal|ysis
ne* Visualizing differences in
point-to-point travel timnes between
scenanos
conveyal
Conveysi s Analysis is an open-source framework for
accessibolly analysis
CoAXs
aayi
Land use
nf~~roG;S I yers of tiousing )Ob~s
Figure 1-1 Technicalflow of CoAXs (Drawn by Jonathan Hoagland Leape)
There are three parts in the CoAXs interface: map, editing panel, and navigation bar. The most important component is a map which allows users to zoom in or out and focus on different areas of a city, helping to spatially present the possible impacts of potential public transport projects. The editing panel allows users to activate and deactivate hypothetical and existing transit projects and then explore the effects of changes in, for example, bus speeds or frequencies. In the remote version of CoAXs, a navigation bar is added to show the user's progress and track their steps to completion.
CoAXs was first developed by Anson Stewart (2014) based on Open Trip Planner, which is the previous version of Conveyal R5. Stewart tested it in the focus group format with stakeholders
and transit planning agencies in Boston, MA (USA) and Santiago, Chile. The research found that the visualization of accessibility can evoke more communication between different stakeholders and help people understand the accessibility benefits of different projects.
Based on the first version, in October 2015, six workshops were held in Boston's Roxbury neighborhood to examine the social reaction to proposed bus rapid transit (BRT) improvements, as part of the Barr Foundation's Boston BRT initiative. This experiment included pre- and post-surveys of participants and video recordings of the workshops. In the research, Stewart (2017) found that CoAXs helped participants learn about the impacts of the BRT proposals and that through the interaction with CoAXs, conversation with other people also facilitated learning
amongst participants.
In June 2017, Navas (2017) returned CoAXs to an international context, holding two CoAXs workshops in Santiago, Chile. Those experiments were the first time in which CoAXs was used to show multiple potential opportunity types (e.g., jobs, education, health care) in the interface. The research found that CoAXs can improve the public engagement and inspire higher-scale (metropolitan) conversations, among Decision Makers and Stakeholders.
1.3
Research questions
This research attempts to answer the following three questions:
1. How do users interact with the CoAXs web application in the remote-based approach?
2. What is the relationship between interaction with and performance of the online remote approach?
3. How does the effectiveness or performance of the online remote approach of CoAXs compare
By using a web log of user activities and survey data, this thesis is going to evaluate how the
user interacts with remote approach first and then examine any differences between the accessibility version and the point-to-point version and whether the remote versus workshop approaches have different effects on the audience. Lastly, we will summarize the advantages and limitations of each approach.
1.4 Thesis organization
This thesis is organized into the following structure:
Chapter 2 summarizes the literature review for the thesis, focusing on the difference between online learning and face-to-face learning.
Chapter 3 focuses on the design and development concept under the remote approach of CoAXs and describes the new features added to CoAXs for this purpose.
Chapter 4 introduces the basic background for the experiments in each city and describes the experimental design.
Chapter 5 develops the data collection process in the experiment.
Chapter 6 shows the results and compares the remote approach and the workshop approach using survey and web log data.
2
Literature review
CoAXs is designed to help public engagement around public transit campaigns, for advocates, agencies and others. In some sense, the process is quite similar to education or learning. In fact, transit campaigns and civic engagement try to educate people on the ideas and concepts behind upcoming projects to improve stakeholders' understanding. Numerous papers present
experimental results that compare the effectiveness of e-learning and conventional classroom learning. For example, Zhang's (2004) investigation shows that the Internet and multimedia technologies are reshaping the way knowledge is delivered, and that e-learning is becoming a real alternative to traditional classroom learning.
Table 1 Traditional classroom learning vs. e-learning. (Zhang, D., Zhao, J. L., Zhou, L., & NunamakerJr, J. F. (2004)
A new trend emerging encourages the combination of online learning and face-to-face learning.
Singh (2003) indicates that blended learning is a hybrid of classroom and online learning that includes some of the conveniences of online courses without the complete loss of face-to-face contact. Rovai (2004) used a causal-comparative design to examine the relationship of sense of
Traditional Classroom
Learning E-Learning
* Immediate feedback * Learner-centered and self-paced
* Being familiar to both * Time and location flexibility
instructors and students e Cost-effective for learners
Advantages * Motivating students * Potentially available to global
* Cultivation of a audience
social community * Unlimited access to knowledge
0 Archival capability for knowledge reuse and sharing
* Instructor-centered * Lack of immediate feedback in
Disadvantages * Time and location constraints asynchronous e-learning
* More expensive to deliver * Increased preparation time for
the instructor
* Not comfortable to some people * Potentially more frustration,
community between traditional classroom, blended, and fully online higher education learning environments. Evidence provided suggests that blended courses produce a stronger sense of community among students than either traditional or fully online courses. The U.S. Department of Education (2009) reports that students who took all or part of their classes online performed better, on average, than those taking the same course through traditional face-to-face
instruction. Instruction combining online and face-to-face elements had a larger advantage relative to purely face-to-face instruction than did purely online instruction. But, studies in which learners in the online condition spent more time on task than students in the face-to-face condition found a greater benefit for online learning.
3
Redesign of CoAXs
3.1
Media change
For the remote experiment, CoAXs needed significant changes in the media to show all the user interfaces. In the previous workshop approaches, all the participants came together and used CoAXs in front of one big touchscreen. The remote approach, on the other hand, takes
advantage of CoAXs' web-based nature, allowing participants to use CoAXs on their own, on-line computer whenever and wherever they want. The change of media also led to a transformation
in the way of communication. Because CoAXs is a public engagement tool, communication is the most critical mission for the application. In the workshop version, the participants and
facilitators communicate with the help of CoAXs. In this way, the computer is used to encourage and evoke more talk by showing the travel time change or accessibility within a specific time. We can consider CoAXs as an intermediary agent which bridges the facilitators and participants. So, we can call it human-to-human communication with the aid of the machine.
But, the communication pattern changes in the remote version. No human-to-human talk happens in this case (assuming an individual is using CoAXs on her own and not with somebody else). All the interaction is human-machine based even though the remote CoAXs has the tutorial which includes the teaching screencast conducted by our facilitator. In this way, we need to make sure the computer can also help the participant understand the concepts underneath the project and transit plan and evoke their thought about public transport.
3.2
User interface Adjustment
In order to make the remote version more useful, the user interface needed to be changed. A focus group was conducted to test whether the user interface (UI) works for participants. From the UI perspective, the main finding from that experiment is that old UI did not fit for so a wide range of screen resolutions likely among the users' different computers, which would mean that the font and graphs would not display on the screen with proper and legible size. In addition, some parts of the UI components are squeezed by the other ones due to the small screen resolution on some devices.
The other suggestion from the focus group was that the map area being so constrained on a laptop screen leads to more zoom in and zoom out operations.
Based on this feedback, the UI was redesigned with the following crucial improvements:
* Use-responsive layout to fit different screen resolutions;
" Rearranging the main panel from bottom to the right; and
* Leaving more space for the map area.
The main change focused on the scenario panel. The interaction style and context have a significant impact on the UI. In the workshop-based approach, all people gather in front of the large touchscreen, needing to move hands and arms to do operations like clicking and moving the map, which lead to more unreachable areas on the touchscreen. With the touchscreen placed flat or at a 45-degree tilt, the upper part of the screen can be very difficult to reach. The user has to bend over and across the screen to reach the upper part. As a result, the bottom part of the screen is closer to the users compared to the other areas which makes it easier to change the configuration of scenarios. However, in the remote approach, with the flexibility of
the mouse and keyboard instead of the body, users have less physical difficulty in carrying out the operations. Therefore, we can have more space and freedom to layout the main scenario panel on the screen.
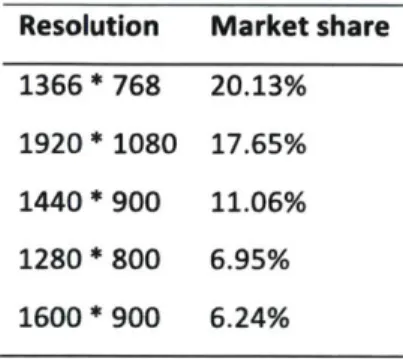
Changing the position of the main scenario panel helps CoAXs to be responsive to different screen resolutions. This is because the screen resolution has considerable more variation in the horizontal axis than the vertical one, especially considering the various potential devices such as laptop, desktop and tablet. Table 3-1 shows the typical screen resolutions in the United States.
Table 3-1 The typical desktop screen resolutions in the United State (November 2017)3 Resolution Market share
1366* 768 20.13% 1920* 1080 17.65% 1440* 900 11.06% 1280* 800 6.95% 1600* 900 6.24%
We can quickly calculate that the horizontal difference is 640 pixels compared to 312 pixels vertically. A lower range of changes in pixels results in less layout disarrangement in the UI components. Also, users tend to be more used to scrolling up and down on the computer instead of horizontally, which is more difficult using an ordinary mouse. In this way, if a screen is too small to include all the scenario editing components, we can let the user scroll vertically to avoid conflict with usual practice.
Improving the map area size was another main focus for the new UI. As Figure 3-1 and Figure
3-2 show, the map size increased from 669,732 pixels to 798,210 pixels, an improvement of
19%. Because all the scenario results will be shown on the map, a larger map area will help the
user to see the isochrones for the whole picture of the transit network and reduce the zoom out and zoom in process on the map.
W0 a!town Cambndge
-
pu-I 14 UIn,.Wu 14 UK0.10014 " UR OfteIoIN*OSIDOIiN OftehDA114 bt - c~ i a HiOWla $4. 40 I 4L jIt'2 ft4010ASINS Ot 'aI"IA Wf01SDI"Figure 3-1 The map resolution in the workshop version of CoAXs
I in A IN 04 **or& 127,60W 3 !4JI MM wqg' A-11 4W - M "M T-Y we
Figure 3-2 The map resolution in the remote version of CoAXs
46 * 0%
e
~
- r~ CI mma 1 mIII , II dWwWOWMWMtAW I
do +GS
--3.3 Simplified workflow
There are two reasons why a simplified workflow is crucial for the online remote approach of CoAXs. First of all, it may be tough to keep the user's focus on CoAXs for long periods of time due to a relatively weak personal connection with her. Since the remote version does not have a facilitator to help and to communicate with users, the pure human-machine communication
may lead to more difficulty in evoking the user's interest and enthusiasm; boredom may push the participant away quickly. Also, as is the case more generally with the use of computers, the trend towards individuals' increasing fragmentation of time may result in distracted,
fragmentation in the use of CoAXs. A participant cannot be easily "forced" to use CoAXs for a long, continuous period of time.
Secondly, without facilitators to show how to use the tool, we cannot expect that the users can easily learn the whole thing by themselves if the workflow is too complicated to understand. So under the same constraints as above, the workflow of the user experience is redesigned as well.
In the previous workshop-based approach, CoAXs had two maps "under the hood" - a route editing map, which shows the routes that are being modified, and a scenario results map, visualizing the isochrones and travel time. A user needs to tap the service editor title bar to toggle the two maps on and off. This design can cause confusion since there is nowhere to let the user know to click the title bar to change the map.
In addition, there are five steps to finish one cycle of operation in the workshop version (Figure
3-3):
1. Tap the service editor title bar to change the map into route editing mode;
3. Save the scenario;
4. Tap the service editor bar again to change back to the scenario results map;
5. Select the two scenarios for comparison;
6. Click the update button or move the origin marker to invoke the travel time calculation; 7. Drag the time filter to see the change in size of isochrones.
- Bro k I
"NeI Im
Figure 3-3 The work
flow
in the workshop version of CoAXsAs can be seen, the interaction starts from the middle part of the UI and then moves to the right first and then to the left. This works fine when a facilitator shows the procedures, however, that design poses serious challenges to the remote experience because it runs opposite to the more intuitive left-to-right one-way flow.
To simplify the whole process and improve the user experience, the number of steps is reduced to three in the remote version (Figure 3-4):
2. Click the update button or move the origin marker to invoke the travel time calculation;
3. Drag the time filter to see the change in the isochrones.
Edth configuration. Eery
07
3
Figure 3-4 The workflow in the remote version of CAXs
Specifically, we eliminated the route map and put all the route lines and isochrones into one map. This helps to get rid of two unnecessary map change steps. In addition, the user does not need to save the scenario and then select two scenarios to compare. In the remote version, CoAXs has a default baseline scenario which just includes the original route configuration. Every time the user changes the routes setting, the software will automatically create a new scenario and then compare it to the baseline scenario. This new design reduces the number of steps by
two. The most distinct improvement is that the user goes through the whole process from top to bottom on the main panel in the new version of CoAXs which is more intuitive for most
3.4 Online self-guided learning experience
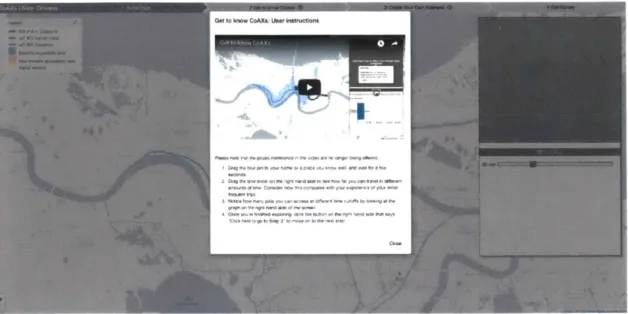
To help the user better understand how to use CoAXs, we added a brand-new feature in the remote version - a learning module which includes a navigation bar to show which step the user is on and two tutorial videos and tips to present the process step by step. The screenshot of tutorial component is shown in Figure 3-5 and Figure 3-6.
The learning module is a fundamental part for the remote version of CoAXs since that is the only way for the user to know what CoAXs is and how to use it. Moreover, it provides an opportunity to convey or advocate our idea and sense of value. So, the complete remote experiment involves the following procedure:
" Fill in entrance survey;
" Watch the "Get to know CoAXs" tutorial video and tips;
" Try to create the first baseline isochrones;
" Watch the "Create your own scenario" tutorial video and tips;
* Explore to revise route configuration and create new scenarios;
Figure 3-5 The screenshot of the "Get to know CoAXs" tutorial
Creeese your own -cnio -srisrcin
i.EW
Fiue36Tesr eshoe
at
ofe sethce
"ctr mea toe yoree
on senro uoraConsidering the tme constraintt
e- u
.to.ial videseo
yseae
une he iue ec n nysothe most essentil part of CoAes Furt
emoe,
hesnc onavigatiy~s
on
ba ttetpca epuesttrac therprgre and Tren stemnh of the nexteste when they sfeni tetcretne
Cosierngth te tmecosrant utril ieo ae ndr hre iuts ac Edlnm= so
the
~ ~
~ ~ ~ ~ ~ ~ ~~~
6 m1st 2seta ato o~.Frhroe h aiainbra h o a epuest3.5
Landing page
In the workshops, the facilitator spent more than 15 minutes to introduce the basic concepts of CoAXs and the backgrounds and assumptions behind the software. However, this introduction cannot happen in the remote version. Since CoAXs is a transit planning engagement toolkit for specific city contexts, letting participants know the current conditions of transit in their city is
important as well because it will help people better understand how CoAXs predicts and represents changes to the current transit network. To overcome this problem, a new landing page was developed to replace the job of the facilitator in introducing the basic idea of CoAXs. It includes the following parts:
" What's CoAXs;
* How it works;
* Detailed descriptions of the proposed transit routes and/or projects
" Sign in and sign up session;
" Research project sponsors;
* Contact and privacy and consent information.
To ensure users get this information before starting to use CoAXs, when they enter the website URL, they are directed to the landing page first. After going through all the materials there, they can easily click sign in or sign up to go to the next step.
3.6
Login session and random redirection
To experimentally compare the usability and performance of the accessibility and the point-to-point versions of CoAXs, we aimed to ensure a relatively even number of users of each version. In the face-to-face workshops, we simply randomly assigned the participants into two same size subgroups. In the remote approach, participants can use CoAXs at very different times, so we
needed to record their login information and redirect them, randomly, to either the travel time version or the point-to-point version to get a similar sample size of user groups of the two CoAXs versions. This process also ensures that the web log data collection session has the user name feature to record.
3.7 Incentive
In the remote version, we have no control over whether the participant will complete the entire intended exercise, including the surveys. This presents a severe problem for the whole project: How to push the user all the way to the end and prevent her from dropping out in the middle? This also has an impact on the valid sample size for our research. In this way, a reasonable incentive plays a big role in encouraging a participant to complete all the workflow. The experiment included a fifty-dollar gift card awarded to three participants via lottery; all people who finish the whole procedure were entered into the lottery. The login feature enabled the incentive lottery since it provides the email address and name for every unique user.
3.8 Growing with open source community
CoAXs is open source software hosted on Github. This means everyone can use CoAXs and even customize it for their own needs. This also means that CoAXs is built upon the open source community, especially the new remote version. We imported and used more than twenty packages from other people or institutions. Thus, growing with the whole open source community and taking advantage of it is a new challenge for CoAXs.
The first and most painful point is version control. Because all the packages we use are also evolving rapidly at the same, it is hard to keep them developing at the same pace to ensure everything works together well. The other issue is that the packages have very complicated cross-dependent relationships with each other which means that even small changes the code
or version in the package will magnify the consequences for and impacts on numerous other packages. This may cause a large amount of work in rewriting most of the involved code to make CoAXs work again.
With lessons learned in the previous development of CoAXs, for the remote version we tried to divide the whole of CoAXs into small modules and rewrite them into small components in different files instead of putting everything in one big file. Each module works for a single responsibility and they are managed in a nested structure. In this way, firstly, modularity increases code readability and lets other people in the open source community easily locate the file they want to customize. Secondly, the advantage for our team is that we just need to revise a small piece of a component when we update third-party packages. This helps reduce the time needed to deal with version control.
Another advantage of the experiment is that we did not need to use the latest and the fanciest techniques to develop CoAXs. Making it work and keeping it stable are the first objectives. Different packages have different requirements for the version of dependency framework underneath. Usually, new techniques have good performance but lack support for some older packages still in use. This means that there is a tradeoff between new techniques and
compatibility. Considering that everything is evolving, we cannot rewrite the code when every new package or technique comes out or is updated. It is important to lock down and fix a workable version for some period of time, like six months or one cycle of an experiment, and then later consider updating all the packages at once.
Besides the above points, another common difficulty of developing software in the open source community is the lack of documentation and technical support. In the open source world, most problems must be solved by without support. Sometimes, it is not clear how to use third-party
libraries or how to fix a bug when encountered. Exploring the example code provided by a third-party is a good way to learn how to use it. We also benefit from following their codebase and tech blogs which let us know breakthrough changes in their APIs and other evolutions of products.
4
Experiment overview
4.1
Introduction to the Boston workshops
The Boston workshops were our first implementation under Transit Center funding. For these workshops, we partnered with LivableStreets Alliance, an advocacy group in the Greater Boston area whose mission is supporting innovative and equitable transportation solutions that create
safe, affordable and convenient options for everyone in Metro Boston.4
The workshops focused on the following five corridors, with high passenger volumes and low bus speeds, identified by a MassDOT studyt to target for dedicated bus lanes and other priority measures:
" Mass Ave Boston;
* North Washington Street Bridge;
" Huntington Ave;
" Washington Street Forest Hills;
" Warren Street / Blue Hill Ave.
Each corridor includes three to eight bus routes which can be configured in CoAXs by the users in the workshops.
-LOW
F e ter e B n rsn
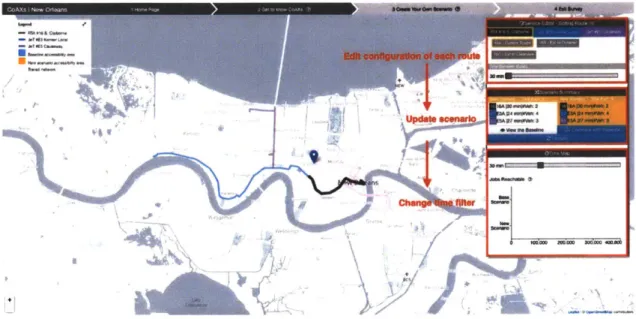
4.2 t r t
The GeaterNew O Fignsreg4-1Us inerfeigot pBston vterLsina uv CoAf ohs
scanelp improe) diloe nd.eron iprovto eaing trrassis in the region. Rd Newvrlasrsthelssn
public transit
in
this area is provided by multiple transit agencies in each parish separately, with few lines connecting the parishes, which hinders the accessibility of the residents. Furthermore, a new major job attraction hub is forming around Ochsner Medical Center. Thus, how to betterconnect Jefferson and Orleans parishes, particularly linking residents to Ochsner Medical Center, is a main question for Ride New Orleans.
Two official proposals have been put forward to improve the current bus network and to better connect the two parishes, one for a 2016 TIGER grant proposal by Jefferson Transit, and another in the Regional Planning Commission's (RPC) 2012 Comprehensive Operating Analysis (COA) of transit in Orleans and Jefferson parishes. The New Orleans version of CoAXs gave users the opportunity to explore these potential upgrades. The alternative combinations include RTA # 16
S. Claiborne (3 options), JeT # E3 Kenner Local (4 options) and JeT # E5 Causeway (2 options). For
each extension option, CoAXs enabled users to change the bus frequency from 6 minutes to 30 minutes. In order to visualize the cost of each upgrade, the number of buses needed for the scenario is presented beside the travel time savings, a proxy to give the user a sense of tradeoffs between the gains from the upgrade and the costs.
-- TA16s Cme A-CufaIbm
-- hT1SCI-e C- o .
-'"'"AT OE xMWg LKWa A - CDiIN ON*
,- JT3 Fj L4 C -
CDAb-Je xm ta D-umnnan1 0 1 2 3 4 km
.- JT 5 CaMWy A - C9m1M -- J.1 E caagt I -C...uIr Ed
Figure 4-2 The proposed extension for New Orleans
~e,,
4.3
Introduction to the Atlanta remote experiment
For the other remote experiment, In Atlanta, we partnered with Advance Atlanta, a citizen-driven grassroots advocacy coalition dedicated to building support for regional transit and championing existing transit resources. It brings public, business, and community stakeholders
6
together to pursue regional solutions to the transportation challenges facing the Atlanta region.
Advance Atlanta is currently interested in exploring the impacts of transportation investments that are being considered by the Metropolitan Atlanta Rapid Transit Authority (MARTA): nearly
$2.5 billion. The following eights projects (see the Figure 4-4) were selected to implement in
CoAXs:
* Campbellton Rapid Bus;
* North Side Drive Rapid Bus;
* Armour Station project;
" Boone Station project;
" Hulsey Krogg Station project;
* Mechanicsville Station project;
* Murphy Crossing Station project;
" Street Car Extension East to Beltline.
As shown in Figure 4-5, for the Atlanta version users are able to toggle each of these projects and see the potential impact on travel times and accessibility.
-- ..
t7..0
--
~71
1 1 2 3 4km
Wi..:G.L..--Figure 4-4 Map of selected projects in Atlanta
a N-S .7y &%Vowl CoMe Pa 4 Fur 4t A t J Amt,ILA fladmn Ja #4'h"
5 Data collection
5.1 Web log
Regarding data collection, for the Boston workshops, observation was done in person and through recordings of participant interactions and discussions. For the remote instances, however, a web log was developed to record the website user's interactions and operations. The web log runs in the background when the visitor enters the city-specific CoAXs website and sends the operation type and interaction tag into the backend database in real time. Table 5-1 list all the data tags recorded in the web log.
Table 5-1 The web log data schema
Description
The visitor's IP address
The browser type (Chrome, Safari, Firefox or IE) which the visitor is using Summary of how many users sign up for each city
The sign up email of each user. The operation type which includes: "start" (user starts the app)
"exit" (user exits and closes the app window) "moveOrigin" (user moves origin marker)
"moveDestination" (user moves destination marker) "updateScenario" (user clicks update button) The timestamp of the operation
[True or False] to indicate whether the user is in compare mode [True or False] to indicate whether the user is in point-to-point mode User email address
The city name
Indicates when the user exits the app, whether the user finishes the entrance survey, exit survey, and all the processes needed to complete. The latitude and longitude of origin marker
The latitude and longitude of destination marker The summary of the scenario
Data field IP address Browser user login type time isCompare ptp email city navState origin destination scenario
5.2 User survey
The survey focused on subjective aspects of use, which include satisfaction with CoAXs, its learnability and usability, and learning about transit planning concepts. To get a sense of changes before and after using the application, a user was to complete an entry and exit survey. Similar surveys were implemented for in the workshops and the remote applications. In this way, comparisons can be mode among the remote and workshop applications and the point-to-point and accessibility versions.
6 Experiment result
6.1
Enter times and active duration
For the remote experiments, 23 unique users visited the CoAXs website in total and we have 28 person-time records in the web log database. For comparison, 37 people participated in the Boston workshops, and 33 completed both the pre- and post-workshop surveys. As Figure 6-1 shown, we had 13 person-time uses for Atlanta and 15 for New Orleans. Clearly, the random redirection function worked well in the experiment: the sample size for the accessibility version and point-to-point version is almost even in both cities. This improves the comparability across the two versions. The accessibility version has a slightly higher proportion of users because one
of our partner employees used that version three times in order to do testing. We will eliminate those testing cases in the following sections.
16 14 12 6 10 6 8 6 4 2 0
Atlanta New Orleans
0 Total times of accessibility version U Total times of Point to point version
Table 6-1 Average number of enter times per user (n=23) New Atlanta Both Cities Orleans Point-to-point 1.00 1.00 1.00 version (1.00-1.00) (1.00-1.00) (1.00-1.00) Accessibility version 1.50 1.17 1.23 (0.95-2.05) (0.90-1.44) (0.91-1.55) Both Versions 1.27 1.08 (0.89-1.65) (0.82-1.24) Note: Values in parentheses are 95% Cl
Thanks to the login feature for the remote version of CoAXs, we can figure out how many times
the user uses CoAXs. Retention rate is a useful indicator of performance and a user's feeling about the website. The retention rate is calculated as the ratio of the number of retained or return users relative to the total unique number of visits. As the table above shows, no user returns back to use the point-to-point version again, meaning the participants of this version in both cities did not come back and try more manipulations or scenarios after their first use. By this metric, the accessibility version performed better. Three participants came back and used the accessibility version multiple times which lead to an average number of enter times greater than one. Furthermore, four users tried both the accessibility and point-to-point versions.
6 5 4 Cr C-) LL 2 1 0 200 400 800 1200 1600 2000 2400 2800 3200 More
Active duration (second)
Figure 6-2 Histogram of average active time
for
each userFigure 6-2 demonstrates how much time each remote user spent on CoAXs. Active time is the main metric to test how much time the user focuses on the web page, since it is natural that users may be distracted by other contents or pages on their browser while also logged into CoAXs. This key indicator will help us to identify a user's affinity with the application.
Most people use CoAXs for around 800 seconds, or 13 minutes. This result roughly meets our expectations, since 10 to 15 minutes is the amount of time which we designed for a user to go through a typical workflow. Nonetheless, six people focused on CoAXs for less than 400 seconds, or 6 minutes. These people most likely did not finish the tutorial because the tutorial videos last
6 minutes in total. This means more than one quarter of users may have found the tutorial
The other interesting finding is that the number of users who stayed on CoAXs for more than 50 minutes accounts for 17% of the total number of users. Since our workflow for a typical use takes just under 15 minutes, these users may have been idle at some points and kept CoAXs in the background before returning to continue. This phenomenon shows both the pros and cons of the remote version of CoAXs. On the one hand, it gives a user freedom to finish the
experiment whenever she wants and eliminates the time and space constraints. On the other hand, it may be hard to keep users concentrating on CoAXs which will hinder the performance of the experiment. 3500-Accessibility 3000 - Point to point 2500- 2000- 1500-1000 -500
-0
-Atlanta New Orleans
Figure 6-3 Average active time for each city
Figure 6-3 summarizes the average active time per user, for each city and each version. Clearly, the point-to-point version has much more active time for both cities. The active time for the point-to-point version is 41% higher than for the accessibility version for Atlanta and 115%
higher for New Orleans. This makes sense, at least in part, because the tutorial time is longer for point-to-point version to explain more about manipulation compared with accessibility version.
In terms of comparison between two cities, Atlanta has longer average active time for both the accessibility version and the point-to-point version, 42% more time in the accessibility case, but only slightly in the point-to-point version. Since the Atlanta CoAXs instance had a more
complicated network, the technical difference such as calculation time can explain part of this gap.
6.2
Drop out point
Drop out point means the step in which the user quit or closed the app. The drop out point is a good proxy for which stage in CoAXs use led the user to exit. Using this indicator, we can easily find whether the user finished the whole workflow designed for the remote version of CoAXs and the degree of completion.
Table 6-2 Operation category match up
Step in CoAXs Operation tag in web log
Step 1 entrance survey Start
Step 2 watch the first tutorial and move origin marker Move origin
Step 3 move destination marker (if in point-to-point version) Move destination
Step 4 watch the second tutorial and update the scenario Update scenario
Step 5 exit survey Exit
As shown in Table 6-2, in the web log we recorded all steps in the CoAXs workflow. In this way, we can get the drop out point by filtering the last operation before the user closed the CoAXs tab in the browser.
10 9 8 7 4 3 2 1 0
exit move Destination Move Origin Update Scenario
EAtlanta NNewOrleans
Figure 6-4 Drop out point
for
each cityIn Figure 6-4, we can see that 66% of users left CoAXs after filling in the exit survey, which is
good since it means that most went through the entire workflow and submitted the survey right
after the trial of CoAXs. In addition, no "start" tag appears as the last operation, which means
that no person closed CoAXs without doing anything. However, move origin ranks second as the
drop out point, appearing five times. The data reveal that most of those are return users;
typically, they finished all the required process and the survey, and then came back to move the
origin marker a couple of times more to try more isochrones in CoAXs. The case is similar for
"update scenario" and "move destination".
Regarding the difference between the two cities, they have exactly same number of people exit
after the survey. Nevertheless, New Orleans had many more participants leave CoAXs right after
"1move origin" or "update scenario". This is mainly because New Orleans had more return users as discussed above. The number of exiting after "move destination" remained low in Atlanta and
used the point-to-point version just once. In this way, users exit after filling in the survey and do not come back.
6.3
Operation timeline analysis
Before analyzing the characteristics of each type of operation, we need to have a general sense of how the user uses CoAXs. The interaction timeline in Figure 6-5 will help us see the typical usage pattern. Update Scenario Move Destination Move Origin Exit 0 U -- - U ~ 200 400 600 -- Accessibility version 800 1000 1200 1400
Point to point version
Figure 6-5 Interaction timeline for each user
Most users start with moving the origin marker with only one exception, who started with moving the destination marker. That user likely ignored the tutorial and that operation may cause a system error since CoAXs needs an origin first to run the travel time calculation. After the first step, the pattern diverts based on the version of CoAXs used. For the point-to-point version, the timelines jump back and forth between moving the origin and moving the
destination. The most important characteristic is that the interval between these series of operations leads to a dense timeline squeezing between moving origin and moving destination. This pattern results from a technical feature: no recalculation is needed for moving a destination because every time a user moves the origin, CoAXs calculates all the travel time for every possible destination. For the accessibility version, the user usually goes to the update scenario step after moving origin, but that takes much more time than moving the destination. Before exiting, people could do multiple scenario updates and changes of origin and then most people will be directed to the final survey and finish the experiment.
14 12 10 8 6 4 2 0 5 10 15 20 25 More
E Accessibility U Point to point
Figure 6-6 Histogram of the number of operations for accessibility and point-to-point version
Figure 6-6 reflects the histogram of the total number of operations for each user. The pattern varies considerably across the accessibility and point-to-point versions. Although the number of operations is below 20 for most users, for the accessibility version, 66% of users make fewer than five operations. In contrast, the peak for the point-to-point version appears at 10
moving the destination marker costs little time in the point-to-point version, so that the user makes more operations.
9 8 7 6 5 4 3 2
1
li1
1 1E1NU
0 5 10 15 20 25 MoreN New Orleans U Atlanta
Figure 6-7 histogram of operation times for each city
In terms of the comparison of the two cities, the users in Atlanta made fewer operations than those in New Orleans, apparently, with 67% participants having fewer than five operations, a value which decreses rapidly as the number of operations increases. The New Orleans case is very different. The bars representing the first three numbers of operations - 5, 10 and 15 times
- are nearly identical, which means more people interact with CoAXs intensively in New Orleans.
updateScenario 41% moveDestination 18% moveOrigin 41%
N moveDestination * moveOrigin 9 updateScenario
Figure 6-8 Percentage of each operation type for New Orleans.
updateScenario 14% moveDestination 40% moveOrigin 46%
m moveDestination n moveOrigin a updateScenario
Figure 6-9 Percentage of each operation type for Atlanta
Figure 6-8 and Figure 6-9 break down the operations by type and show the percentage for each city. The percentage of basic operations, like moving origin, is quite the same in both cities,
around 40 percent in total. But, in New Orleans 41% of operations were for updating scenarios
27 percent greater than in Atlanta. Inversely, moving the destination accounted for 40% of total
operation times in Atlanta compared to only 18% in New Orleans. At least two explanations exist. First, the percentage of point-to-point version users is a little higher in Atlanta which led to a larger share of people moving destinations. Secondly, the users in New Orleans seemed more willing to explore more scenarios in CoAXs.
Table 6-3 Number of Times a User Moves Origin
Atlanta New Orleans Both cities
3.00 3.72 3.29 Accessibility version (0.77 - 5.23) (2.56 - 4.88) (2.27 - 4.31) 3.80 3.71 3.46 Point-to-point version (1.15 - 6.45) (2.39 - 5.02) (2.37 - 4.55) 3.40 3.72 Both versions (2.13 - 4.67) (2.8 - 4.64)
Note: Values in parentheses are 95% CI
Regarding the characteristics of specific operation type, Table 6-3 shows the average number of times a user moves origin times per user. Since move origin is the basic operation which invokes the travel time calculation and isochrones re-rendering, it is a useful indicator for the intensity of and willingness for usage. Considering the two required moves for the tutorials, we can summarize that, on average, users are willing to move the origin more than once by themselves. This reveals some willingness of people to explore CoAXs after they finish the self-guided learning.
The conclusion from this city-level analysis is largely consistent with the analysis above. The users in New Orleans are more active than in Atlanta, moving origins about 0.32 times more, on
average. The point-to-point version inspires users to change the origin to see the resulting travel time variation, especially in Atlanta.
Moving a destination is a subsidiary operation, attached to moving the origin. This is because a user cannot see the travel time change by only changing the destination marker, since CoAXs needs to calculate the stop tree which is invoked by the moving origin operation. In this way, talking about moving destination without changing the origin is meaningless. However, the ratio of moving origin to moving destination can help us understand the relationship between these two interdependent operations. This ratio is 2.61 in Atlanta, double New Orleans' 1.22.7 This suggests that, in the point-to-point version, participants in Atlanta may be more likely to see travel time changes with different destinations.
6.4 Survey results
Whether a participant can learn how to use CoAXs is a key question we want to answer. The new UI and learning tutorial were designed to help users understand the concepts behind CoAXs. The main improvement is a simplified workflow while minimizing the tutorial duration because an online user likely would have less patience and/or attention than a workshop participant. The survey included a statement - "I found CoAXs unnecessarily complex" - for which stated agreement/disagreement was intended to evaluate the usability of CoAXs. A participant could respond with one of five categories - Strongly disagree, disagree, neutral, agree, strongly agree. With the weblog functionality, we are able to link an individual's survey responses to her interaction characteristics. Figure 6-10 shows the relationship between
individual's degree of agreement with the usability statement and the average time using CoAXs. 3500 -3000 -2500 - 2000- 1500- 1000- 50 0-0 0
Strong.Disagree Disagree Neutral Agree Strong.agree
Figure 6-10 The average use time according to reported complexity of use (Response to statement: "I found CoAXs unnecessarily complex.")
In general, the somewhat observable trend is that users who found CoAXs to be less complex used it more. Notably, the participants who strongly agreed that CoAXs is unnecessarily complex used it for less than 300 seconds, meaning they had a high probability of not finishing even the tutorial, since the whole learning process lasted more than 420 seconds (7 minutes). For those who disagreed and strongly disagreed with CoAXs being complex, most used CoAXs for over 800 seconds, or 13 minutes, which indicates that most of these people not only finished the required learning process but also created more than two scenarios in the experiments. This result has at least two explanations. Perhaps, if users invest time in using CoAXs and go through the entire tutorial and tips, they can learn how to use CoAXs and feel it is not too hard process.
Alternatively, those that were less inclined to find CoAXs complex (e.g., more 'computer savvy') simply used it more.
25
-20
-
15-10
-
5-Strong.Disagree Disagree Neutral Agree
Figure 6-11 The average number of user operations according to reported ease of learning (Response to statement: "I would imagine that most people would learn to use CoAXs very
quickly")
Figure 6-11 shows the relationship between usability (responding to statement regarding ease of learning) and the number of operations. The main trend is that those who conducted more operations also thought that most people would be able to learn how to CoAXs quickly.
6.5
Remote versus workshop approaches
Turning now to a comparison of the remote versus workshop-based approaches to using CoAXs, as seen in Figure 6-12, participants in the workshops evaluated the tool's usability more
positively than those who used the remote version. For the "easy to use" statement, 25% of remote participants "disagreed" or "strongly disagreed" while the corresponding number is 15% for workshop participants. Interestingly, however, a higher share of remote users "strongly
Strong.agree
agreed" with CoAXs' ease of use, which holds some promise for remote applications. If users can overcome the initial learning hurdle, and become familiar with CoAXs, they will find the tool easy to use, and remote applications may even facilitate this. Responses to the statement regarding whether CoAXs is "unnecessarily complex" are strongly consistent with the results regarding perceived ease of use.
Better understanding the meaning and implication of these results would require more information on the individual respondents. For example, the remote versions may have attracted a sub-group of particularly tech-savvy users who found it easy to use and/or public transport enthusiasts who spent the time and effort to learn how to use the tool. These results could be interpreted to show the importance of having a facilitator and in-person experience to target the "mainstream" user, while allowing a remote option for those more inclined towards online learning. Overall, the usability performance of the remote version is still worse than the workshop version. Since public transportation typically consists of a complex network and
related representational tools and concepts can be complicated, it may simply be too hard to teach the concepts and assumptions via an online tutorial, especially considering the time constraint. Although we redesign the UI and simplify the whole workflow,
Strongly Agree 33% Agree 25% Neutral 25% 16% Disagree 17% Strongly Disagree 8% 0% Strongly Agree Agree 10% 20% 30% 40%
M Workshop version U Remote version
I thought CoAXs was easy to use
17% Neutral 2% 21% Disagree Strongly Disagree
-
6%17%
0% 10% 20% 30% 40%* Workshop version U Remote version
I found CoAXs unnecessarily complex
Figure 6-12 Usability Comparison between remote version and workshop version 53% 50% 60% 63% 50% 60% 70% M M"O 8%
Strongly Agree Agree Neutral Disagree Strongly Disagree 3%
-
8%
-
33%
25% 24% 25% M 36% 33A 8%/ 0% 5% 10% 15% 20% 25% 30%N Workshop version U Remote version
CoAXs prompted me to think about alternatives for my own travel
35% 40%
52% Strongly Agree 33% 39% Agree
3%
6% Neutral 6% 13% Disagree 17% 0% Strongly Disagree 0% 0% 10% 20% 30% 40% 50% 60%N Workshop version U Remote version
CoAXs helped me imagine what travel is like for others
Figure 6-13 Imagination comparison between remote version and workshop version A final educational performance metric of interest is whether CoAXs inspires one's imagination
or her thinking about her own travel or others' travel. As for an individual's own travel, the remote version seems to work fine, with the answers quite similar for both versions. For thinking about other's travel, however, the remote version performs worse than workshop version. Specifically, no workshop participant disagreed or strongly disagreed with the statement "CoAXs help me imagine what travel is like for others;" 17% of remote participants disagreed with this statement, however. At the same time, the majority of workshop
participants strongly agreed with this statement, while just one-third of remote participants did. This is likely due to the lack of interpersonal communication in the remote approach. In the workshops, users use the tool together, watching each others' interactions and discussing each others' experiences and assumptions, while remote users finish all the process by themselves.
The workshop approach used has a higher likelihood of generating some empathy for others, making it more vivid for participants to know about other people's travel experiences.