HAL Id: hal-01427372
https://hal.sorbonne-universite.fr/hal-01427372
Submitted on 5 Jan 2017HAL is a multi-disciplinary open access archive for the deposit and dissemination of sci-entific research documents, whether they are pub-lished or not. The documents may come from teaching and research institutions in France or abroad, or from public or private research centers.
L’archive ouverte pluridisciplinaire HAL, est destinée au dépôt et à la diffusion de documents scientifiques de niveau recherche, publiés ou non, émanant des établissements d’enseignement et de recherche français ou étrangers, des laboratoires publics ou privés.
Taking the brakes off the learning curve
Freja Gheysen, Gabriel Lasne, Mélanie Pélégrini-Issac, Genevieve Albouy,
Sabine Meunier, Habib Benali, Julien Doyon, Traian Popa
To cite this version:
Freja Gheysen, Gabriel Lasne, Mélanie Pélégrini-Issac, Genevieve Albouy, Sabine Meunier, et al.. Taking the brakes off the learning curve. Human Brain Mapping, Wiley, 2016, �10.1002/hbm.23489�. �hal-01427372�
Taking the brakes off the learning curve
Freja Gheysen*1,2, Gabriel Lasne*3, Mélanie Pélégrini-Issac3, Genevieve Albouy4,5,6, Sabine Meunier7, Habib Benali3, Julien Doyon4,5, Traian Popa7* equal contribution
1 Ghent University, Department of Movement and Sport Sciences, Ghent, Belgium. 2 Ghent University, Department of Experimental Psychology, Ghent, Belgium.
3 Sorbonne Universités, UPMC Univ Paris 06, Inserm U1146, CNRS UMR7371, Laboratoire d’Imagerie Biomédicale, Paris,
France.
4 University of Montreal Geriatric Institute, Functional Neuroimaging Unit, Montreal, Quebec, Canada. 5 University of Montreal, Department of Psychology, Montreal, Quebec, Canada.
6 Movement Control and Neuroplasticity Research Group, Kinesiology Department, KU Leuven, Leuven, Belgium.
7 Institut du Cerveau et de la Moelle Épinière (ICM), UPMC Univ Paris 06 UMR S975, Inserm U1127, CNRS UMR 7225, Paris,
France.
Running title: Accelerated motor learning
Corresponding Author’s present address: Traian Popa, MD, PhD
Human Motor Control Section
National Institute of Neurological Disorders and Stroke National Institutes of Health, Building 10, Room 7D42 10 Center Drive, Bethesda, MD 20892-1428, USA Tel: 301-594-5406
Fax: 301-480-2286
Abstract
Motor learning is characterized by patterns of cerebello-striato-cortical activations shifting in time, yet the early dynamic and function of these activations remains unclear. Five groups of subjects underwent either continuous or intermittent theta-burst stimulation of one cerebellar hemisphere, or no stimulation just before learning a new motor sequence during fMRI scanning. We identified 3 phases during initial learning: one rapid, one slow, and one quasi-asymptotic performance phase. These phases were not changed by left cerebellar stimulation. Right cerebellar inhibition, however, accelerated learning and enhanced brain activation in critical motor learning-related areas during the first phase, continuing with reduced brain activation but high-performance in late phase. Right cerebellar excitation did not affect the early learning process, but slowed learning significantly in late phase, along with increased brain activation. We conclude that the right cerebellum is a key factor coordinating other neuronal loops in the early acquisition of an explicit motor sequential skill.
Key words: basal ganglia, cerebellum, explicit sequence learning, functional MRI, theta-burst stimulation
Introduction
Motor memory can be defined as “a representation of motor action in all of its forms, from skeletal movement to language, which is acquired through practice or experience” (Fuster 1999). Learning a new motor skill, and the acquisition of a novel sequence of movements in particular, is a highly complex phenomenon that involves multiple interconnected structures like the primary motor cortex (M1), supplementary motor area, basal ganglia, cerebellum, and hippocampus (Karni et al. 1998; Hikosaka et al. 2002; Doyon et al. 2003, 2009; Doyon and Benali 2005; Lehéricy et al. 2005; Albouy et al. 2008, 2013; Coynel et al. 2009). Learning of a new motor sequence typically follows several stages: (i) a “fast” learning period, i.e. an initial, within-session improvement period, followed by (ii) a period of consolidation lasting several hours, which assures the transition towards (iii) a “slow” learning period, consisting of delayed, incremental gains in performance emerging after continued practice (Karni et al. 1998). Here we have concentrated only on the initial, fast learning period.
Studies have shown that the cerebellum is particularly active during this fast learning phase (Jenkins et al. 1994; Jueptner and Weiller 1998; Toni et al. 1998; Middleton and Strick 2000; Hikosaka et al. 2002; Penhune and Doyon 2005) – an activity that fades out with practice, only to become undetectable when the sequence of movements is well learned (Toni et al. 1998; Doyon et al. 2002, 2009; Penhune and Doyon 2002). Most motor learning studies report consistent changes within both cerebellar hemispheres, whatever the hand used for executing the task (for extensive literature review refer to (Lohse et al. 2014) and (Hardwick et al. 2013)), particularly in the very early stages of learning when decreased activation of the cerebellar cortex matches increased cerebellar nuclear activity (Doyon et al. 2003; Floyer-Lea and Matthews 2005). At the same time, basal ganglia, particularly the putamen, are reported to be active throughout all learning stages. Yet, there seems to be a predominant activity shift within the basal ganglia during motor learning from the anterior, associative striatum to the posterior, sensorimotor striatum during learning of a motor sequence through repetition (Lehéricy et al. 2005; Coynel et al. 2009). However, it is still unclear how the cortico-striatal and cortico-cerebellar loops interact during the acquisition of a new motor skill.
Here we investigated the activity in these different loops with fMRI, after specifically interfering with the output of each cerebellar hemisphere separately in four groups of healthy right-handed subjects engaged in learning a new explicit motor sequence. We took advantage of the capacity of the repetitive transcranial magnetic stimulation patterned as theta-burst stimulation (TBS) to specifically alter the excitability of the cerebellar cortex over at least 30 minutes (Popa et al. 2010). TBS of the cerebellum is also known to modulate the plasticity of remote structures with which the cerebellum is connected: intermittent TBS of the cerebellum (iTBSCB) blocks the remote heterosynaptic plastic response of M1, while continuous TBS of the cerebellum (cTBSCB) enhances it (Popa et al., 2013; Kishore et al., 2014). Based on these findings and for the sake of simplicity of the discussion, we will assume that iTBSCB has a generally excitatory effect on the cerebellar output, while cTBSCB has an inhibitory effect on the cerebellar output. However, unless the exact
mechanisms of action of cTBS or iTBS on the cerebellum are known at a cellular or micro-circuit level, these generalizations should be considered only provisionally.
Another unresolved aspect is whether the effect of modulating the cerebellar output is purely anatomically lateralized (stimulation of one cerebellar hemisphere influences only the contralateral M1 and thus only the ipsilateral hand), functionally lateralized (stimulation of one cerebellar hemisphere impacts a particular lateralized function), or distributed over both
hemispheres (stimulation of either hemisphere has the same effects). A recent meta-analysis of the literature (Hardwick et al. 2013) suggested that motor sequence learning done with either hand involves non-exclusively the right cerebellar hemisphere. In the present study, we instructed participants to use their non-dominant (left) hand, because this leads to greater changes than when the motor task is executed with the dominant hand. Thus, if the anatomical lateralization hypothesis were true, we would expect a major influence of the left cerebellar stimulation on learning using the left hand only, whereas if the functional lateralization hypothesis were true, we would expect a major influence of the right cerebellar stimulation.
By applying iTBSCB or cTBSCB, over the left or right posterior cerebellar hemispheres, in four age- and gender-matched groups of subjects, we independently increased or decreased the
contribution of each cerebellar hemisphere to the neural network involved in the motor sequence learning task. Any change should be particularly evident in the initial period of the motor learning, when the interactions between the motor cortices, the cerebellar structures, the basal ganglia, and the hippocampus are most prominent (Hikosaka et al. 2002; Floyer-Lea et al. 2005; Doyon and Benali 2005; Albouy 2008, 2012, 2013; Doyon et al. 2009; Steele & Penhune 2010; Censor et al. 2012). Indeed, previous studies of explicit motor sequence learning have reported increase in performance reaching a plateau within approximately 15 min from the start of the motor practice (Albouy et al. 2012), enough to be covered by the maximum effect of TBS (Popa et al. 2010). We scanned our subjects during this time window, while learning the motor sequence right after the TBS of the cerebellum. We hypothesized that if the cerebellum does influence motor learning in the same way it modulates the heterosynaptic plasticity of M1, then cerebellar excitation would prevent or slow down the acquisition of a new motor sequence, while cerebellar inhibition would enhance it when compared to the learning pattern of a non-stimulated, control group.
Material and methods
Subjects:
Seventy-three right-handed, healthy volunteers were initially recruited to participate in this study. A preliminary interview ascertained that they had no significant history of psychiatric or neurological disorders. Musicians and professional typists were excluded to avoid subjects with pre-existing high finger coordination skills. All subjects gave written informed consent according to the guidelines of the ethical committee of the “Regroupement Neuroimagerie Québec” at the “Centre de Recherche de l’Institut Universitaire de Gériatrie de Montréal (CRIUGM)”, Montreal, QC, Canada, and were compensated for their participation in the study. Participants were distributed into four groups, which randomly underwent continuous theta-burst stimulation of the left (LcTBSCB group, N=16) or right (RcTBSCB group, N=19) cerebellar hemisphere, or intermittent theta-burst stimulation of the left (LiTBSCB group, N=16) or right (RiTBSCB group, N=22) cerebellum. Results were compared with those of a control group of 55 right-handed, healthy volunteers (from a previous study, see Albouy et al. 2015), who executed the exact same motor sequence learning task under identical fMRI scanning conditions, but without prior stimulation of the cerebellum. Data from nine subjects were excluded from the analyses for the following reasons: three participants were discarded from the RiTBSCB group due to technical difficulties (i.e. the motor threshold was too high to consider the stimulation efficient even at the maximum intensity allowed), while six additional participants (one from the RcTBSCB group, one from the LcTBSCB group, one from the LiTBSCB group and three others from the control group) were considered outliers based upon their motor learning performance (i.e. 2 standard deviations away from the average group changes in speed performance, see below). Data analyses were therefore carried out on the remaining one hundred and nineteen participants: 15 in the LiTBSCB group (mean age: 24.4 ± 3.1 years, 8 females), 15 in the LcTBSCB group (mean age: 24.9 ± 2.6 years, 8 females), 19 in the RiTBSCB group (mean age: 24.6 ± 2.3 years, 12 females), 18 in the RcTBSCB group (mean age: 23.3 ± 4 years, 10 females), and 52 in the control group (mean age: 24.2 ± 3.5 years, 33 females).
Motor sequence learning task:
Participants performed a sequential finger-tapping task with their non-dominant (left) hand (initially proposed by Karni et al. 1998). They were instructed to tap continuously a five-element finger sequence (4-1-3-2-4; 1 being the index finger) as fast as possible while making as few errors as possible using an MRI-compatible response box. This experiment was realized using Cogent 2000 developed by the Cogent 2000 team at the FIL and the ICN, and Cogent Graphics developed by John Romaya at the LON at the Wellcome Department of Imaging Neuroscience. From the start,
participants explicitly knew the sequence as they were told the sequence structure by the experimenter, but had to refrain from any practice before scanning. The task comprised 14 successive training blocks. Each training block consisted of a fixed number of key presses (i.e., 60 movements corresponding optimally to 12 repetitions of the sequence) to control for the number of finger movements (and hence, cerebral responses) per block. Each training block started with a green cross, displayed in the middle of the screen and indicating that participants had to produce the sequence. Once they had completed 60 key presses, the training block automatically switched to a 15-second rest block (indicated by a red cross on the screen). Both the time and accuracy of the transition between two consecutive key presses were recorded. Given the explicit knowledge of an easy and short sequence, speed improvement rather than accuracy was expected to reflect learning. Experimental procedure
First, a high-resolution anatomical T1-weighted scan was acquired using the 3T MRI system (see below for more details) installed in the “Unité de Neuroimagerie Fonctionelle” at the CRIUGM. The magnetic stimulations were then carried out with a Magstim Rapid2 magnetic stimulator and a figure-of-eight AirFilm coil with a 70-mm loop diameter (Magstim Company, Withland, UK). The active motor threshold (AMT) of M1 was determined for each participant, using cortical
representation of the first dorsal interosseus muscle. The AMT was the lowest stimulus intensity able to elicit a motor response of 200 μV above the background EMG level in at least 5 out of 10 trials, while the muscle was isometrically contracted at about 10% of the maximum voluntary contraction force. The repetitive stimulation was performed under neuronavigated control using a frameless
stereotaxic system (Brainsight™2, Rogue Research Inc., Montreal, Canada) at 80% AMT stimulation intensity. The proper location of the target, i.e. lobule VIII (Popa et al, 2013), was identified for every participant based upon his or her own high-resolution T1-weighted anatomical MRI (in our cohort of subjects, the target areas were centered around x=28±8, y=-79±5, z=-53±7 for the right cerebellar hemisphere, and x=-22±9, y=-80±4, z=-50±8 for the left). The coil was positioned tangential to the skull over the back of the head with the handle pointing upwards (Ugawa et al. 1995), in such a way as to minimize the distance between the center of the coil and the cerebellar target. One of the following two stimulation protocols was then administered: (i) inhibition of the cerebellar cortex was obtained with cTBSCB, which consisted of 600 stimuli delivered in 3-pulse bursts at 50 Hz repeated every 200 ms (Huang et al. 2005); (ii) excitation of the cerebellar cortex was obtained with iTBSCB, which consisted of 600 stimuli delivered in 3-pulse bursts at 50 Hz, repeated every 200 ms in 2-second trains separated by 8-2-second pauses. Importantly, the stimulation intensities used in this study were well below the maximum limit recommended by the guidelines for delivering TBS (Rossi et al. 2009).
The cerebellar stimulation was immediately followed by functional MRI acquisition during performance of the motor sequence-learning task. The mean time between the end of stimulation and the start of the fMRI task did not differ between the four groups undergoing cerebellar
conditioning (F(3,63)=1.05, p=0.38): the LiTBSCB group (503 ± 55 seconds),the LcTBSCB group (528 ± 73 seconds),the RiTBSCB group (493 ± 100 seconds), and the RcTBSCB group (482 ± 65 seconds). Behavioral data analyses
Motor sequence learning is generally defined as a reduction in response time (i.e. the transition time between two key presses) and number of errors across training (Doyon et al. 2009). Accordingly, across all training blocks, we measured for each subject the changes in the number of correct key presses per block and the changes in mean transition time per block between two
consecutive correct key presses. More specifically, as all groups demonstrated similar performance in the first block of trials in terms of accuracy (F(4,120)=0.45, p=0.77) and speed (F(4,120)=1.08,
[100*(performanceblock_1 – performanceblock_i)/ performanceblock_1]. Repeated measures analyses of variance (ANOVA) were then applied on these normalized data (accuracy and speed), with block as a within-subjects factor and group as the between-subjects factor. Greenhouse-Geisser corrections of p-values were applied whenever the assumption of sphericity was violated (but all repeated
measures effects are reported with the initial degrees of freedom).
Behavioral data were first analyzed including all 14 blocks and all 5 groups to determine group differences in motor sequence learning across the entire experimental task. In a second step, a sliding-window method was used on the results of the control group to identify significantly different phases within the 14-block series of non-manipulated task performance. Bonferroni-corrected t-tests were used to correct for multiple testing within these sliding-block analyses. First, one-sample t-tests (N=13) were performed to determine the point beyond which the learning speed showed no further significant improvement from block to block (blockn - blockn-1). Next, we examined whether another significant change of performance was apparent by performing multiple pairwise t-tests between block-windows of variable length. Once these different phases in learning performance were defined, as a last step, repeated measures ANOVAs were performed (with block as a within-subjects factor and group as the between-subjects factor) to further specify the performance differences between all 5 groups for each phase separately. Whenever a repeated measures ANOVA revealed a significant difference in learning rate (i.e., a significant block x group interaction effect), a regression analysis for repeated measure designs (Lorch and Myers 1990) was implemented: linear slope coefficients were computed for each subject based on the normalized data with training blocks as predictor (cfr. Gheysen et al. 2009). If a significant group effect was found, pairwise comparisons (Bonferroni-corrected) were then performed between the groups of interest: LiTBSCB vs Control, LcTBSCB vs Control, RiTBSCB vs Control, RcTBSCB vs Control, LiTBSCB vs LcTBSCB and RiTBSCB vs RcTBSCB. MRI data acquisition
Images were acquired with a whole body 3T Tim Trio scanner system (Siemens, Erlangen, Germany) equipped with a 32-channel head coil. Head movements were minimized using foam padding within the head coil. Anatomical images were collected using a T1-weighted 3D
magnetization-prepared rapid acquisition with gradient echo (MPRAGE) sequence (TR = 2300 ms, TE = 2.98 ms, TI = 900 ms, FA = 9°, 176 slices, FoV = 256×256 mm², matrix size = 256×256×176, voxel size = 1×1×1 mm³). Multislice T2*-weighted functional MRI series were obtained with a gradient echo-planar sequence using axial slice orientation (TR = 2650 ms, TE = 30 ms, FA = 90°, 43 transverse slices, 3 mm slice thickness, 10% inter-slice gap, FoV = 220×220 mm, matrix size = 64×64×43, voxel size = 3.4×3.4×3 mm). Slices were acquired along the z-axis in ascending direction.
Functional MRI data analyses
Functional MRI data preprocessing and analyses were performed using MATLAB (The MathWorks, Inc., Natick, MA, United States) and the SPM8 software (Wellcome Department of Cognitive Neurology, London, UK; http://www.fil.ion.ucl.ac.uk/spm/software/spm8/). Preprocessing steps included the realignment of functional time series (providing estimates of rigid head motion), the co-registration of functional and anatomical images, the spatial normalization to the Montreal Neurological Institute template, as well as a spatial smoothing using an isotropic 3D Gaussian kernel of 8 mm full-width at half-maximum.
Whole-brain fMRI time-series were analyzed to explore regional differences in motor learning-related brain activation between the inhibitory, excitatory and no stimulation groups. First, a fixed-effect general linear model (GLM) was defined for each participant including the motor sequence training blocks and the linear modulation by speed improvement (i.e., the individual normalized mean transition time between two consecutive correct key presses per block).
Consistent with behavioral analyses (see behavioral results section) we defined a separate regressor to account for the early (blocks 1-3), mid (blocks 4-9), and the late phase (blocks 10-14) of motor sequence learning. The regressors were modeled as boxcars for each block and convolved with the canonical hemodynamic response function. Response errors and head motion parameters were entered into the GLM and modeled as covariates of no interest. High-pass filtering with a cutoff of 128 s was implemented to remove low-frequency drift. Serial correlations in fMRI signal were estimated using an autoregressive (order 1) plus white noise model and a restricted maximum likelihood algorithm. Model parameters were estimated and used for single-subject contrasts. Linear
contrasts tested the effect of modulation of brain activity by performance, i.e., regions where BOLD signal increased as speed improved for the early, mid, and late phase separately.
Then, to allow for inference at a population level, single-subject contrasts were entered in random-effects analyses using one-sample Student’s t-tests (to characterize separate group effects) and ANOVAs (to characterize between-group differences). The resulting whole-brain activation maps were first thresholded at pvoxel < 0.005 (uncorrected for multiple comparisons) to ensure the full extent of brain regions. The statistical inferences were then carried out by means of Monte Carlo simulations (3dClustSim, http://afni.nimh.nih.gov/pub/dist/doc/program_help/3dClustSim.html) to control for false positive rate at the cluster level. We ran 10,000 Monte Carlo simulations taking into account the whole-brain mask and the smoothness of the residuals of the second-level models. For the initial p<0.005 voxel-wise threshold, the simulations determined the minimum cluster size (for each second-level analysis) corresponding to a combined corrected threshold of p<0.05. To note, when testing for pairwise group differences in parametric effects using the SPM8 software (e.g., [+ cTBSCB group] – [+ iTBSCB group] = BOLD responses positively modulated by performance but stronger for the cTBSCB group than for the iTBSCB group), results can be confounded by the reverse parametric effect of the second group in the comparison (e.g., it could reflect [+cTBSCB] + [- iTBSCB] = BOLD responses positively modulated by performance in the cTBSCB group and responses negatively modulated by performance in iTBSCB group). Therefore, to truly isolate the effects of interest, additional exclusive masks were applied on these group contrasts with the default p<0.05 uncorrected voxel thresholds. These masks comprised the responses negatively modulated by performance resulting from the one-sample t-test of the second group in the respective group comparison.
Results
Behavioral results:
Learning accuracy
As expected, accuracy rates were overall high (LiTBSCB group= 98.3 ± 2%; LcTBSCB group= 99 ± 0.9%; RiTBSCB group= 98.7 ± 1.2%; RcTBSCB group= 98.8 ± 1%; Control group= 97.8 ± 3.5%). Repeated-measures ANOVA conducted on the normalized number of correct key presses, with block (14 levels) as within-subjects factor and group (5 levels) as between-subjects factor, revealed no significant changes in accuracy across blocks (F(13, 1482)= 1.28; p=0.22), groups (F(4,114)= 1.23; p=0.3), nor any group x block interaction (F(52, 1482)=0.64; p=0.98).
Learning speed
Repeated-measures ANOVA was performed on the normalized mean transition time, with block (14 levels) as the within-subjects factor and group (5 levels) as the between-subjects factor. The results revealed a significant increase in learning speed across blocks (main effect of block, F(13,1482)= 94.26; p<0.001), as well as a significant difference in average learning speed between groups (F(4,114)=2.9; p=0.026). Moreover, when a quadratic-trend (R2=0.47) applied on the block factor was included in the repeated measures ANOVA, in order to take into account the non-linear polynomial form of the learning curve across all blocks, the analysis yielded a significant block x group interaction (F(4, 114)=2.55; p=0.04). This suggests that groups differed in their abilities to learn a new motor sequence and did so at different rates. As shown in figure 1A, transitions between fast and slower rates of learning speed could be observed across the 14 blocks.
In order to further investigate whether different types of cerebellar stimulation influenced differently each of these phases, we performed pairwise comparisons (Bonferroni corrected) between block windows of average learning performances (blockn - blockn-1). One-sample t-tests (Bonferroni-corrected) showed significant increases in learning speed only from block 1 to 3 in the control group (blocks 1-2: t(51)=7.87, p<0.0001; blocks 2-3: t(51)=4.15, p=0.0016). These results reveal a first point of transition in the learning process between blocks 1-3 (first learning phase) and the remaining blocks (Figure 1A).
Next, we investigated whether the learning curve had another significant phase change over longer periods. To that end, we performed multiple pairwise comparisons of speed improvement between block-windows of variable length shifting progressively from block 4 to block 14 (e.g., a pairwise t-test computed on the speed improvement on blocks 4-6 vs blocks 7-14, then on blocks 5-7 vs blocks 8-14 and so on). The performance was averaged for each window of blocks and normalized by its standard deviation to control for the size of the window (e.g., the average speed improvement on blocks 4-6 divided by the standard deviation of speed improvement on blocks 4-6). A significant difference in performance was found between blocks 4-9 and blocks 10-14, t(102)=-2.7, p=0.008 (Figure 1A). This separated the second phase (blocks 4-9) from the third phase (blocks 10-14) of the motor sequence learning.
Figure 1. Behavioral results.
(A) Mean normalized transition times per block and per group, B) Mean linear slope coefficients of the normalized transition times per group across the early learning phase (blocks 1 to 3); * p<.05 (Bonferroni corrected). Bars represent standard error of the mean (SEM).
First phase
Within this faster linear-shaped learning phase, a 3 (block) x 5 (group) repeated-measures ANOVA revealed significant changes in learning speed across the first 3 blocks (main effect of block, F(2,228)= 207.7; p<0.001), with only a trend for the main effect of group (F(4,114)=2.17; p=0.077).
However, the repeated measures ANOVA with linear-trend on the block factor (R2=0.71) revealed a significant block x group interaction (F(4, 114)=2.77; p=0.03), hence suggesting that, as expected, the rate of improvement differed between groups in the first phase of motor sequence learning.
Subsequently, in order to determine which group was showing a different pattern of improvement, a regression analysis for repeated measures designs (Lorch and Myers 1990) was implemented: linear slope coefficients were computed for each subject based on the normalized transition time data with training blocks as predictor (Gheysen et al. 2009) (Figure 1B). During this first phase, the RcTBSCB group (slope= 12.98 ± 6.48) showed a significantly greater learning acceleration than the control group (slope= 8.57 ± 5.2, t(114)=2.94, p=0.024) and the RiTBSCB group(slope= 8.23 ± 5.47,
t(114)=2.70, p=0.048), but there was no significant difference in learning slope between the RiTBSCB and control groups (t(114)=-0.23, p=0.82). Interestingly, left cerebellar stimulation did not have any significant effect on early learning performance (LcTBSCB, slope= 8.62 ± 6.13, vs control, t(114)=0.03, p=1; LiTBSCB, slope= 10.87 ± 4.42, vs control, t(114)=1.43, p=0.93; LcTBSCB vs LiTBSCB, t(114)=1.13, p=1).
Second phase
A 6 (block) x 5 (group) repeated measures ANOVA over the second phase of motor sequence learning (blocks 4-9) revealed significant changes in learning speed across blocks (main effect of block, F(5,570)= 6.22; p<0.001), a significant difference in average learning speed between groups (F(4,114)=2.78; p=0.03), but no block x group interaction effect (F(20,570)=0.83; p=0.68). As expected from the results of the first phase, the average learning speed in the RcTBSCB group (30 ± 12.5%) was significantly higher than in the control group (learning speed = 21.9 ± 10.17, t(114)=4.16, p<0.001) and the RiTBSCB group(learning speed = 17.7 ± 14.6%, t(114)=5.23, p<0.001), but not between RiTBSCB and the control groups (t(114)=-2.16, p<0.19). Again, the left cerebellar stimulation did not yield any significant effect in performance in the second learning phase (LcTBSCB, learning speed = 20.8 ± 14.7%, vs control, t(114)=-0.5, p=1; LiTBSCB, learning speed = 21.7 ± 6.42%, vs control, t(114)=-0.07, p=1; LcTBSCB vs LiTBSCB, t(114)=0.34, p=1).
Third phase
Finally, a 5 (block) by 5 (group) repeated measures ANOVA over the third phase of motor sequence learning showed significant changes in learning speed across blocks (main effect of block, F(4,456)= 6.41; p<0.001) and differences in average learning speed between groups (F(4,114)=2.53;
p=0.044), but no block x group interaction (F(16,456)= 0.38; p=0.98). The RcTBSCB group still showed
an overall higher learning speed (34.4 ± 13.3%) than the control group (25.8 ± 11.13, t(114)=5.24, p<0.001) and the RiTBSCB group(21.4 ± 16.3%, t(114)=6.54, p<0.001). Importantly, in this third phase, performance of the RiTBSCB group in terms of average learning speed was now found to be
significantly lower than that of the control group (t(114)=-2.68, p=0.046). However, similar to the other two preceding phases, left cerebellar stimulation did not evoke any significant variation in learning speed during this phase (LcTBSCB = 25 ± 16.5%, vs control, t(114)=-0.40, p=1; LiTBSCB = 26 ± 8%, vs control, t(114)=0.12, p=1; LcTBSCB vs LiTBSCB, t(114)=0.42, p=1).
fMRI results
Control group:
Table 1 and Figure 2 present the clusters in which brain activity increased in proportion to performance improvement observed in the first, second, and third phases of motor sequence learning in the control group only (the single group effects for the other 4 groups can be found in Supplementary Table 1).
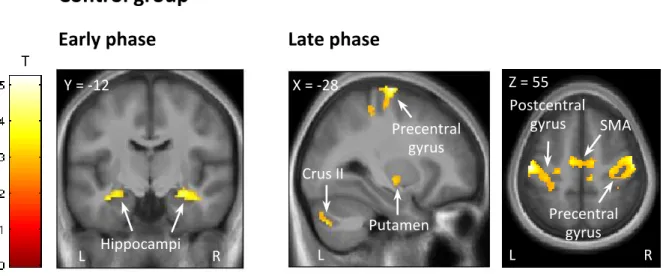
As previously reported in the literature, the hippocampus, striatum, cerebellum, motor cortex were recruited during the learning of a new motor sequence over 14 blocks. In our study, however, we found that the hippocampus was already recruited in the very first blocks in control subjects.
Figure 2. Functional imaging results of the non-stimulated control group.
Cluster-size Monte Carlo corrected maps (p<0.05, minimum cluster size=64 voxels) are displayed over the mean structural image of all subjects in the control group and show brain areas where responses increase in proportion to learning speed in the early phase (blocks 1-3; left panel) and late phase (blocks 10-14; right panel) of the motor sequence learning task.
Table1. Brain areas where responses increased in proportion to learning speed in the early, mid and
late phase of motor skill learning, for the control group. Only clusters that surpassed the minimum
volume threshold ensuring a false discovery rate of 5% are reported (number of voxels: k=64 for early
phase, k=67 for mid phase, k=65 for late phase). Peak coordinates within each cluster are labeled
according to the AAL atlas (Anatomical Automatic Labeling, Tzourio-Mazoyer et al. 2002).
Area Peak MNI coordinates
(x,y,z) Maximum Z–score Cluster size Early-phase: Right hippocampus 28 -12 -15 3.99 197 Left hippocampus -34 -12 -19 3.54 159
Mid-phase: no significant clusters
Right precentral gyrus 42 -24 65 4.22 1102
Left precentral gyrus -26 -14 73 4.60 644
Left pallidum -24 -8 -1 3.20 226
Left putamen -22 4 15 2.97
Left supplementary motor area -10 -12 55 3.35 196
Left cerebellum crus II -38 -70 -43 3.43 164
Left cerebellum lobules IV-V -14 -46 -19 3.52 141
Right supplementary motor area 4 4 71 3.50 71
--- Please insert link to Supplementary Table 1 here ---
Comparison between groups:
Within the ANOVA including all 5 groups, a first F-test explored any significant differences between any groups. Since this resulted in significant responses, two subsequent F-tests were performed to evaluate the possible differences between the left cerebellar stimulation and the control groups, and between the right cerebellar stimulation and control groups. Whenever the latter F-tests showed significant responses, follow-up t-tests were performed to specify the differential patterns of activations between pairs of groups. This procedure was used for the first, second, and third phases (Figure 3).
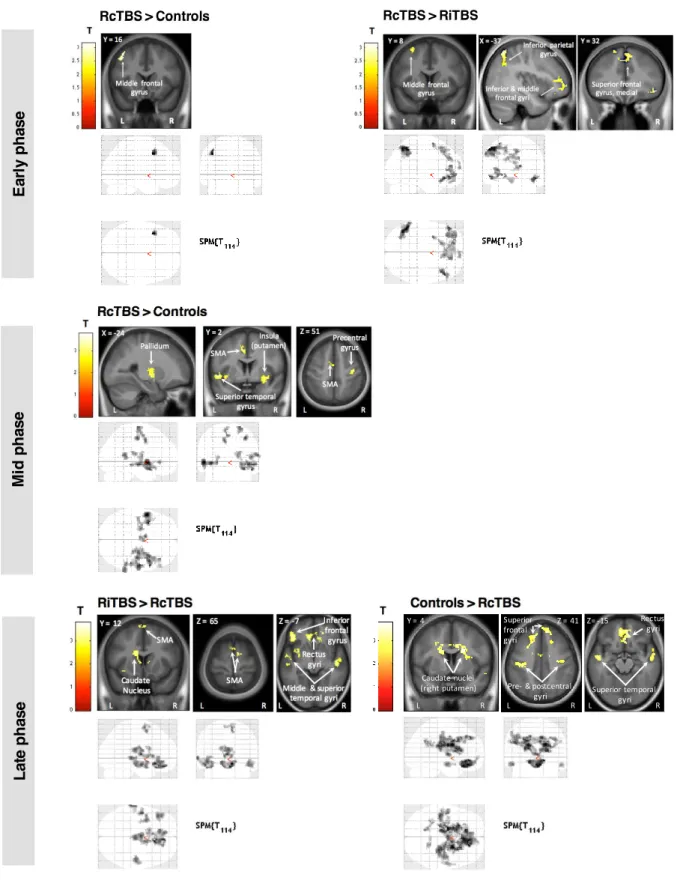
Figure 3. Functional imaging results of between-group differences.
Cluster-size Monte Carlo corrected maps (p<0.05, minimum cluster size=66 voxels for early, 78 voxels for mid and 80 voxels for late phase) are displayed over the mean structural image of all subjects and show brain areas where responses increase in proportion to learning speed in the early phase (blocks 1-3), mid phase (blocks 4-10) and late phase (blocks 10-14) of the motor sequence learning task.
First phase of early motor sequence learning
This analysis identified brain regions where responses increased in proportion to
performance speed in the first phase of motor sequence learning (i.e. the first 3 blocks). Significant main effects (F-test) were observed in RcTBSCB and LiTBSCB groups in this phase (Supplementary Table 1).
Table 2 presents the different t-tests performed in order to compare groups. Specifically, subjects undergoing RcTBSCB had higher activations in the left middle frontal gyrus than controls, and higher activations in the left inferior parietal gyrus, bilateral inferior, middle and superior frontal gyri, and anterior cingular cortex than subjects undergoing RiTBSCB.
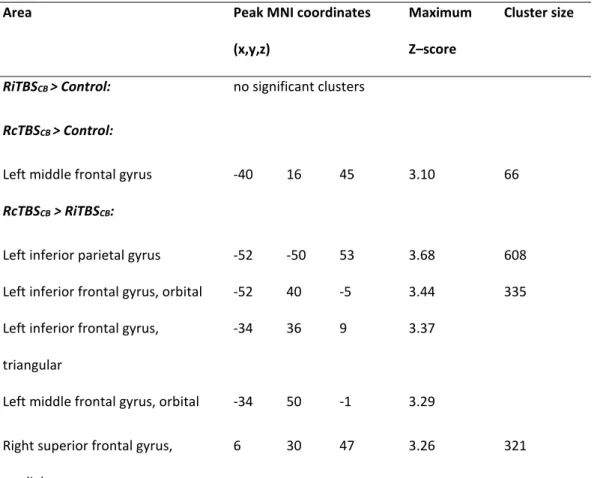
Table 2. Brain areas where responses increased in proportion to learning speed in one group
compared to another, in the early phase of motor skill learning. Only clusters that surpassed the
minimum volume threshold ensuring a false discovery rate of 5% are reported (number of voxels:
k=66). Peak coordinates within each cluster are labeled according to the AAL atlas.
Area Peak MNI coordinates
(x,y,z)
Maximum Z–score
Cluster size
RiTBSCB > Control: no significant clusters
RcTBSCB > Control:
Left middle frontal gyrus -40 16 45 3.10 66
RcTBSCB > RiTBSCB:
Left inferior parietal gyrus -52 -50 53 3.68 608
Left inferior frontal gyrus, orbital -52 40 -5 3.44 335
Left inferior frontal gyrus, triangular
-34 36 9 3.37
Left middle frontal gyrus, orbital -34 50 -1 3.29
Right superior frontal gyrus, medial
Left superior frontal gyrus, medial -2 36 35 3.08
Left middle frontal gyrus -30 8 63 3.21 154
Left superior frontal gyrus -18 24 49 3.15
Left rectus gyrus -6 46 -17 3.00 136
Left medial frontal gyrus, orbital -10 50 -11 2.95
Right inferior frontal gyrus, orbital 46 32 -9 3.52 119
Right anterior cingulum 14 44 17 3.24 68
Left anterior cingulum -4 44 7 2.70
Right superior frontal gyrus, medial
8 64 13 3.06 82
Left superior frontal gyrus, medial -4 60 27 2.65
RiTBSCB > RcTBSCB: no significant clusters
Control > RiTBSCB: no significant clusters
Control > RcTBSCB: no significant clusters
Second phase of early motor sequence learning
This analysis identified brain regions where responses increased in proportion to
performance speed in the second phase of motor sequence learning (i.e. blocks 4 to 10). Significant main effects (F-test) were observed in RcTBSCB and LiTBSCB groups in this phase (Supplementary Table 1).
Table 3 presents the different t-tests performed in order to compare groups. Specifically, both RcTBSCB and RiTBSCB groups showed stronger activations than the control group. In particular, the RcTBSCB group exhibited stronger corticostriatal and frontal activity with respect to controls, while the RiTBSCB group exhibited stronger activity in the inferior occipital areas than controls. The LiTBSCB group also exhibited stronger activations than LcTBSCB and controls groups, but given that no significant behavioral differences were found, these results will not be discussed further.
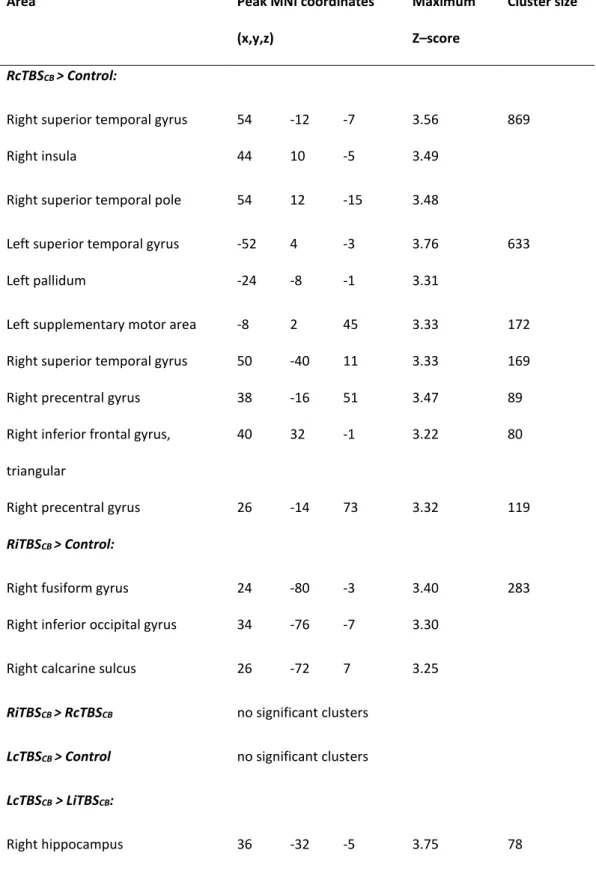
Table 3. Brain areas where responses increased in proportion to learning speed in one group
compared to another, in the mid-phase of motor skill learning. Only clusters that surpassed the
minimum volume threshold ensuring a false discovery rate of 5% are reported (number of voxels:
k=78). Peak coordinates within each cluster are labeled according to the AAL atlas.
Area Peak MNI coordinates
(x,y,z)
Maximum Z–score
Cluster size
RcTBSCB > Control:
Right superior temporal gyrus 54 -12 -7 3.56 869
Right insula 44 10 -5 3.49
Right superior temporal pole 54 12 -15 3.48
Left superior temporal gyrus -52 4 -3 3.76 633
Left pallidum -24 -8 -1 3.31
Left supplementary motor area -8 2 45 3.33 172
Right superior temporal gyrus 50 -40 11 3.33 169
Right precentral gyrus 38 -16 51 3.47 89
Right inferior frontal gyrus, triangular
40 32 -1 3.22 80
Right precentral gyrus 26 -14 73 3.32 119
RiTBSCB > Control:
Right fusiform gyrus 24 -80 -3 3.40 283
Right inferior occipital gyrus 34 -76 -7 3.30
Right calcarine sulcus 26 -72 7 3.25
RiTBSCB > RcTBSCB no significant clusters
LcTBSCB > Control no significant clusters
LcTBSCB > LiTBSCB:
LiTBSCB > Control:
Right medial frontal gyrus, orbital 12 50 -15 4.91 1255
Left rectus gyrus -10 22 -11 4.79
Left insula -36 10 -11 4.04 683
Left middle temporal gyrus -52 -24 -11 3.76
Left inferior frontal gyrus, orbital -46 38 -5 4.26 269
Left inferior frontal gyrus, triangular
-54 34 -1 3.82
Right inferior frontal gyrus, orbital 46 36 -7 3.37 179
Right middle temporal gyrus 62 -22 -7 3.31 125
LiTBSCB > LcTBSCB:
Right medial frontal gyrus, orbital 10 52 -15 4.50 1329
Right rectus gyrus 8 30 -19 4.16
Left superior temporal gyrus -48 -8 -15 4.24 858
Left insula -34 12 -13 3.95
Right middle temporal gyrus 58 -12 -21 3.85 288
Left superior frontal gyrus, medial -6 50 47 3.68 163
Left superior frontal gyrus -12 44 53 3.66
Right inferior frontal gyrus, orbital 48 36 -7 4.03 108
Control > RcTBSCB no significant clusters
Control > RiTBSCB no significant clusters
Control > LcTBSCB no significant clusters
Third phase of early motor sequence learning
This analysis identified brain regions where responses increased in proportion to
performance speed in the third phase of motor sequence learning (i.e. blocks 11 to 14). Significant main effects (F-test) were observed in RiTBSCB, LiTBSCB, and LcTBSCB groups in this phase (Supplementary
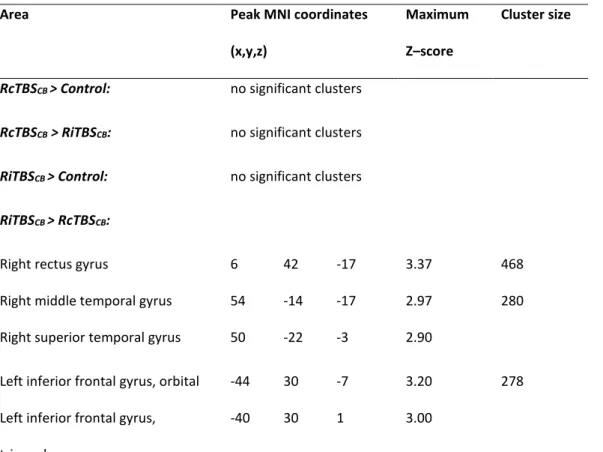
Table 1). Table 4 presents the different t-tests performed in order to compare groups. Specifically, no activation differences between the control group and the RiTBSCB group were observed. In this phase however, the RcTBSCB group showed bilateral lower brain activity than the control group in the caudate nuclei, superior temporal gyri, and middle cingular cortex, and lower brain activity than the RiTBSCB group in the rectus gyri, temporal lobes, and supplementary motor areas.
Table 4. Brain areas where responses increased in proportion to learning speed in one group
compared to another, in the late-phase of motor skill learning. Only clusters that surpassed the
minimum volume threshold ensuring a false discovery rate of 5% are reported (number of voxels:
k=80). Peak coordinates within each cluster are labeled according to the AAL atlas.
Area Peak MNI coordinates
(x,y,z)
Maximum Z–score
Cluster size
RcTBSCB > Control: no significant clusters
RcTBSCB > RiTBSCB: no significant clusters
RiTBSCB > Control: no significant clusters
RiTBSCB > RcTBSCB:
Right rectus gyrus 6 42 -17 3.37 468
Right middle temporal gyrus 54 -14 -17 2.97 280
Right superior temporal gyrus 50 -22 -3 2.90
Left inferior frontal gyrus, orbital -44 30 -7 3.20 278
Left inferior frontal gyrus, triangular
Left superior temporal pole -44 6 -19 3.10 179
Left caudate nucleus -6 18 5 3.18 120
Left middle temporal gyrus -66 -28 1 3.27 113
Left superior temporal gyrus -50 -4 -13 3.27 101
Right supplementary motor area 10 2 65 3.14 101
Left supplementary motor area -6 12 67 2.83
Control > RiTBSCB no significant clusters
Control > RcTBSCB
Left caudate nucleus -16 -4 25 3.54 2017
Right caudate nucleus 20 4 25 3.53
Right rectus gyrus 8 38 -15 3.47 826
Left postcentral gyrus -44 -20 37 3.14 289
Right superior frontal gyrus 14 42 41 3.37 156
Right superior frontal gyrus, medial
4 50 41 2.74
Right superior temporal gyrus 54 -10 -15 3.01 114
Right middle cingulum 6 -44 31 2.82 100
Left precuneus gyrus -14 -56 33 3.17 96
Left superior temporal gyrus -50 -6 -13 3.17 92
Discussion
In this study, we found that inhibition of the right cerebellar cortex enhanced the speed of acquisition of a new motor sequence performed with the left hand at the very beginning of the motor sequence learning, when compared to the control group. By contrast, excitation of the right cerebellar cortex lowered the speed of acquisition of a new motor sequence, especially in the third phase of the early motor sequence learning. Interestingly, only the right, and not the left cerebellar stimulation influenced the learning speed, despite the fact that the task was performed with the left hand in all instances, i.e. predominantly with the right motor cortex, which receives projections from the left cerebellum. This means that if stimulation of the cerebellum would have acted purely on the motor component of the sequence execution (Seidler 2002), then the left but not the right cerebellar stimulation should have had the biggest impact on performance. But this was not the case. It
suggests that, in our experimental setup, the cerebellar stimulation interfered only with those circuits responsible for sequence acquisition and not motor execution per se. The finding is
consistent with previous work in our laboratory, which has shown that these circuits may be distinct, and only partially overlapping (Orban et al. 2010).
Previous studies using both inhibitory and excitatory stimulation of the cerebellar
hemisphere reported impaired motor execution during non-repetitive, adaptation tasks (Miall and Christensen 2004; Miall et al. 2007; Galea et al. 2011; Jayaram et al. 2011; Li Voti et al. 2014; Cantarero et al. 2015; Herzfeld et al. 2014). This is not in contradiction with our own pattern of results, since different circuits might carry out the sensorimotor adaptation (in which online error monitoring is important) and the explicit sequence learning (in which extraction of the pattern is key). In fact, in our experiment, the error rate was close to zero and similar between groups, suggesting that the cerebellar stimulation did influence a more subtle mechanism of the sequence learning than just motor adjustment through correction of motor errors (Imamizu et al. 2000; van Mier et al. 2004). The present results are also in line with previous findings that parts of the right cerebellum might be specifically involved in the left-hand sequence learning process per se (Orban et al, 2010).
The analysis of the behavioral data in the control group revealed two major inflexion points in the learning curve: one after the 3rd block and one after the 10th block. Particularly, the
performance drastically increased during the first three blocks, only to turn to a much slower increase in blocks 4 through 10, before reaching an asymptotic level in the last 4 blocks. Most of the motor learning studies have investigated the acquisition and consolidation of a new sequence over large periods of time ranging from hours to days and even months (Doyon and Benali 2005; Lehéricy et al. 2005; Lungu et al. 2014; for a review see Hardwick et al. 2013). The 14 blocks used in our study can be considered as part of the initial motor sequence learning. Thus, to our knowledge, this is the first study to take a closer look at the different phases within this initial stage of motor sequence learning. Moreover, in the control group, the learning speed positively correlated with the BOLD signal in the two hippocampi in the first phase, only to shift to the precentral gyri bilaterally, left postcentral gyrus, left pallidus, left putamen, bilateral SMA, and left cerebellum in the third phase. These results are in line with our previous work showing an antagonistic pattern of activation between hippocampo- and striato-cortical networks in which the hippocampus is recruited early on during training, whereas activity in the striatum increases as a function of practice (see Albouy et al. 2013a for a review). This suggests that complex plastic phenomena occur within the first 14 blocks of acquisition of an explicit motor task that may condition the way in which the task is subsequently internalized and consolidated. Our results show that the hippocampus is significantly recruited already in the first 3 blocks (corresponding on average to the first 2 minutes of task performance, just before an abrupt slowing of the performance), which suggests that it might be responsible for the monitoring and labeling of a repeated movement sequence as a potentially meaningful program to be transferred to other structures for storage later on (Gheysen et al. 2010; Albouy et al. 2013a; Lohse et al. 2014; Davachi and DuBrow 2015). It was also proposed that the hippocampus might be in competition with the striatum (Albouy et al. 2008, 2015; Lungu et al. 2014) and that both the early recruitment of this structure, as well as the strength of its competitive interaction with the striatum influence subsequent motor memory consolidation (Albouy et al. 2008; 2013a; Steele and Penhune, 2010). Indeed, significant BOLD signal associated with the error-free repetition of the same motor
sequence moved to the cerebello-cortical and striato-cortical circuits towards the end of the practice period, in the third phase. This transfer is consistent with the fact that the striato-cortical circuit is involved in acquiring and maintaining the new motor skill (Penhune and Doyon 2002, 2005; Lehéricy et al. 2005; Ma et al. 2010). This relatively rapid transfer from the hippocampus towards the other cortico-subcortical loops opens the possibility of modulating their interaction by interfering with one or more nodes of the network – which we did by artificially modulating the cerebellar output.
First phase of early motor sequence learning
The improvement of performance speed was significantly higher after inhibitory stimulation of the right cerebellar cortex in the first phase. When comparing the fMRI BOLD contrasts between groups, this translated into a higher activation in the left middle frontal gyrus with respect to controls, and to a higher activation in the mainly left superior, middle and inferior frontal gyri, inferior parietal, and anterior cingulum with respect to the group that underwent right cerebellar excitation. In the light of previous literature, it is plausible that right cerebellar inhibition reduced the inhibitory control of the Purkinje cells on the cerebellar nuclei, and hence disinhibited the
glutamatergic projections towards the thalamic relays. Since the cerebellum projects massively through the thalamus towards the frontal areas (see Middleton and Strick, 2000 for review), this could have enhanced thalamic output towards areas sustaining the learning of a sequence and boosted their activation.
The middle frontal areas that appear more activated after right cTBSCB in our study are the same areas that have been described to be associated with verbal fluency and sentence processing (Homae et al. 2003; Tate et al. 2014; McAvoy et al. 2015) as well as constructive episodic memory (Addis et al. 2009). Indeed, during the post-scan debriefing, the subjects reported almost always utilizing a kind of internal-speech for guiding and remembering the sequence, especially when starting to practice (singing, counting, internal-speaking etc.). These brain responses could thus be interpreted as a more efficient use of the sequencing circuits shared with speech production, at least during the first phase of initial motor sequence learning. This model is in line with a recently
more basic motor circuits by complex processes under the pressure of evolution (Corballis 2015). In support of this hypothesis comes the observation that the circuits involved in spoken and in sign languages are strikingly similar, despite the evident differences in both input and output (Horwitz et al. 2003; Sandler and Lillo-Martin 2006; van der Lely and Pinker 2014). Also, mentally imagining the repetition of the motor sequence or verbally repeating the sequence seems to have similar positive effects on motor execution (Orban et al. 2008; Hétu et al. 2013; Saimpont et al. 2013). From this perspective, the processes of learning a motor sequence with the fingers or a verbal sequence would share the same circuits for internalizing and retaining the sequence. It is therefore reasonable to consider that at least some components of the motor sequence learning would use the same
lateralization as the production of speech (Murdoch 2009; Hardwick et al. 2013). Since the cerebello-cortical connections are strongly lateralized (Wang et al. J Nphysiol 2013; Simonyan and Fuertinger 2015; McAvoy et al. 2015), it is possible that those same components associated with speech production and shared with the acquisition of a motor sequence would have an equally lateralized representation in the cerebellum (Kuper et al. 2011). Indeed, we found significant alterations of the learning speed only after the right and not left cerebellar stimulation, which suggests that the learning of an explicit motor sequence depends on a dedicated circuit, rather than on pure ipsilateral motor monitoring from cerebellar lobules IV-VI. Moreover, the right inferior posterior cerebellar lobules VIIb and VIII, which were our target for TBS, show task-related activity when items are maintained in mind over a delay and co-activate with inferior parietal regions implicated in storage-related processing (Chen and Desmond 2005). These findings lead to the assumption that the inferior-lateral cerebellum contributes to sequence storage.
Second phase of early motor sequence learning
The improvement of speed performance underwent a sudden slowing down during the 4th block in all groups, with or without cerebellar stimulation. It can be speculated that around this “bending point” the neuronal circuits executing and monitoring the repetitions deem the repeated action as worthy of retention, and other, more complex monitoring mechanisms take over. The number of repetitions itself might be the trigger for change: the monitoring of a repeated action
switches to retention beyond a given threshold. Despite the significant differences in performance with respect to the other two phases, fMRI did not detect any significant clusters in controls in the second phase, probably due to the unstable and highly volatile nature of the transition during which strategies are rapidly switched to select the optimal one (Adi-Japha et al. 2008; Albouy et al. 2012). There were, however, significant differences in activation between different stimulation groups and controls. In particular, the RcTBSCB group exhibited stronger corticostriatal and frontal activity – probably a cascading effect of the boosted activity in areas responsible for monitoring the repeated pattern in the first phase.
It is worth noting that the higher performance level reached by the RcTBSCB group before the 1st bending point was maintained throughout the remaining blocks, but the further increase of the speed performance did not differ with respect to the other groups as no significant interaction was found between block and group.
Third phase of early motor sequence learning
A second “bending point” of the performance curve seemed to emerge around the 10th block. From this point on, the performance of the RiTBSCB group became significantly lower not only with respect to the RcTBSCB group, but also to controls. This marks a further significant slowing in acquisition of the repeated sequence. Following the same reasoning as for the transition between the first and second phase of motor sequence learning, each new “bending point” might represent a significant change in the way the neuronal circuits process a repeated action. The fact that RiTBSCB induces this tardive slowing of performance suggests that the stimulation before the motor learning task interfered with and conditioned the natural encoding of the motor information in a way that becomes evident at later stages of learning. Since RiTBSCB is able to prevent associative changes in the motor cortex by gating the proprioceptive information (Kishore et al. 2014a), it is possible that the repetition of the motor sequence after RiTBSCB lacked part of the proprioceptive information necessary for a proper retention. In addition, RiTBSCB can induce diminished output from the dentate nucleus, and subsequently from its thalamic relay neurons towards the striatum (Ichinohe et al. 2000; Hoshi et al. 2005; Bostan et al. 2010; Pelzer et al. 2013). This diminished drive would hinder an
efficient transmission of the refined motor sequence from the anterior, “associative” striatum to the posterior, “sensorimotor” striatum (Lehéricy et al. 2005) in a timely and efficient manner (Rossi et al. 2008; Chen et al. 2014). This would require more resources for sustaining the repetition of the motor sequence in the third phase after RiTBSCB than after RcTBSCB, or, in other words, more effort from the anterior striatum is needed to “push through” a less efficient program. Interestingly, the RcTBSCB group seemed to need even less resources than the controls bilaterally in the caudate, superior prefrontal and superior temporal areas in the third phase. This suggests that the increased
information flow allowed in the first phase by the inhibition of the cerebellar cortex is also benefiting the later stages of motor sequence acquisition.
Functional interplay between cerebello-cortical and striato-cortical systems
The early boost in the motor sequence acquisition speed for the RcTBSCB group led to a higher performance at the first inflexion point of the learning pattern. The significantly higher learning speed was subsequently maintained throughout the rest of the task. The BOLD contrasts between the right cerebellar inhibition group on the one hand, and the control or right cerebellar excitation group on the other hand revealed significant activations in striatal regions in the second and third phase of motor sequence learning. While in the first blocks, the right cerebellar inhibition group showed increased left frontal activity when compared to the controls, in the last blocks, it showed bilateral lower activity than controls over extensive territories, ranging from the caudate nuclei to the frontal and temporal lobes. Could this be explained by the lower effort needed to maintain the execution speed of the learned sequence after the initial boost? Additional experiments with more challenging sequences/paradigms will be needed to elucidate this point.
The fact that cerebellar stimulation entrained complex shifts in cortical and sub-cortical activations underlying changes in motor performance supports the tight functional link between these structures. The cerebellum is only apparently in opposition with the rest of the brain due to the inhibitory projection from its cortex onto its nuclei (Ito 2006). It actually plays a pivotal role in
balancing the interaction between the basal ganglia and the cortical areas responsible for processing motor sequences. One further argument in favor of this point is the mismatch between the time
points at which the effects of each stimulation become clear. If the stimulated cerebellar areas were directly involved just in the motor control, the behavioral outcome and supporting brain activity would have diverged at the same delay post-intervention. But they did not, which suggests a complex phenomenon in which the cerebellum controls non-linear interactions between other structures involved in acquisition and storing of motor sequences.
It can be argued that one confounding factor in our study could be the use of the non-dominant hand. Left-hand movements in right-handed subjects are typically characterized by more bilateral activation patterns than right-hand movements due to the known specialization of the left hemisphere in motor control (Serrien et al. 2006). This might reduce or mask some expected asymmetries in cortical activation, hence possibly limiting the interpretation of our results to this effector only. At the same time, the motor cortices controlling each hand (and the associated learning strategies) might use intrinsically different models. A clear answer to this question would require performing the same set of recordings on right-handed subjects performing the task with their right hand.
Conclusion
In conclusion, our results support the view that functions lateralized in the brain also have lateralized counterparts in the cerebellum. We demonstrate that certain types of motor learning (like explicit motor sequence learning) can be bidirectionally modulated with non-invasive brain
stimulation by changing the weight of the cerebellar control over the rest of the neural network: diminishing the output of the right inferior cerebellar cortex facilitates the rapid execution and identification of the motor sequence to be retained by the cortical structures; enhancing the output of the right inferior cerebellar cortex interferes with the transfer of the newly acquired motor sequence within the striatal and cortical circuits. Combining this kind of cerebellar modulation with the previously suggested incremental strategy of motor sequence learning (Lungu et al. 2014) might enhance the efficiency of clinical rehabilitation protocols.
Funding
This study was supported by the Canadian Institutes of Health Research (CIHR, MOP 97830). F.G. was supported by a grant from the Research Council of Ghent University.
T.P. and S.M. were supported by Institut National de la Santé et de la Recherche Médicale (Inserm). T.P. received funding from the program “Investissements d’avenir” ANR-10-IAIHU-06, Paris Institute of Translational Neuroscience.
Acknowledgements
We thank Ovidiu Lungu, Philippe Saucier, and Kristina Aurousseau for their assistance with the MRI scanning, and also Arnaud Boré and Francine Bélanger for their invaluable assistance in running this project. The Franco-Canadian co-operation for this study was possible through the International Laboratory for Neuroimaging and Modeling / Laboratoire International de Neuroimagerie et
Modélisation (LINeM) – a collaborative initiative between the University of Montréal and the Institut National de la Santé et de la Recherche Médicale (Inserm).
References
Addis DR, Pan L, Vu MA, Laiser N, Schacter DL (2009): Constructive episodic simulation of the future and the past: distinct subsystems of a core brain network mediate imagining and remembering. Neuropsychologia 47:2222–2238.
Adi-Japha E, Karni A, Parnes A, Loewenschuss I, Vakil E (2008): A shift in task routines during the learning of a motor skill: group-averaged data may mask critical phases in the individuals' acquisition of skilled performance. J Exp Psychol Learn Mem Cogn 34:1544-1551.
Albouy G, Sterpenich V, Balteau E, Vandewalle G, Desseilles M, Dang-Vu T, Darsaud A, Ruby P, Luppi P, Degueldre C, Peigneux P, Luxen A, Maquet P (2008): Both the hippocampus and striatum are involved in consolidation of motor sequence memory. Neuron. 58:261–272.
Albouy G, Sterpenich V, Vandewalle G, Darsaud A, Gais S, Rauchs G, Desseilles M, Boly M, Dang-Vu T, Balteau E, Degueldre C, Phillips C, Luxen A, Maquet P (2012): Neural correlates of performance variability during motor sequence acquisition. Neuroimage. 60:324–331.
Albouy G, King BR, Maquet P, Doyon J (2013a) Hippocampus and striatum: dynamics and interaction during acquisition and sleep-related motor sequence memory consolidation. Hippocampus. 23:985– 1004.
Albouy G, Sterpenich V, Vandewalle G, Darsaud A, Gais S, Rauchs G, Desseilles M, Boly M, Dang-Vu T, Balteau E, Degueldre C, Phillips C, Luxen A, Maquet P (2013b): Interaction between hippocampal and striatal systems predicts subsequent consolidation of motor sequence memory. PLoS ONE. 8:e59490. Albouy G, Fogel S, King BR, Laventure S, Benali H, Karni A, Carrier J, Robertson EM, Doyon J (2015): Maintaining vs. enhancing motor sequence memories: respective roles of striatal and hippocampal systems. Neuroimage. 108:423–434.
Arasanz CP, Staines WR, Roy EA, Schweizer TA (2012): The cerebellum and its role in word generation: a cTBS study. Cortex. 48:718–724.
Bijsterbosch JD, Lee KH, Hunter MD, Tsoi DT, Lankappa S, Wilkinson ID, Barker AT, Woodruff PW (2011): The role of the cerebellum in sub- and supraliminal error correction during sensorimotor synchronization: evidence from fMRI and TMS. J Cogn Neurosci. 23:1100–1112.
Bostan AC, Dum RP, Strick PL (2010): The basal ganglia communicate with the cerebellum. Proc Natl Acad Sci USA. 107:8452–8456.
Cantarero G, Spampinato D, Reis J, Ajagbe L, Thompson T, Kulkarni K, Celnik P (2015): Cerebellar Direct Current Stimulation Enhances On-Line Motor Skill Acquisition through an Effect on Accuracy. J Neurosci. 35:3285–3290.
Chen CH, Fremont R, Arteaga-Bracho EE, Khodakhah K (2014): Short latency cerebellar modulation of the basal ganglia. Nat Neurosci. 17:1767–1775.
Chen SH, Desmond JE (2005): Cerebrocerebellar networks during articulatory rehearsal and verbal working memory tasks. Neuroimage. 24:332–338.
Censor N, Sagi D, Cohen LG (2012): Common mechanisms of human perceptual and motor learning. Nat Rev Neurosci. 3:658-64.
Corballis M (2015) What’s left in language? Beyond the classical model. Ann N Y Acad Sci. doi: 10.1111/nyas.12761. [Epub ahead of print]
Coynel D, Marrelec G, Perlbarg V, Pélégrini-Issac M, de Moortele PF, Ugurbil K, Doyon J, Benali H, Lehéricy S (2009): Dynamics of motor-related functional integration during motor sequence learning. NeuroImage. 49:759–766.
Davachi L, DuBrow S (2015): How the hippocampus preserves order: the role of prediction and context. Trends Cogn Sci. 19:92–99.
Doyon J, Song AW, Karni A, Lalonde F, Adams MM, Ungerleider LG (2002): Experience-dependent changes in cerebellar contributions to motor sequence learning. Proc Natl Acad Sci USA. 99:1017– 1022.
Doyon J, Penhune V, Ungerleider LG (2003): Distinct contribution of the striatal and cortico-cerebellar systems to motor skill learning. Neuropsychologia. 41:252–262.
Doyon J, Benali H (2005): Reorganization and plasticity in the adult brain during learning of motor skills. Curr Opin Neurobiol. 15:161–167.
Doyon J, Bellec P, Amsel R, Penhune V, Monchi O, Carrier J, Lehéricy S, Benali H (2009): Contributions of the basal ganglia and functionally related brain structures to motor learning. Behav Brain Res.
199:61–75.
Floyer-Lea A, Matthews PM (2005): Distinguishable brain activation networks for short- and long-term motor skill learning. Journal of neurophysiology. 94:512–518.
Fuster JM. 1999. Memory in the cerebral cortex: An empirical approach to neural networks in the human and nonhuman primate. Cambridge, MIT Press.
Galea JM, Vazquez A, Pasricha N, de Xivry J-JOJ, Celnik P (2011): Dissociating the roles of the
cerebellum and motor cortex during adaptive learning: the motor cortex retains what the cerebellum learns. Cereb Cortex. 21:1761–1770.
Gheysen F, Gevers W, De Schutter E, Van Waelvelde H, Fias W (2009): Disentangling perceptual from motor implicit sequence learning with a serial color-matching task. Exp Brain Res. 197:163–174. Gheysen F, Van Opstal F, Roggeman C, Van Waelvelde H, Fias W (2010): Hippocampal contribution to early and later stages of implicit motor sequence learning. Exp Brain Res. 202:795–807.
Hardwick RM, Rottschy C, Miall RC, Eickhoff SB (2013): A quantitative meta-analysis and review of motor learning in the human brain. Neuroimage. 67:283–297.
Hétu S, Grégoire M, Saimpont A, Coll M-PP, Eugène F, Michon P-EE, Jackson PL (2013): The neural network of motor imagery: an ALE meta-analysis. Neurosci Biobehav Rev. 37:930–949.
Herzfeld DJ, Pastor D, Haith AM, Rossetti Y, Shadmehr R, O'Shea J (2014): Contributions of the cerebellum and the motor cortex to acquisition and retention of motor memories. Neuroimage. 98:147-58.
Hikosaka O, Nakamura K, Sakai K, Nakahara H (2002): Central mechanisms of motor skill learning. Current opinion in neurobiology. 12:217–222.
Homae F, Yahata N, Sakai K (2003): Selective enhancement of functional connectivity in the left prefrontal cortex during sentence processing. Neuroimage. 20:578–586.
Horwitz B, Amunts K, Bhattacharyya R, Patkin D, Jeffries K, Zilles K, Braun AR (2003): Activation of Broca’s area during the production of spoken and signed language: a combined cytoarchitectonic mapping and PET analysis. Neuropsychologia. 41:1868–1876.
ganglia. Nat Neurosci. 8:1491–1493.
Huang YZ, Edwards MJ, Rounis E, Bhatia KP, Rothwell JC (2005) Theta burst stimulation of the human motor cortex. Neuron. 45:201-6.
Ichinohe N, Mori F, Shoumura K (2000): A di-synaptic projection from the lateral cerebellar nucleus to the laterodorsal part of the striatum via the central lateral nucleus of the thalamus in the rat. Brain Research. 880:191-197.
Imamizu H, Miyauchi S, Tamada T, Sasaki Y, Takino R, Pütz B, Yoshioka T, Kawato M (2000): Human cerebellar activity reflecting an acquired internal model of a new tool. Nature. 403:192–195. Ito M (2006): Cerebellar circuitry as a neuronal machine. Prog Neurobiol. 78:272-303.
Jayaram G, Galea JM, Bastian AJ, Celnik P (2011) Human locomotor adaptive learning is proportional to depression of cerebellar excitability. Cereb Cortex. 21:1901–1909.
Jenkins IH, Brooks DJ, Nixon PD, Frackowiak RS, Passingham RE (1994): Motor sequence learning: a study with positron emission tomography. J Neurosci. 14:3775–3790.
Jueptner M, Weiller C (1998): A review of differences between basal ganglia and cerebellar control of movements as revealed by functional imaging studies. Brain. 121:1437–1449.
Karni A, Meyer G, Rey-Hipolito C (1998): The acquisition of skilled motor performance: fast and slow experience-driven changes in primary motor cortex. Proc Natl Acad Sci USA. 95:861-8.
Kishore A, Popa T, Balachandran A, Chandran S, Pradeep S, Backer F, Krishnan S, Meunier S (2014a): Cerebellar Sensory Processing Alterations Impact Motor Cortical Plasticity in Parkinson’s Disease: Clues from Dyskinetic Patients. Cerebral cortex. 8:2055–2067.
Kishore A, Popa T, James P, Yahia-Cherif L, Backer F, Varughese Chacko L, Govind P, Pradeep S, Meunier S (2014b): Age-related decline in the responsiveness of motor cortex to plastic forces reverses with levodopa or cerebellar stimulation. Neurobiol Aging. 35:2541-51.
Kuper M, Dimitrova A, Thurling M, Maderwald S, Roths J, Elles HG, et al. (2011): Evidence for a motor and a non-motor domain in the human dentate nucleus—An fMRI study. Neuroimage. 54: 2612– 2622.
Distinct basal ganglia territories are engaged in early and advanced motor sequence learning.
Proceedings of the National Academy of Sciences of the United States of America. 102:12566–12571. Li Voti P, Conte A, Rocchi L, Bologna M, Khan N, Leodori G, Berardelli A (2014): Cerebellar continuous theta-burst stimulation affects motor learning of voluntary arm movements in humans. Eur J
Neurosci. 39:124–131.
Lohse KR, Wadden KK, Boyd LA, Hodges NJ (2014): Motor skill acquisition across short and long time scales: A meta-analysis of neuroimaging data. Neuropsychologia. 59:130–141.
Lorch RF, Myers JL. (1990): Regression analyses of repeated measures data in cognitive research. J Exp Psychol Learn Mem Cogn. 16:149–157.
Lungu O, Monchi O, Albouy G, Jubault T, Ballarin E, Burnod Y, Doyon J (2014): Striatal and
hippocampal involvement in motor sequence chunking depends on the learning strategy. PLoS ONE. 9:e103885.
Ma L, Wang B, Narayana S, Hazeltine E, Chen X, Robin DA, Fox PT, Xiong J (2010): Changes in regional activity are accompanied with changes in inter-regional connectivity during 4 weeks motor learning. Brain Res. 1318:64–76.
McAvoy M, Mitra A, Coalson RS, d’Avossa G, Keidel JL, Petersen SE, Raichle ME (2015): Unmasking Language Lateralization in Human Brain Intrinsic Activity. Cerebral Cortex. pii: bhv007. [Epub ahead of print]
Miall RC, Christensen L, Cain O, Stanley J (2007): Disruption of state estimation in the human lateral cerebellum. PLoS biology. 5:e316.
Miall RC, Christensen LO (2004): The effect of rTMS over the cerebellum in normal human volunteers on peg-board movement performance. Neurosci Lett. 371:185–189.
Miall RC, King D (2008): State estimation in the cerebellum. Cerebellum. 7:572–576.
Middleton FA, Strick P (2000): Basal ganglia and cerebellar loops: motor and cognitive circuits. Brain research reviews. 31:236–250.
Murdoch BE (2010): The cerebellum and language: historical perspective and review. Cortex. 46:858-868.