HAL Id: inserm-00468691
https://www.hal.inserm.fr/inserm-00468691
Submitted on 14 Dec 2011
HAL is a multi-disciplinary open access archive for the deposit and dissemination of sci-entific research documents, whether they are pub-lished or not. The documents may come from teaching and research institutions in France or abroad, or from public or private research centers.
L’archive ouverte pluridisciplinaire HAL, est destinée au dépôt et à la diffusion de documents scientifiques de niveau recherche, publiés ou non, émanant des établissements d’enseignement et de recherche français ou étrangers, des laboratoires publics ou privés.
Association of socioeconomic position with health
behaviors and mortality.
Silvia Stringhini, Séverine Sabia, Martin Shipley, Eric Brunner, Hermann
Nabi, Mika Kivimaki, Archana Singh-Manoux
To cite this version:
Silvia Stringhini, Séverine Sabia, Martin Shipley, Eric Brunner, Hermann Nabi, et al.. Association of socioeconomic position with health behaviors and mortality.. Journal of the American Medical Asso-ciation, American Medical Association (AMA), 2010, 303 (12), pp.1159-66. �10.1001/jama.2010.297�. �inserm-00468691�
5th February 2010 MS ID#: JAMA09-6847
Association of socioeconomic position with health behaviors and mortality. The Whitehall II study Silvia Stringhini* 1, MSc Séverine Sabia 1, PhD Martin Shipley 2, MSc Eric Brunner 2, PhD Hermann Nabi 1, PhD Mika Kivimaki 2, PhD Archana Singh-Manoux 1,2,3, PhD *
Corresponding author & address
1
Centre for Research in Epidemiology & Population Health, INSERM U1018 Hôpital Paul Brousse, Bât 15/16
16 avenue Paul Vaillant Couturier 94807 Villejuif Cedex, France
Tel: + 33 177747434; Fax: + 33 177747403 Email: silvia.stringhini@inserm.fr
2
Department of Epidemiology and Public Health University College London, UK
3
Centre de Gérontologie, Hôpital Ste Périne, AP-HP, France Word Count: Text – 3919 words.
Abstract
Context: Previous studies may have underestimated the contribution of health behaviors to
social inequalities in mortality because health behaviors were assessed only at the baseline of the study.
Objective: To examine the role of health behaviors in the association between socioeconomic
position and mortality and compare whether their contribution differs when assessed at only one point in time to that assessed longitudinally through the follow-up.
Main outcome measures: All-cause and cause-specific mortality.
Design, Setting, and Participants: Participants are drawn from the British Whitehall II
longitudinal cohort study, established in 1985 on 10,308 London based civil servants, aged 35-55 years. Analyses are based on 9,590 men and women followed for mortality until 2009. Socioeconomic position was derived from civil service employment grade (high, intermediate and low) at baseline. Smoking, alcohol consumption, diet and physical activity were assessed four times over the follow-up.
Results: 654 participants died during the follow-up. In analysis adjusted for sex and year of
birth, those in the low socioeconomic position had 1.60 times higher risk of death from all causes than those in the high position (a rate difference of 1.94 per 1000 person-years). This association was attenuated by 42% (95% CI, 21%-94%) when health behaviors assessed at baseline were entered into the model and by 72% (95% CI, 42%-154%) when they were entered as time dependent covariates. The corresponding attenuations were 29% (95% CI, 11%-54%) and 45% (95% CI, 24%-79%) for cardiovascular mortality and 61% (95% CI, 16%-425%) and 94% (95% CI, 35%-595%) for non-cancer non-cardiovascular mortality. The difference between the baseline only and repeated assessments of health behaviors was mostly due to an increased explanatory power of diet (from 7% to 17% for all-cause mortality), physical activity (from 5% to 21% for all-cause mortality) and alcohol consumption (from 3% to 12% for all-cause mortality). The role of smoking, the strongest mediator in these analyses, did not change when using baseline or repeat assessments (from 32% to 35% for all-cause mortality).
Conclusions: In a civil service population in London, there was an association between
socioeconomic position and mortality that was substantially accounted for by adjustment for health behaviors, particularly when the behaviors were assessed repeatedly.
Introduction
Lifestyle and health-related behaviors are recognized as major determinants of morbidity and mortality worldwide.1-3 Concurrently, there is evidence to suggest that the socioeconomic
differences in morbidity and mortality have increased.4-6 The higher prevalence of unhealthy
behaviors in lower socioeconomic groups 7-9 is seen to be one of the mechanisms linking
lower socioeconomic position to worse health.10;11 Combinations of potentially modifiable
behavioral factors such as smoking, alcohol consumption, dietary patterns, physical activity and BMI have been shown to explain 12% to 54% of the socioeconomic differences in
mortality.12-17 In those studies, health behaviors have typically been assessed at only one point
in time, assuming implicitly that they remain constant over time.
However, major changes have occurred in population lifestyles. These include the decreasing prevalence of smoking,18 but a remarkable increase in obesity since the 1990s.19 Given that
changes in health behaviors may be socially patterned,20;21 previous studies with a single
assessment of behaviors may have provided an inaccurate estimation of their contribution to the association between socioeconomic factors and mortality. In this study, we used four repeated measures of health behaviors over a 24-year period to assess their role when only baseline measures are used compared to repeated measures over the follow-up. We further examined whether this difference is similar for four health behaviors: smoking, alcohol consumption, diet and physical activity.
Data and Methods
Study Population
The Whitehall II cohort was established in 1985 to examine the socioeconomic gradient in health and disease among 10,308 civil servants.22 All civil servants aged 35-55 years in 20
London based departments were invited to participate by letter, and 73% agreed. Baseline examination (Phase 1) took place during 1985-1988, and involved a clinical examination and a self-administered questionnaire containing sections on demographic characteristics, health, lifestyle factors, work characteristics, social support and life events. All participants gave written consent to participate in the study and the University College London ethics committee approved the study.
Socioeconomic Position
Socioeconomic position is approximated by the British civil service occupational grade at baseline; a three level variable representing high (administrative grades), intermediate
(professional or executive grades) and low (clerical or support grades) grades. This measure is a comprehensive marker of socioeconomic circumstances and is related to salary, social status and level of responsibility at work.23
Health Behaviors
Data on health behaviors were drawn from Phases 1 (1985-1988), 3 (1991-1993), 5 (1997-1999) and 7 (2002-2004) of the study. Smoking status was self-reported (never, ex, or current smoker). Alcohol consumption was assessed using questions on the number of alcoholic drinks (“measures” of spirits, “glasses” of wine, and “pints” of beer) consumed in the last week. This was converted to number of alcohol units (1 unit corresponds to 8 g of alcohol) consumed per week.24 Participants were categorized as abstainers (0 unit/week), moderate
(1-21 units/week for men, 1-14 for women) and heavy drinkers (more than (1-21 units/week for men, more than 14 for women). Dietary patterns were assessed via questions on the
frequency of fruit and vegetable consumption (8-point scale, ranging from „seldom or never‟ to „two or more times a day‟), the type of bread (white, brown, or both) and milk (no, whole, semi-skimmed, skimmed, other) consumed. A diet score was calculated and classified as „unhealthy‟ if participants reported eating white bread most frequently, used whole milk and ate fruit and vegetables less than 3 times a month; „healthy‟ if they reported eating
wholemeal, wheatmeal or other brown bread most frequently, didn‟t use milk or used skimmed or “other types of milk” and ate fruit and vegetables daily or two or more times a day; or „moderately healthy‟ if their dietary pattern was in-between. Physical activity was assessed at Phases 1 and 3 using questions on the frequency and duration of participation in mildly energetic (e.g., weeding, general housework, bicycle repair), moderately energetic (e.g., dancing, cycling, leisurely swimming), and vigorous physical activity (e.g., running, hard swimming, playing squash). At Phases 5 and 7, the questionnaire was modified to include 20 items on frequency and duration of participation in different physical activities (e.g., walking, cycling, sports) that were used to compute hours per week of each intensity level. Participants were classified as „active‟ (more than 2.5 hrs/week of moderate physical activity or more than 1 hr/week of vigorous physical activity), „inactive‟ (less than 1 hr/week of moderate physical activity and less than 1 hr/week of vigorous physical activity), or „moderately active‟ (if not active or inactive). For 20% of the participants, data on health behaviors were missing at one of the follow-ups (Phases 3, 5, or 7), these were replaced with data from one phase immediately prior or subsequent to that phase.
Mortality
10,297 (99.9 %) participants were successfully traced and have been followed for mortality through the national mortality register kept by the National Health Services Central Registry, using the National Health Service identification number assigned to each British citizen. Mortality follow-up, including the causes of death, was available until 30th April, 2009; a
mean of 19.4 years.
We examined all-cause mortality, cancer mortality, cardiovascular disease (CVD) mortality, and non-cancer/non-CVD mortality. The International Classification of Disease (ICD) codes were used to define cancer (ICD-9 140.0-209.9 and ICD-10 C00-C97) and CVD (ICD-9 390.0-458.9, ICD-10 I00-I99) mortality. Non-cancer/non-CVD mortality includes all
remaining deaths not classified as cancer or CVD. This embraced various causes of death, the most common being diseases of the respiratory system (ICD-9 460.0-519.9 and ICD-10 J00-J99); diseases of the digestive system (ICD-9 520.0-579.9 and ICD-10 K00-K93); injuries, poisoning and external causes of death (ICD-9 800.0-999.9 and ICD-10 S00-T98); diseases of the nervous system (ICD-9 320.0-389.9 and ICD-10 G00-G99).
Statistical Analysis
For each socioeconomic group and health behavior we calculated mortality rates per 1000 person-years and 95% confidence intervals (CI)25 for all-cause, cancer, CVD and
non-cancer/non-CVD mortality, standardized for age at baseline (4-year age groups) and sex with the direct method using the whole analytic sample as the standard population. Subsequently, Cox proportional regression analysis with age as the time scale was used to estimate Hazard Ratios (HR) and their 95% CI for the association between socioeconomic position and mortality. Of the 9,590 participants with information on the four health behaviors at baseline,
7,344 had complete data on all health behaviors at all phases prior to being censored at their date of death or at end of follow-up on 30th April 2009. The remaining 2,246 participants were
censored at the last date at which they had complete data, after imputation, on all health behaviors for all preceding phases.
In the Cox regression, the first model included adjustment for sex and year of birth (Model 1). Subsequently, smoking status, alcohol consumption, dietary patterns and physical activity assessed at baseline were entered one by one and then simultaneously into Model 1. In the second set of analyses, the procedure described above was repeated with health behaviors assessed at Phases 1, 3, 5 and 7 entered as time-dependent covariates. In both these analyses, we used the measure of socioeconomic position as a continuous 3-level variable. The hazard for one unit change was squared to correspond to the increased risk of mortality in the lowest socioeconomic group versus the highest under the assumption of linearity of association between socioeconomic position and mortality.
The mediating role of each health behavior was determined by the percent reduction in the coefficient for socioeconomic position after inclusion of the health behavior(s) in question, using the formula “100 x (Model 1 -Model 1+ health behaviors(s))/(Model 1)”. We then calculated a
95% CI around the percentage attenuation using a bias corrected accelerated bootstrap method with 2,000 resamplings.26 We used the same procedure to test the difference between
adjustment for health behaviors at baseline and that with health behaviors assessed longitudinally. If the 95% CI did not include 0, the estimations from the two models were considered to be different.
The proportional hazard assumptions for Cox regression models, tested using Schoenfeld residuals, were found not to be violated. Statistical tests were 2-sided, a P valueof less than 0.05 was considered statistically significant.The main analysis was performed using the statistical software STATA 10, StataCorp LP, Texas, USA. Bootstrap confidence intervals were calculated using the statistical software SAS 9 using the %BOOT and %BOOTCI macros (http://support.sas.com/kb/24/982.html).
Results
We excluded from the analysis 707 participants with missing data on health behaviors at baseline (smoking: 89, alcohol consumption: 94, diet: 162, physical activity: 416 not mutually exclusive) and 11 participants not followed-up for mortality, corresponding to 7% of the total baseline population. The analysis was based on the remaining 9,590 participants (68% men and 32% women). More of those excluded were from the lowest socioeconomic group (39% vs 21%, p<0.001) at baseline. There were no age differences between the included and
excluded men (44.3 vs 44.0 years, p=0.34), but the women with missing data were older (46.7 vs 45.0 years, p<0.001). For five individuals, the cause of death was not known and they were excluded from the cause-specific analysis.
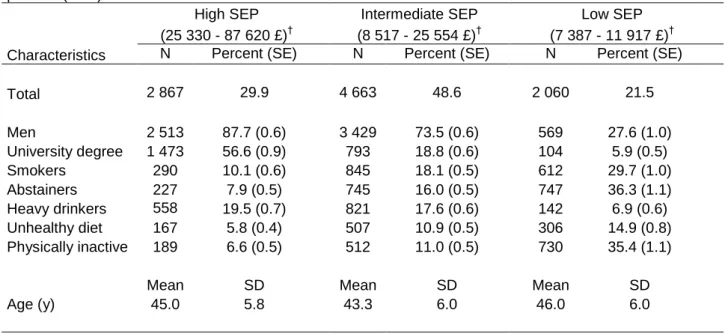
Table 1 shows characteristics of the study population. There was a marked social gradient in health behaviors at baseline. Participants in the lower socioeconomic groups were more likely to be smokers, abstainers, follow an unhealthy diet and be physically inactive, and less likely to be heavy drinkers (all p<0.001). Over the total follow-up (data not shown), the prevalence of smoking decreased, from 10.1% to 4.8 % in the high and from 29.7% to 16.5% in the low socioeconomic group. Alcohol abstention changed little in the high socioeconomic group,
from 7.9% to 7.7%, but increased in the low socioeconomic group from 36.3% to 42.2%. The prevalence of unhealthy diet decreased from 5.8% to 1.0% in the high and from 14.9% to 5.2% in the low socioeconomic group. However, the prevalence of sedentary behavior
increased from 6.6% to 21.4% in the high and from 35.4% to 41.6% in the low socioeconomic group. In terms of relative differences between the low and high socioeconomic groups, the above changes in prevalence indicate increased differences for smoking (from a ratio of 2.9 to 3.4), abstention (from a ratio of 4.6 to 5.5) and unhealthy diet (from a ratio of 2.6 to 5.2) but a decreased difference for sedentary behavior (from a ratio of 5.4 to 1.9).
A total of 654 participants died during the 24-year follow-up, the most common cause of death being cancer (311 deaths) and CVD (188 deaths). Table 2 shows age and
sex-standardized mortality rates per 1000 person-years for all-cause, cancer, CVD and other (non-cancer/non-CVD) mortality. There was a graded association between socioeconomic position and all mortality outcomes, apart from cancer mortality for which HR for lowest versus highest position was 1.07 (95% CI, 0.76-1.52) in a model adjusted for sex and birth year (a rate difference of -0.01 per 1000 person-years). Health behaviors were associated with mortality (Table 2) with the exception of diet for CVD mortality and physical activity for cancer mortality where there was no clear pattern. There was a U-shaped relationship between alcohol consumption and all-cause mortality, with abstainers being at higher risk for CVD mortality and heavy drinkers at higher risk of cancer mortality. No further analyses were performed on cancer mortality.
Results on the mediating role of health behaviors are presented in Tables 3, 4 and 5 for all-cause, CVD and non-cancer/non-CVD mortality, respectively. For all-cause mortality, the HR for lowest versus highest socioeconomic position was 1.60 (95% CI, 1.26-2.04) in the model
adjusted for sex and year of birth (a rate difference of 1.94 per 1000 person years). When health behaviors at baseline were added to this model, only smoking substantially attenuated the HR (percent attenuation: 32%, 95% CI, 21%-70%). When health behaviors were entered as time-dependent covariates, the attenuation for smoking was similar to that using only the baseline measure but the explanatory power of the other behaviors improved substantially. For alcohol it improved by 9% (95% CI, 0%-25%), for diet by 10% (95% CI, 0%-28%) and for physical activity by 16% (95% CI, 4%-39%). Overall, health behaviors assessed at baseline explained 42% (95% CI, 21%-94%) of the association between socioeconomic position and all-cause mortality; this increased to 72% (95% CI, 42%-154%) when assessed repeatedly, a difference of 30% (95% CI, 10%-70%).
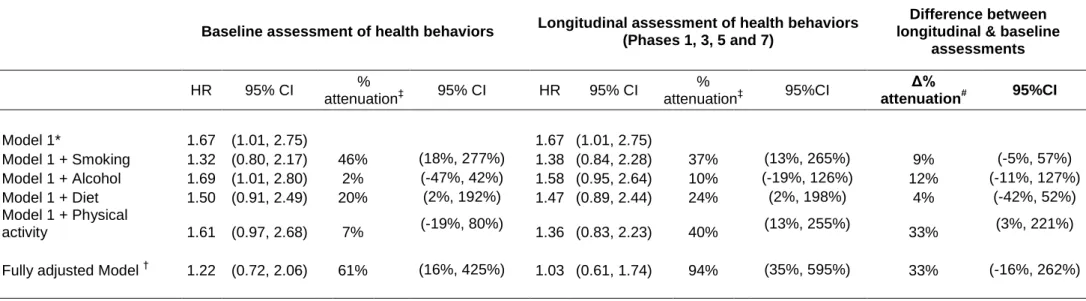
The hazard ratio for CVD mortality for the low compared to the high socioeconomic group was 3.05 (95% CI, 1.94%-4.78%) in the model adjusted for sex and year of birth (Table 4), a rate difference of 1.58 per 1000 person-years. Adding smoking to the model, using the baseline smoking data only or repeated measures of smoking, reduced the hazard ratio by 12%. Only the effect of diet was significantly greater, by 10% (95% CI, 3%-22%), when assessed repeatedly through the follow-up. However, all health behaviors taken together at baseline explained 29% (95% CI, 11%-54%) of the gradient and 45% (95% CI, 24%-79%) with repeated assessments. Compared to the high socioeconomic group (Table 5), the low group had greater risk of non-cancer/non-CVD mortality (HR=1.67 (95% CI, 1.01-2.75), a rate difference of 0.38 per 1000 person-years). Longitudinal assessment of all four health behaviors explained 94% (95% CI, 35%-595%) of this association. The contribution of health behaviors was significantly greater only for physical activity (a difference of 33%, 95% CI, 3%-221%).
It is possible that participants who died early in the follow-up did not benefit from the effect of recent policies aimed at improving lifestyles. As this could be a source of bias in our analysis, all analyses were repeated with follow-up time as the time scale and age as a covariate. The results were not different to those using age as the time scale. All analyses on all-cause mortality were also repeated including only participants with complete data on health behaviors at all phases. Again the results did not differ.
We used the measure of socioeconomic position at baseline in all analyses as different
estimates of the socioeconomic gradient for the baseline and the longitudinal model would not allow comparisons to be made for the impact of health behaviors. However, in supplementary analyses we verified that the socioeconomic gradient remained the same throughout the follow-up by entering the measure of socioeconomic position as a time-dependent covariate. In analysis adjusted for sex and year of birth the hazard ratios for all cause (HR=1.54; 95% CI, 1.17-2.02), cancer (HR=0.96; 95% CI, 0.64-1.43), CVD (HR=2.95; 95% CI, 1.81-4.83) and non-CVD/non-cancer mortality (HR=1.89; 95% CI, 1.07-3.36) were similar to those reported in the main analysis. Furthermore, the role of health behaviors changed little when both health behaviors and the socioeconomic measure were entered as time dependent covariates; for all-cause mortality, the attenuation in the association was 67%, comparable to the 72% reported in Table 3.
Discussion
This study sought to quantify the contribution of health behaviors to the association between socioeconomic position and all-cause, CVD and non-cancer/non-CVD mortality and
assessments over 24 years of follow-up. Results show a clear social gradient in mortality with lower socioeconomic position being associated with higher mortality. Unhealthy behaviors such as smoking, alcohol abstention, unhealthy diet and low levels of physical activity, were strongly related to mortality and were more prevalent in the lower socioeconomic groups. Heavy drinking was more prevalent in the highest socioeconomic group. Overall, health behaviors assessed at baseline explained 42%, 29% and 61% of the socioeconomic gradient in all-cause, CVD and non-cancer/non-CVD mortality. Analyses based on repeated assessments of these behaviors through the follow-up showed them to make a greater contribution to explaining social inequalities in mortality; the corresponding percentage attenuations being 72%, 45% and 94%, respectively.
Multiple inter-related pathways have been proposed to explain social inequalities in health,
27-31
with the prominent mechanisms being health behaviors, psychosocial factors and material factors. The overriding conclusion from our study is that the impact of health behaviors in explaining social inequalities in health is greater when they are assessed longitudinally. However, our analysis does not allow conclusions to be drawn on the relative importance of health behaviors in relation to psychosocial and material factors as these were not analyzed in the present paper. Furthermore, it is possible that the effect of material and psychosocial factors on health is also mediated through health behaviors.14;16 Differences in exposure to
environmental hazards across social strata and access to medical care are also important contributors in many settings.32-35 However, these are unlikely to play a major role in our data
as the participants are white collar workers with universal access to health care. For example, previous findings in this cohort show little socioeconomic difference in access to cardiac investigation and treatment.36
Studies that aim to assess the role of behavioral factors for mortality have typically explained between 12% and 54% of the socioeconomic gradient.12-14;16;37 Our study is not easily
comparable to these studies because of important differences in the set of behaviors included, in the socioeconomic measure used and the population studied. Furthermore, our calculation of percentage attenuation is conservative since it uses the log of the hazard ratios in the calculation of the attenuation to reflect the assumed linearity in the association between socioeconomic position and mortality. An alternative formula (100 x (HRModel1 - HR Model 1+
health behaviour(s)) /(HRModel1 - 1), used in many previous papers, is based on the excess hazards
and when applied to our longitudinal models explained 77%, 59% and 96% of the social gradient in all-cause, CVD and non-cancer/non-CVD mortality respectively.
The use of a bootstrap method allowed us to formally test the difference between the baseline and the longitudinal adjustment for health behaviors. Our results show that there is a
significant increase in the predictive ability of health behaviors when assessed longitudinally for all-cause mortality and CVD mortality. This increase in explanatory power may relate to better estimation of the association between socioeconomic position and health behaviors over time and also of that between changes in health behaviors over time and mortality. For
example, it has been shown that individuals from lower socioeconomic groups are more resistant to changing their unhealthy behaviors compared to their more advantaged
counterparts.38;39 A number of studies 40-43 have shown that changes in health behaviors over
the follow-up period are responsible for changes in the resulting association with poor health outcomes. Repeated assessment of health behaviors allowed us to take such changes into account.
The explanatory power of diet, physical activity and alcohol consumption increased between the baseline and longitudinal assessments. In contrast, the impact of smoking did not change even though it was the main explanatory factor of the social gradient in mortality. The
prevalence of smoking decreased over time in the study sample but it is possible that the time lapse necessary to see the impact on mortality is longer. For some causes of mortality, such as chronic obstructive pulmonary disease or lung cancer44;45 the lapse of time in our study would
not be sufficient to modify the associated risks of death. However, for other causes such as coronary death,44 the increased risk of death associated with smoking has been found to
decrease from 5 years after smoking cessation. Despite decreasing prevalence, the social gradient in smoking in our study decreased little over the follow-up period.
Participants in all socioeconomic groups improved their dietary behaviors during the follow-up but this was more evident in the high socioeconomic grofollow-up. Unhealthy diet was about twice as prevalent at baseline in the low socioeconomic group but the difference was 5-fold at the end of the follow-up. Use of the repeated measurements allows these widening differences to be taken into account when explaining the social gradient in mortality. Participants became less physically active in all groups over the follow-up, although the social patterning of physical inactivity decreased. In summary, the increased contribution of diet, physical activity and alcohol consumption to inequalities in mortality when assessed through the follow-up seems to be due to a combined effect of behavioral changes that occurred during the study period and to changes in social patterning of these behaviors. However, it is possible that changes in health behaviors over time are due to changes in health status. The analyses reported here do not allow us to tease apart the precise sequence of events that lead to the association between socioeconomic position, health behaviors and mortality.
Strengths and weaknesses
This study has two major strengths. First, unlike previous studies, health behaviors were assessed four times over the 24-year follow-up, at an interval of four to five years. Second, the unique feature of this study is that it is one of the first studies to provide a confidence interval for the effect of health behaviors on the socioeconomic gradient in mortality, calculated using the Bootstrap method. The use of this method has allowed us to add a degree of precision around the estimate of the attenuation that is often expressed simply as a percentage.
There are a number of caveats to the results reported here. The Whitehall II study is based on a white collar cohort and thus is not representative of the general population in terms of the socioeconomic spectrum or the range of unhealthy behaviors. However, this may mean that socioeconomic differences observed and explained in this cohort are smaller than those in the general population. A further concern is that about 20% of the participants had at least one of the four behaviors imputed (with the preceding or subsequent phase) at one of the phases. This decision was made as a „complete-case‟ approach in proportional hazards regression models has been shown to be inappropriate when data are not missing at random.46 However,
in our data there were no important differences in the estimates from complete case analysis compared to that with imputed values. A further limitation is our use of subjective measures of health behaviors. Objective, precise and more detailed measures of behaviors,
nicotine/cotinine urine test for smoking or actigraphs for physical activity or more detailed questions, food frequency questionnaires for dietary patterns, might have yielded a more accurate estimation of their contribution to social inequalities in mortality.
Despite there being over 650 deaths, we were only able to analyze broad groupings of causes of death. Even then, the non cancer/non CVD mortality outcome, which contained a range of
disparate causes of death, still generated bootstrap confidence intervals which were particularly wide. Similarly, pooling all cancers is not ideal as social inequalities differ by cancer site, with some of them showing a reverse gradient. This may lead to results where the social patterns for different cancers cancel each other out and could explain the lack of association between socioeconomic status and cancer mortality.
Conclusions
This study suggests that health behaviors explain a substantial part of social inequalities in mortality and demonstrates the importance of taking into account changes over time in health behaviors when examining their role in social inequalities: they explained 72% of social inequalities in all-cause mortality when the four health behaviors were assessed four times over 24 years of follow-up against 42% when only assessed at baseline. Our findings may not necessarily have straightforward policy implications. On the one hand, the findings imply that health policies and interventions focusing on individual health behaviors have the potential not only to increase the population‟s health but also to substantially reduce inequalities in health. On the other hand, if health behaviors are socially patterned and determined, for example, by financial factors14;16 or the capacity to respond to health education messages21;47
or the environment in which they live,48 the same policies aimed at improving the population‟s health may contribute to increase in social inequalities in health.
ACKNOWLEDGEMENTS
Authors Contributions: SStr performed the analysis, interpreted the results and wrote the first
and successive drafts of the paper. SSab & MS supervised all statistical analyses and with HN contributed to the conception and design of the study, to the analysis and interpretation of data and revised critically each draft of the paper. EB, MK and ASM contributed to the conception and design of the study, to the acquisition, analysis and interpretation of data, and revised critically each draft of the paper.
SStr had full access to all of the data in the study and takes responsibility for the integrity of the data and the accuracy of the data analysis.
Funding/Support: AS-M is supported by a “European Young Investigator Award” from the
European Science Foundation and MS is supported by the British Heart Foundation. The Whitehall II study has been supported by grants from the British Medical Research Council (MRC); the British Heart Foundation; the British Health and Safety Executive; the British Department of Health; the National Heart, Lung, and Blood Institute (R01HL036310); the National Institute on Aging (R01AG013196 and R01AG034454).
We thank all of the participating civil service departments and their welfare, personnel, and establishment officers; the British Occupational Health and Safety Agency; the British Council of Civil Service Unions; all participating civil servants in the Whitehall II study; and all members of the Whitehall II study team. The Whitehall II Study team comprises research scientists, statisticians, study coordinators, nurses, data managers, administrative assistants and data entry staff, who make the study possible.
Role of Sponsors: The funding organizations had no role in the design and conduct of the
study, collection, management, analysis, and interpretation of data; and preparation, review, or approval of the manuscript.
Reference List
(1) Berkman L, Breslow L. Health and ways of living : the Alameda County study. New York: Oxford University Press, 1983.
(2) Mokdad AH, Marks JS, Stroup DF, Gerberding JL. Actual causes of death in the United States, 2000. JAMA 2004;291:1238-1245.
(3) Khaw KT, Wareham N, Bingham S, Welch A, Luben R, Day N. Combined impact of health behaviours and mortality in men and women: the EPIC-Norfolk prospective population study. PLoS Med 2008;5:e12.
(4) Singh GK, Siahpush M. Increasing inequalities in all-cause and cardiovascular mortality among US adults aged 25-64 years by area socioeconomic status, 1969-1998. Int J Epidemiol 2002;31:600-613.
(5) Meara ER, Richards S, Cutler DM. The gap gets bigger: changes in mortality and life expectancy, by education, 1981-2000. Health Aff (Millwood ) 2008;27:350-360.
(6) Mackenbach JP, Bos V, Andersen O et al. Widening socioeconomic inequalities in mortality in six Western European countries. Int J Epidemiol 2003;32:830-837.
(7) Lynch JW, Kaplan GA, Salonen JT. Why do poor people behave poorly? Variation in adult health behaviours and psychosocial characteristics by stages of the
socioeconomic lifecourse. Soc Sci Med 1997;44:809-819.
(8) Lakka TA, Kauhanen J, Salonen JT. Conditioning leisure time physical activity and cardiorespiratory fitness in sociodemographic groups of middle-ages men in eastern Finland. Int J Epidemiol 1996;25:86-93.
(9) Martikainen P, Brunner E, Marmot M. Socioeconomic differences in dietary patterns among middle-aged men and women. Soc Sci Med 2003;56:1397-1410.
(10) Macintyre S. The Black Report and beyond: what are the issues? Soc Sci Med 1997;44:723-745.
(11) Townsend P, Davidson N. Inequalities in health: The Black report. Harmondsworth: Penguin Books, 1982.
(12) Laaksonen M, Talala K, Martelin T et al. Health behaviours as explanations for educational level differences in cardiovascular and all-cause mortality: a follow-up of 60 000 men and women over 23 years. Eur J Public Health 2008;18:38-43.
(13) Lantz PM, House JS, Lepkowski JM, Williams DR, Mero RP, Chen J. Socioeconomic factors, health behaviors, and mortality: results from a nationally representative prospective study of US adults. JAMA 1998;279:1703-1708.
(14) Schrijvers CT, Stronks K, van de Mheen HD, Mackenbach JP. Explaining educational differences in mortality: the role of behavioral and material factors. Am J Public
Health 1999;89:535-540.
(15) Strand BH, Tverdal A. Can cardiovascular risk factors and lifestyle explain the
educational inequalities in mortality from ischaemic heart disease and from other heart diseases? 26 year follow up of 50,000 Norwegian men and women. J Epidemiol
Community Health 2004;58:705-709.
(16) van Oort FV, van Lenthe FJ, Mackenbach JP. Material, psychosocial, and behavioural factors in the explanation of educational inequalities in mortality in The Netherlands. J
(17) Woodward M, Oliphant J, Lowe G, Tunstall-Pedoe H. Contribution of
contemporaneous risk factors to social inequality in coronary heart disease and all causes mortality. Prev Med 2003;36:561-568.
(18) NHS. Statistics on smoking, England 2008. 2008. The Health and Social Care Information Centre.
(19) NHS. Statistics on Obesity, Physical Activity and Diet: England, January 2008. 2008. (20) Chan RH, Gordon NF, Chong A, Alter DA. Influence of socioeconomic status on
lifestyle behavior modifications among survivors of acute myocardial infarction. Am J
Cardiol 2008;102:1583-1588.
(21) Purslow LR, Young EH, Wareham NJ et al. Socioeconomic position and risk of short-term weight gain: prospective study of 14,619 middle-aged men and women. BMC
Public Health 2008;8:112.
(22) Marmot M, Brunner E. Cohort Profile: the Whitehall II study. Int J Epidemiol 2005;34:251-256.
(23) Marmot MG, Smith GD, Stansfeld S et al. Health inequalities among British civil servants: the Whitehall II study. Lancet 1991;337:1387-1393.
(24) Britton A, Singh-Manoux A, Marmot M. Alcohol consumption and cognitive function in the Whitehall II Study. Am J Epidemiol 2004;160:240-247.
(25) Breslow NE, Day NE. Statistical methods in cancer research. Volume II--The design and analysis of cohort studies. IARC Sci Publ 1987;1-406.
(26) SAS OnlineDoc®. Jackknife and Bootstrap Analyses. 2009 http://support.sas.com/kb/24/982.html.
(27) Bartley M. Health Inequality - An introduction to Theories, Concepts and methods. Oxford: Blackwell Publishing, 2004.
(28) Kaplan GA, Pamuk ER, Lynch JW, Cohen RD, Balfour JL. Inequality in income and mortality in the United States: analysis of mortality and potential pathways. BMJ 1996;312:999-1003.
(29) Marmot M, Wilkinson R. Social determinants of health. New York: Oxford University Press, 1999.
(30) Townsend P, Davidson N, Whitehead M. Inequalities in Health: The Black Report and
the Health Divide. London: Penguin Books, 1992.
(31) Kivimaki M, Shipley MJ, Ferrie JE et al. Best-practice interventions to reduce socioeconomic inequalities of coronary heart disease mortality in UK: a prospective occupational cohort study. Lancet 2008;372:1648-1654.
(32) Hart JT. The inverse care law. Lancet 1971;1:405-412.
(33) Hemstrom O. Health inequalities by wage income in Sweden: the role of work environment. Soc Sci Med 2005;61:637-647.
(34) Krieger N, Chen JT, Waterman PD et al. The inverse hazard law: blood pressure, sexual harassment, racial discrimination, workplace abuse and occupational exposures in US low-income black, white and Latino workers. Soc Sci Med 2008;67:1970-1981.
(35) Krieger N, Rowley DL, Herman AA, Avery B, Phillips MT. Racism, sexism, and social class: implications for studies of health, disease, and well-being. Am J Prev Med 1993;9:82-122.
(36) Britton A, Shipley M, Marmot M, Hemingway H. Does access to cardiac investigation and treatment contribute to social and ethnic differences in coronary heart disease? Whitehall II prospective cohort study. BMJ 2004;329:318.
(37) Pekkanen J, Tuomilehto J, Uutela A, Vartiainen E, Nissinen A. Social class, health behaviour, and mortality among men and women in eastern Finland. BMJ
1995;311:589-593.
(38) Winkleby MA, Flora JA, Kraemer HC. A community-based heart disease intervention: predictors of change. Am J Public Health 1994;84:767-772.
(39) Sorensen G, Stoddard AM, Dubowitz T et al. The influence of social context on changes in fruit and vegetable consumption: results of the healthy directions studies.
Am J Public Health 2007;97:1216-1227.
(40) Paffenbarger RS, Jr., Hyde RT, Wing AL, Lee IM, Jung DL, Kampert JB. The
association of changes in physical-activity level and other lifestyle characteristics with mortality among men. N Engl J Med 1993;328:538-545.
(41) Byberg L, Melhus H, Gedeborg R et al. Total mortality after changes in leisure time physical activity in 50 year old men: 35 year follow-up of population based cohort.
BMJ 2009;338:b688.
(42) Andersen LB. Relative risk of mortality in the physically inactive is underestimated because of real changes in exposure level during follow-up. Am J Epidemiol
2004;160:189-195.
(43) Gronbaek M, Johansen D, Becker U et al. Changes in alcohol intake and mortality: a longitudinal population-based study. Epidemiology 2004;15:222-228.
(44) Kenfield SA, Stampfer MJ, Rosner BA, Colditz GA. Smoking and smoking cessation in relation to mortality in women. JAMA 2008;299:2037-2047.
(45) Godtfredsen NS, Lam TH, Hansel TT et al. COPD-related morbidity and mortality after smoking cessation: status of the evidence. Eur Respir J 2008;32:844-853.
(46) Demissie S, LaValley MP, Horton NJ, Glynn RJ, Cupples LA. Bias due to missing exposure data using complete-case analysis in the proportional hazards regression model. Stat Med 2003;22:545-557.
(47) Macintyre S. The social patterning of exercise behaviours: the role of personal and local resources. Br J Sports Med 2000;34:6.
(48) Macintyre S, Maciver S, Sooman A. Area, class and health; should we be focusing on places or people? J Soc Policy 1993;22:213-234.
Table 1. Baseline characteristics of the Whitehall II participants included in the study by socioeconomic
position (SEP)*.
High SEP Intermediate SEP Low SEP
(25 330 - 87 620 £)† (8 517 - 25 554 £)† (7 387 - 11 917 £)†
Characteristics N Percent (SE) N Percent (SE) N Percent (SE)
Total 2 867 29.9 4 663 48.6 2 060 21.5 Men 2 513 87.7 (0.6) 3 429 73.5 (0.6) 569 27.6 (1.0) University degree 1 473 56.6 (0.9) 793 18.8 (0.6) 104 5.9 (0.5) Smokers 290 10.1 (0.6) 845 18.1 (0.5) 612 29.7 (1.0) Abstainers 227 7.9 (0.5) 745 16.0 (0.5) 747 36.3 (1.1) Heavy drinkers 558 19.5 (0.7) 821 17.6 (0.6) 142 6.9 (0.6) Unhealthy diet 167 5.8 (0.4) 507 10.9 (0.5) 306 14.9 (0.8) Physically inactive 189 6.6 (0.5) 512 11.0 (0.5) 730 35.4 (1.1)
Mean SD Mean SD Mean SD
Age (y) 45.0 5.8 43.3 6.0 46.0 6.0
SD= Standard Deviation; SE= Standard Error
For all baseline characteristics, the tests for heterogeneity across SEP groups are significant at p<0.001. * High SEP represents administrative grades, intermediate SEP professional or executive grades, and low SEP clerical or support grades. Unhealthy diet corresponds to eating white bread most frequently, using whole milk and eating fruit and vegetables less than 3 times a month. Physical inactivity corresponds to performing less than 1 hr/week of moderate and less than 1 hr/week of vigorous physical activity.
Table 2. Mortality as a function of socioeconomic position (SEP) and health behaviors at baseline
All-cause mortality Cancer mortality CVD mortality Other mortality
N Rate* (95% CI) N Rate* (95% CI) N Rate* (95% CI) N Rate* (95% CI)
Socioeconomic position
High (N=2 867) 191 2.99 (2.48, 3.60) 94 1.57 (1.20, 2.06) 52 0.63 (0.48, 0.83) 45 0.78 (0.52, 1.17) Intermediate (N=4 663) 306 3.68 (3.29, 4.13) 151 1.86 (1.58, 2.19) 78 0.95 (0.76, 1.19) 77 0.88 (0.70, 1.10) Low (N=2 060) 157 4.93 (4.00, 6.06) 66 1.56 (1.12, 2.18) 58 2.21 (1.60, 3.06) 33 1.16 (0.75, 1.79)
(Low - High) SEP 1.94 (0.78, 3.10) -0.01 (-0.68, 0.66) 1.58 (0.84, 2.32) 0.38 (-0.22, 0.98)
Health Behaviors Smoking Non smokers (N=4 746) 258 2.83 (2.50, 3.20) 131 1.24 (1.19, 1.68) 73 0.82 (0.65, 1.03) 54 0.59 (0.45, 0.78) Ex smokers (N=3 097) 204 3.16 (2.75, 3.64) 91 1.41 (1.14, 1.75) 65 1.01 (0.78, 1.29) 48 0.74 (0.56, 1.00) Current smokers (N=1 747) 192 6.47 (5.60, 7.47) 89 2.94 (2.37, 3.63) 50 1.79 (1.35, 2.37) 53 1.75 (1.33, 2.30) Drinking Abstainers (N=1 719) 136 4.29 (3.59, 5.12) 49 1.43 (1.06, 1.93) 58 1.92 (1.46, 2.51) 29 0.94 (0.64, 1.38) Moderate drinkers (N=6 350) 391 3.14 (2.84, 3.47) 191 1.55 (1.35, 1.79) 110 0.87 (0.72, 1.05) 90 0.72 (0.58, 0.88) Heavy drinkers (N=1 521) 127 4.63 (3.82, 5.60) 71 2.70 (2.09, 3.48) 20 0.66 (0.41, 1.06) 36 1.27 (0.89, 1.81) Diet Healthy (N=1 140) 62 2.85 (2.20, 3.70) 28 1.25 (0.85, 1.85) 20 0.98 (0.62, 1.54) 14 0.62 (0.36, 1.06) Moderately healthy (N=7 470) 515 3.56 (3.26, 3.88) 248 1.72 (1.52, 1.95) 152 1.05 (0.89, 1.23) 115 0.79 (0.66, 0.95) Unhealthy (N=980) 77 4.28 (3.41, 5.38) 35 1.94 (1.39, 2.72) 16 0.93 (0.56, 1.53) 26 1.41 (0.96, 2.09) Physical activity Active (N=1 431) 368 3.26 (2.93, 3.62) 183 1.66 (1.43, 1.93) 97 0.84 (0.69, 1.03) 26 0.75 (0.61, 0.93) Moderately active (N=2 240) 173 4.03 (3.47, 4.68) 79 1.83 (1.46, 2.28) 53 1.25 (0.95, 1.63) 41 0.96 (0.70, 1.30) Sedentary (N=5 919) 113 3.90 (3.17, 4.80) 49 1.55 (1.13, 2.13) 38 1.43 (1.01, 2.04) 88 0.91 (0.59, 1.41) Overall (N=9 590) 654 3.56 (3.29, 3.84) 311 1.70 (1.52, 1.90) 188 1.02 (0.89, 1.18) 155 0.84 (0.72, 0.98)
Table 3. The role of health behaviors in explaining the association between socioeconomic position and all-cause mortality. The Whitehall II Study. N=9590, Deaths=654.
Baseline assessment of health behaviors
Longitudinal assessment of health behaviors (Phases 1, 3, 5 and 7)
Difference between longitudinal & baseline
assessments HR 95% CI % attenuation‡ 95% CI HR 95% CI % attenuation‡ 95%CI Δ% attenuation# 95%CI Model 1* 1.60 (1.26, 2.04) 1.60 (1.26, 2.04) Model 1 + Smoking 1.36 (1.06, 1.74) 32% (21%, 70%) 1.38 (1.08, 1.76) 35% (19%, 65%) -3% (-12%, 3%) Model 1 + Alcohol 1.58 (1.24, 2.03) 3% (-10%, 17%) 1.51 (1.18, 1.94) 12% (0%, 36%) 9% (0%, 25%) Model 1 + Diet 1.55 (1.21, 1.98) 7% (-9%, 21%) 1.48 (1.16, 1.89) 17% (7%, 40%) 10% (0%, 28%)
Model 1 + Physical activity 1.57 (1.23, 2.00) 5% (-6%, 19%) 1.45 (1.14, 1.85) 21% (11%, 44%) 16% (4%, 39%) Fully adjusted Model † 1.31 (1.02, 1.69) 42% (21%, 94%) 1.14 (0.89, 1.47) 72% (42%, 154%) 30% (10%, 70%)
*
HR for lowest versus highest occupational position adjusted for sex and year of birth
†
HR for lowest versus highest occupational position adjusted for sex, year of birth and all health behaviors
‡ Percent attenuation= 100 x (β
Model 1+health behavior(s) - β Model1)/(β Model1) #
Table 4. The role of health behaviors in explaining the association between socioeconomic position and cardiovascular mortality. The Whitehall II Study. N=9585, Deaths=188.
Baseline assessment of health behaviors
Longitudinal assessment of health behaviors (Phases 1, 3, 5 and 7)
Difference between longitudinal & baseline
assessments HR 95% CI % attenuation‡ 95% CI HR 95% CI % attenuation‡ 95%CI Δ% attenuation# 95%CI Model 1* 3.05 (1.94, 4.78) 3.05 (1.94, 4.78) Model 1 + Smoking 2.67 (1.69, 4.21) 12% (5%, 24%) 2.66 (1.69, 4.19) 12% (5%, 25%) 0% (-3%, 3%) Model 1 + Alcohol 2.57 (1.62, 4.07) 15% (6%, 31%) 2.50 (1.57, 3.97) 18% (7%, 36%) 3% (-6%, 13%) Model 1 + Diet 3.16 (2.01, 4.99) -3% (-10%, 3%) 2.82 (1.79, 4.46) 7% (-1%, 17%) 10% (3%, 22%)
Model 1 + Physical activity 2.84 (1.80, 4.50) 6% (3%, 18%) 2.66 (1.69, 4.19) 12% (4%, 23%) 6% (-6%, 19%) Fully adjusted Model † 2.22 (1.37, 3.58) 29% (11%, 54%) 1.85 (1.15, 2.98) 45% (24%, 79%) 16% (2%, 38%)
*
HR for lowest versus highest occupational position adjusted for sex and year of birth
†
HR for lowest versus highest occupational position adjusted for sex, year of birth and all health behaviors
‡ Percent attenuation= 100 x (β
Model 1+health behavior(s) - β Model1)/(β Model1) #
Table 5. The role of health behaviors in explaining the association between socioeconomic position and non-cancer/non-CVD mortality. The Whitehall II Study. N=9585, Deaths=150.
Baseline assessment of health behaviors Longitudinal assessment of health behaviors (Phases 1, 3, 5 and 7)
Difference between longitudinal & baseline
assessments HR 95% CI % attenuation‡ 95% CI HR 95% CI % attenuation‡ 95%CI Δ% attenuation# 95%CI Model 1* 1.67 (1.01, 2.75) 1.67 (1.01, 2.75) Model 1 + Smoking 1.32 (0.80, 2.17) 46% (18%, 277%) 1.38 (0.84, 2.28) 37% (13%, 265%) 9% (-5%, 57%) Model 1 + Alcohol 1.69 (1.01, 2.80) 2% (-47%, 42%) 1.58 (0.95, 2.64) 10% (-19%, 126%) 12% (-11%, 127%) Model 1 + Diet 1.50 (0.91, 2.49) 20% (2%, 192%) 1.47 (0.89, 2.44) 24% (2%, 198%) 4% (-42%, 52%) Model 1 + Physical activity 1.61 (0.97, 2.68) 7% (-19%, 80%) 1.36 (0.83, 2.23) 40% (13%, 255%) 33% (3%, 221%)
Fully adjusted Model † 1.22 (0.72, 2.06) 61% (16%, 425%) 1.03 (0.61, 1.74) 94% (35%, 595%) 33% (-16%, 262%)
*
HR for lowest versus highest occupational position adjusted for sex and year of birth
†
HR for lowest versus highest occupational position adjusted for sex, year of birth and all health behaviors
‡ Percent attenuation= 100 x (β
Model 1+health behavior(s) - β Model1)/(β Model1) #