HAL Id: halshs-00784134
https://halshs.archives-ouvertes.fr/halshs-00784134
Submitted on 3 Feb 2013
HAL is a multi-disciplinary open access archive for the deposit and dissemination of sci-entific research documents, whether they are pub-lished or not. The documents may come from teaching and research institutions in France or abroad, or from public or private research centers.
L’archive ouverte pluridisciplinaire HAL, est destinée au dépôt et à la diffusion de documents scientifiques de niveau recherche, publiés ou non, émanant des établissements d’enseignement et de recherche français ou étrangers, des laboratoires publics ou privés.
Port-region linkages in a global perspective
César Ducruet, Hidekazu Itoh, Olivier Joly
To cite this version:
César Ducruet, Hidekazu Itoh, Olivier Joly. Port-region linkages in a global perspective. MoLos Conference ”Modeling Logistics Systems”, Oct 2012, Le Havre, France. �halshs-00784134�
Port-region linkages in a global perspective
César DUCRUET
National Center for Scientific Research (CNRS) UMR 8504 Géographie-Cités
F-75006 Paris, France1 Email: [email protected]
Hidekazu ITOH
School of Business Administration Kwansei Gakuin University, Japan
Email: [email protected] Olivier JOLY
Le Havre University, France Email: [email protected]
Abstract
The recent literature on ports and regional development mostly documents the weakening spatial fix of flows and the negative externalities of ports on their surrounding territories. Except for port impact studies that remain difficultly comparable across locations, such observations are mostly based on simplified measures of port activity, such as total port throughputs, and on developed countries. Arguing that port-region linkages have maintained in more subtle interdependencies, this paper provides a comparative approach including both mature and emerging economies comprising about 1,500 ports situated in more than 300 regions and 40 countries. The statistical analysis of combined commodity traffic data and regional socio-economic data confirms the affinity of certain port traffics with specific local characteristics. A global typology of port regions is proposed while pointing at noticeable influences between traffic volumes, types, and local economic structures. This research thus brings new insights about the territorial embedding of value chains and production networks. Keywords: commodity flows; maritime transport; ports; production network; value chain
1
1. Introduction
Linkages between ports and their host territories are often analyzed from the unidirectional perspective of the local economic and social impacts of port activities. The influence of local socio-economic conditions on port traffics remains much neglected in the literature as well as the more complex interdependencies at stake between port activities and regional development. Although it is recognized that ports continue to play an active role in urban development (Hesse, 2010), many scholars have focused on the erosion of local industry linkages from various angles such as the globalization of manufacturing, trade reorientation, uneven port performance and competitiveness, growing continental connectivity and importance of global carriers' decisions (Hoare, 1986; Slack, 1993; Hoyle, 1996; Overman and Winters, 2005; Lee and Rodrigue, 2006). The weakening spatial fix of ports was verified empirically through studying the location of maritime Advanced Producer Services on a world level (Jacobs et al., 2011), while large port terminals appeared to have limited and/or negative externalities of upon their local territory in Canada and the United States (McCalla et al., 2001; De Langen, 2007; Grobar, 2008; Hall, 2009; Jaffee, 2010). Yet, no study has provided a comprehensive and systematic analysis of ports' local linkages taking into account the diversity of port and other economic activities.
In this paper, it is argued that a global and comparative approach to port-region linkages can reveal more complex realities and their various combinations, following earlier works solely based on container traffics of port regions in advanced economies (Ducruet, 2009), which underlined the influence of regional economic specialization on traffic growth. Other recent works have also underlined the permanency of strong local linkages of port activities despite the aforementioned constraints and changes (Dunford and Yeung, 2009; Hall and Jacobs, 2012). Such a global approach can be seen as a contribution to a better understanding of how freight flows, and to some extent the wider organizational entities they reflect (i.e. global production networks and commodity chains), remain anchored in local territories and what is the nature, level, geographic diversity of such embedding (see Hesse and Rodrigue, 2006 for a useful discussion). Does port specialization relates with regional specialization? What is the relevant geographic scale for analysis? Are some port-region linkages more successful than others socially and economically? How do such trends vary according to the situation of the port region within its host country? Answering such questions must bring together a wide set of approaches from various angles, such as transport geography and economics as well as regional science and its recent developments within the so-called New Economic Geography. Empirically, the study rests on the elaboration of a global database of eighteen port and regional indicators covering more than 1,500 ports located in 300 port regions (40 countries) of the world.
The rest of the paper is organized as follows. The next section (Section 2) introduces the theoretical framework as well as the global database and some preliminary results on the correlations among selected indicators. The core of the paper lies in Section 3 where it is provided a multivariate analysis of port-region linkages as well as a typology of port regions. Section 4 complements the former analyses by a multiple regression simply verifying the mutual influence of port traffic performance and regional economic performance. The
conclusion identifies key contributions of this study and discusses them in light of their potential contribution to policy advice and further research pathways.
2. A global analysis of port regions
2.1 Theoretical framework
Most contributions about the mutual influence between transport flows and territorial development remain very theoretical while few of them deal directly with the case of ports and port regions. This paper thus can be seen as an attempt verifying a number of ideas promoted by various schools on the subject of transport and regional development. Throughout the New Economic Geography, there is a recognition that core and peripheral regions have different roles in attracting firms and functions, with more emphasis on overall transport costs than on the precise nature and volume of transport flows (see Lafourcade and Thisse, 2011 for a useful synthesis). Yet, Tabuchi and Thisse (2002) argue that agglomeration forces are commodity-specific and therefore depend on a certain degree of regional specialization. Notably, heavy industries and industries producing goods with high transport costs are more agglomerated than light industries and industries with lower transport costs. Behrens et al. (2006) as well as Fujita and Mori (1996) in the case of ports also considered crucial the situation of the gateway with regard to inland corridors and cities. One major outcome of the New Economic Geography is the belief that increasing the efficiency of transport infrastructure (of which ports) might exacerbate regional disparities and local economic downturn rather than increasing regional benefits (Fujita et al., 1999). Port regions provide a fertile ground to test the hypothetic link between specific commodity flows and specific economic activities taking place within localities, while pointing at different types of port regions according to their logistical and socio-economic profile. Their situation within the national territory and continental context should also be given paramount importance because port regions can be either cores or peripheries.
Other literatures point at the more managerial and strategic dimension of flows and territories, such as those on global commodity chains (GCC) and global production networks (GPN), which also remain very much conceptual or focussed upon one particular place or firm. Recent works have insisted on the need to further integrate such approaches with the one of world city networks (WCN) that are at the contrary more empirical in their study of the location of specialized services in so-called global cities (see Jacobs et al., 2010 for a useful synthesis). Successive stages along the production and distribution chain produce create needs in terms of related activities thus making locations more or less dependent on endogenous and exogenous services. As en effect of logistical constraints in densely urbanized places, the top European cities by their number of maritime Advanced Producer Services (APS) do not always handle higher valued-goods, such as London, nor do they always possess a seaport, such as Paris, Moscow, and Madrid, but certain port cities stand out by their exceptional score mainly due to the presence of a large industrial and logistics cluster, such as Rotterdam and Antwerp (Jacobs et al., 2010). The main difficulty generalizing such linkages lies in the functional and regional diversity of configurations. Thus, this research seeks both transversal
and regional trends in port-region linkages: although same economic sectors and commodity types do not develop and combine identically across the world due to historical legacies, socio-cultural differences, and economic imperatives, certain trends might be common to all continents.
2.2 Data presentation and methodology
The resulting sample consists in 353 port regions (of which 327 have the complete set of variables) located in 40 countries (Table 1). Ports located in those regions accounted for about 87.5% of total world port tonnage and 37.3% of total world population in 2009, the reference year of the study. One main difficulty of this research has been to access internationally comparable data at infra-national level. Although many other large countries do exert port activities, information collection remained impossible due to various constraints, such as the absence of socio-economic data at infra-national level despite the existence of good port traffic data (e.g. Argentina, Tunisia, Algeria, Singapore, Hong Kong, Cyprus) and vice-versa (e.g. Vietnam, Philippines, Russia, Indonesia). Except from Eurostat and OECD Territorial Database, data were collected from national organizations such as statistical offices, ministries, and associations2. The tonnage of individual ports was summed at administrative region level to allow a comparison with socio-economic aspects. Analyzing port-region linkages at administrative level remains hindered by two main limitations:
• their mismatch with the contours of port regions and port hinterlands: the proportion of port clients located inside the administrative region was not possible to calculate and even to compare with the actual distribution and weight of clients all over the country and even beyond national boundaries in certain cases. Port-related flows, businesses, and/or employment that can be directly, indirectly related to (or induced by) port activities are often not counted at local level by official statistics. Is was thus impossible to analyze port-region linkages based on harmonized definitions of functional port regions as in urban studies where the functional urban region is preferred to the administrative city that often misses a large part of overall urban activity;
• their heterogeneity in terms of spatial coverage and decentralization levels: despite many efforts from international organizations to harmonize different administrative levels across countries, discrepancies remain in size and decision power. In terms of size, regions in Australia, Canada, but also Brazil and China may appear too large compared with European counterparts whereas the lower administrative level may be spatially too small (e.g. US counties) and often offering limited socio-economic data. In terms of power, even countries with comparable spatial coverage of their regions may function very differently, such as the decentralized French Regions and the centralized British Regions all classified into NUTS-2 administrative level by the European Commission and Eurostat.
2
The selection of indicators is justified by the limited availability of regional indicators at world level (see Appendices 1 and 2 for an overview of data sources and the full list of variables). Port throughput indicators encompass the most widely accepted categories of commodities such as solid or dry bulks, liquid bulks, and general cargoes, as well as two complementary aspects, import and international. Bulk commodities comprise mostly raw materials, such as cereals, minerals, ores, and coal for solid bulks, liquefied gas, chemicals, oil and oil products for liquid bulks. General cargoes cover a wide range of products that can be either containerized, such as manufactured goods and food products, or in break-bulk form as intermediate inputs or parts (e.g. metals, machinery, etc.). Although those three categories thus remain much aggregated, their respective weight implies certain specialization in terms of cargo handling facilities in the port itself as well as different industrial and logistical linkages with the local and regional economy. However, the precise geographical distribution of such flows is unknown, such as the proportion of transit or transshipment flows. For such reasons it was decided to complement main categories with the volume of import and international throughputs. Import and inbound traffic were considered as one same category although they only partially overlap. While import throughput is always inbound-oriented for inland distribution and export throughput concerns overseas distribution, inbound throughput may in fact include exports (goods shipped from the hinterland to the port) and outbound may include imports (goods shipped from the port to the hinterland). International throughput basically corresponds to non-domestic origins and destinations; it thus excludes coastal shipping from total port activity.
Some regions in certain countries remained lacking some of the proposed indicators, such as the unemployment rate of most Brazilian states3, the Gross Domestic Product (GDP) of Cyprus districts, and most socio-economic data for a number of Indian states4. In several cases, the absence of accurate data obliged using other indicators, such as regional GDP per economic sector instead of employment (Mexico, India), and Gross Value Added (Brazil, South Africa) or average current income per household (Taiwan, Iceland) instead of regional GDP. The 12 original indicators allowed calculating various ratios such as GDP per capita, population density, as well as location quotients at country level (e.g. share of primary sector at region X divided by share of primary sector of the country). Such indices attenuate the influence of structural socio-economic differences and allow international comparison as some countries provide sample surveys only (e.g. India) or use different units (i.e. local currency, constant or current prices for national accounts). Other indices include the population, GDP, and traffic shares (%) in national totals. The share of regional GDP in national GDP, regardless of differences in units, made possible harmonizing the amount of regional GDP in US dollars based on World Bank figures on national level for 20095. Port traffic indices were calculated at world level due to the presence of single-port countries in the sample, such as Malta and Lithuania. Last but not least, the presence of inland capital cities
3 The unemployment rate is only available for 6 metropolitan cities so it was used as a proxy for state
unemployment.
4 India's Union Territories of Lakshadweep and Andaman and Nicobar Islands, as well as Goa and Puducherry.
5
inside certain port regions, such as the Capital Region in South Korea (Incheon, Seoul, and Gyeonggi Province), motivated the study to harmonize such delineation in the case where such capitals where spatially adjacent to (but not included in) the port region, thus resulting in the merger of eight coastal regions with eight inland capital city regions6. Wherever the inland capital city was not directly adjacent to the port region, such as Berlin being separated from Mecklenburg-Vorpommern (Rostock) by other regions, it was not considered as a single functional gateway, with reference to a classification proposed by Merk et al. (2011) on freight corridors and inland core economic regions.
[Insert Table 1 about here]
2.2 The specific role of port regions in territorial development
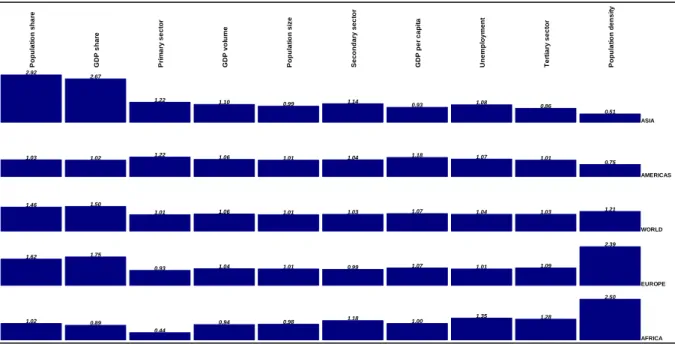
Before the analysis of trends and differences among port regions, interesting evidence can be obtained from comparing the relative characteristics of port and non-port regions. As was observed in Table 1, port regions' share in national GDP varies greatly from one country to the other due to multiple factors such as physical geography, political and administrative borders, industrial geography, etc. This approach serves a better understanding of the specificity of port regions, if any, compared with regions having no port activities. For each variable retained (except port throughputs) we calculated the average score of port and non-port regions per continental area, and the ratio between them (Figure 1). Such a broad scale of analysis is justified by the uneven number of port regions per country as seen in Table 1 as well as by the need to verify previous research on the influence of macro-regional backgrounds on logistical patterns (Lee et al., 2008; Rodrigue and Notteboom, 2010). Yet, the number of non-port regions is similar to the one of port regions globally, thus making this analysis worthwhile. On a world level, port regions always score higher than non-port regions but this is particularly true for three variables: population share, GDP share, and population density, followed by GDP per capita, GDP volume, and unemployment. This underlines the capacity of port regions to be more productive on average than non-port regions but this goes together with rising spatial, environmental, and social problems already well addressed elsewhere (Vallega, 1996). No specific economic sector seems preferential on such level of aggregation.
Certain regions keep their specificities, however. Asia stands out by the higher population and GDP share of port regions as well as by the higher importance of the primary (1.22) and secondary (1.14) sectors plus unemployment (1.08). Of course, this Asia-Pacific area is, at least economically, very heterogeneous but this profile might correspond to the importance of extraction and heavy production activities around ports (cf. Australia). Indeed in terms of
6 The cases include Haute Normandie and Ile-de-France (Paris, France), Valparaiso and Santiago (Chile), New
South Wales and Canberra (Australia), Selangor, Kuala Lumpur, and Putrajaya (Malaysia), Maryland and Washington DC (USA), Tianjin and Beijing (China), Inner and Outer London (UK).
traffic specialization, Asia has the highest score for solid bulk traffic (1.08)7. Many Asian port cities face difficult social situations and industrial reconversion, such as Incheon in South Korea (Ducruet et al., 2012), while Shanghai remains dominantly industrial despite its efforts to deploy a global city, service-oriented profile (Wang and Ducruet, 2012). Africa (here only based on Morocco and South Africa) has the highest divergence in terms of population density, unemployment, tertiary and secondary sectors, while its port regions score significantly lower than non-port regions in terms of GDP share, primary sector, and GDP volume. This situation can be explained by the inland location of main decision centers such as Johannesburg and Rabat, the respective capital cities, and of main mining sites creating the bulk of national added value. Port regions thus mostly serve as gateways between inland and overseas locations while suffering from higher social costs and lower economic benefits, sometimes fostering the need for balancing regional development through port-related projects as seen in the case of the Tangier-Med project (Ducruet et al., 2011). The Americas have the highest positive differential for GDP per capita and the primary sector (together with Asia); many American regions indeed function as energy production centers (e.g. Alaska, Campeche, Amazonas) creating among the highest indices of GDP per capita, while many important cities concentrating economic wealth belong to port regions, such as New York, Los Angeles, and Rio de Janeiro, to name but a few examples. Finally, Europe has in common with Africa a lower score for primary sector and a higher score for population density, its main port cities being often counted at the level of small administrative regions unlike in the United States for instance where the density of largest cities is diluted on the level of states. It also has a significant positive divergence for GDP share, population share, tertiary sector, GDP per capita, and GDP volume.
[Insert Figure 1 about here]
3. Global trends in port-region linkages
3.1 Correlations among main variables
Comparing the correlation between demographic size and port throughput volumes at national and regional level provides some first evidences about the linkages (Figure 2). At country level, the correlation is highly significant since about 82% of port throughput is explained by demographic size. The amount of cargoes thus nicely reflects the size of the national market that imports and exports such goods, notwithstanding local specificities8. China, Japan, South Korea, Australia, the Netherlands, and the United States have the largest negative residuals to the model (i.e. higher throughput volume than expected). The international trade of those countries is dominantly using sea transport (e.g. 99% for South Korea) due to physical factors
7
This corresponds to the average index among port regions
8 Weighting total port throughputs using the method of Charlier (1994) to reduce discrepancies between tonnage
units and value units did not provide a better determination coefficient (0.80). Some noticeable effects are the better visibility of Malaysia's transshipment functions for containers and the more balanced profile of the United States. At region level, the same method also produced a worse fit (0.32).
(islands) but also political (borders). Such factors are reinforced when strong emphasis is put on hub functions, such as in South Korea and the Netherlands, where about 40% of total container throughput in Busan and Rotterdam are occupied by transshipment flows, or on massive raw materials imports or exports, such as China and Australia. Conversely India, Brazil, Mexico, Morocco, and Turkey have a lower throughput volume than expected by their demographic size, partly due to logistic chains deficiencies such as cumbersome customs procedures.
[Insert Figure 2 about here]
At sub-national level, the correlation is expectedly lower than at country level (0.39) due to the lower probability for administrative divisions to overlap port hinterlands and market areas. Yet, the fact that almost 40% of port throughput distribution can be explained by local population size is in itself a very fruitful result given the influence of many disturbing factors. Most regions having higher throughput volumes than expected locate in China (e.g. Jiangsu, Zhejiang, Guangdong), South Korea (Gyeongnam, Jeolla), Australia (Western Australia, Queensland), the Netherlands (Zuid Holland), the United States (Louisiana, New York, Texas, California), Japan (Chiba, Kanagawa, Aichi), and Belgium (Antwerp province). This is similar to results obtained at national level that were caused by a concentration of transit flows and/or bulk flows at certain locations. The opposite trend (lower throughput than predicted) mostly applies to Indian states (Maharashtra, West Bengal, Andra Pradesh, Karnataka, Tamil Nadu) and other Chinese provinces (Sichuan, Heilongjiang, Jiangxi, Hunan, Chongqing). Reasons differ from one case to the other since such Chinese provinces only use inland or canal river shipping that is less accessible to larger vessels, and the Indian states face a lack of suitable port infrastructures. While such trends are very much similar to those obtained when plotting total throughput over GDP at both levels, more interesting is the correlation between the respective national shares of port throughput, population, and GDP. About 48-50% of port throughput share thus could be explained by the share of either population or GDP in national totals.
Due to the existence of numerous extreme values, the choice has been made to analyze ranked values instead of initial values. Some large regions such as in China, India, and the United States concentrate very large populations and traffics. Other ones had abnormal index levels in certain categories due to local uniqueness, such as Campeche (Mexico) having the world's highest index of GDP per capita relative to national average as an effect of its offshore oil extraction activity. Correlations between traffic and socio-economic variables on the level of the whole sample remain, however, rather limited (Figure 3). General cargo traffic appears positively correlated with population density and the share (%) of GDP in national total, thus suggesting the importance of urbanization in the concentration of higher valued (and more international) goods. Liquid bulk and import traffics are positively correlated with the amount of GDP per capita, probably because most countries in the selected sample are large importers of energy products (e.g. oil and gas) while regions specialized in energy extraction and
transformation often reach high per capita productivity although this is based upon a few industries and/or plants. The negative correlation between total port throughput and the primary sector suggest that such local economies often handle smaller traffic volumes than other regions, but the two other sectors do not correlate significantly with any port traffic variable. All other significant correlations occur within each group (either traffic or socio-economic variables) except from the absolute figures and the national shares as seen in previous Figure 2.
[Insert Figure 3 about here]
3.2 Factor analysis
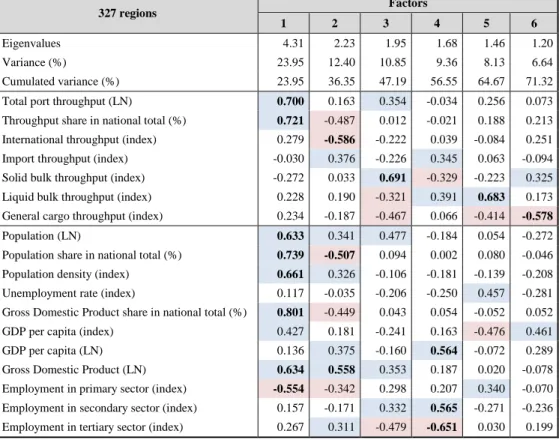
The factor analysis applied to rank values instead of initial values and provided six relevant factors concentrating about 71% of total variance (Table 2). Main trends first reveal significant evidences on port-region linkages since traffic and regional variables are often grouped together inside factors.
[Insert Table 2 about here]
The most significant trend is an opposition between the weight of port regions (absolute and relative) and their specialization in both solid bulks and the primary sector. On the one hand, this confirms that regions concentrating population and production also tend to concentrate traffics within their country, thereby implying that traffic distribution is not randomly distributed. On the other hand, the significant association between solid bulk traffics and specialization in the primary sector is by no means logical. Commodities such as agricultural products and mine products tend to concentrate in regions specialized in agricultural and mining activities. This opposition also implies that the latter regions are less likely to occupy a central role in their country and in the global hierarchy. Indeed, solid bulk and primary sector specializations are isolated from all other variables in the first factor. On the opposite side, other variables have more or less significance outside the most relevant ones about the national shares, which give more clue about the nature of those "core regions", which tend to attract more weighty and international traffics. Thus, there appears a certain association between absolute traffic size, national importance, and traffic geographic coverage of regions, while those specialized in solid bulks and the primary sector tend to have more modest roles in the port-region hierarchy. This evidence suggests rather logical linkages between economic specialization and throughput specialization: economic activities involving production and transformation handle more raw materials than tertiary activities (of which transport), while the latter have closer affinity with higher valued goods (general cargo) and need higher volumes of energy resources for consumption. As mentioned by Tabuchi and Thisse (2002),
higher valued activities are often less spatially concentrated than heavy industries and activities producing goods with high transport costs. It is also the case of many urban economies to be more service-oriented and more densely populated thus increasing the need for consumer goods and energy resources such as oil and gas. As a matter of fact, most largest economic, demographic, and logistical concentrations stand out on this first factor, such as the Seine Axis, Istanbul, Seoul/Incheon, Kuala-Lumpur/Port Klang, Athens, London, Tokyo, New York etc. in radical opposition with more remotely located regions such as Cornwall (United Kingdom), Jeju (South Korea), Northwest Territories (Canada), and Friesland (Netherlands) to name but a few.
The second most significant trend (factor 2) groups together the relative weight of the port region nationally (traffic, population, GDP), international traffic, and primary sector on the one hand, and GDP (total, per capita), import traffic, tertiary sector, density, and population on the other. One can deduce from this trend that more tertiary regions tend to be more wealthy and populated, which in turn fosters imports via local consumption. Examples include many port regions of the United States, Japan, and Europe, but also many Chinese regions due to the demographic and logistical "size effect". The opposite profile is thus better explained by the export of raw materials (international traffics) taking place at less populated and wealthy regions, but which occupy an important role at national level (higher share of population, GDP and traffics). The latter regions include numerous port regions from small and/or single-port European countries (e.g. Malta, Estonia, Romania) that come out mostly due to their national rather than global importance. Yet, no specific commodity type defines such profiles.
Turning to the third trend (factor 3), the type of commodities handled takes it whole meaning in relation to the socio-economic features of regions. On the one hand, solid bulk is positively related with the overall size of the region (traffic, GDP, population) and to the secondary sector as well as to the primary sector to a lesser extent. This profile typically indicates the possibility for certain regions to be large in size as well as specialized in more traditional activities. This specialization is directly apparent in the preference to raw materials traffic. Examples include many inland port regions in the United States (Michigan, Minnesota, Ohio, Indiana, West Virginia), Canada (Ontario), China (Anhui, Sichuan, Heilongjiang) but also coastal regions exporting large quantities of minerals and agricultural goods such as in Australia (Western Australia, Queensland), Mexico (Baia California), and India (Orissa, Andrah Pradesh). The opposite profile clearly groups the tertiary sector with general cargo, liquid bulk, import, and international traffics, as well as with GDP per capita (index) and unemployment. This profile comprises many urbanized regions playing a central role in the national and global economy (e.g. Oslo, Reykjavik, Bremen, Stockholm, Hamburg, Dusseldorf, Rome, Genoa, London, Athens, Lisbon, Casablanca) but also a number of peripheral ones being remotely located from core economic regions (e.g. Northwest Territories, Arica y Parinacota, Nunavut, Alaska, Mellersta Norrland) and/or islands and enclaves (e.g. Corsica, Hawaii, Ceuta, Melilla, Madeira, Malta, Canary Islands, Baleares, Azores). In fact, the tertiary sector encompasses a wide range of activities: urban regions are more likely to specialize in private services (e.g. finance, transport, retail) while peripheral
regions that lack of a productive economy tend to rely on the public sector. They have in common to exhibit higher unemployment levels than national average.
Lastly, attention should be paid to the fourth trend (factor 4) that depicts a profile of urban region specialized in solid bulks but with higher unemployment levels, opposed to a profile of industrial region specialized in liquid bulks but with higher GDP per capita than national average. One typical example of the former profile is Campeche state in Mexico, which concentrate most of the country's offshore oil extraction and has the world's highest index of GDP per capita relative to national average. The former profile often corresponds to peripheral regions facing difficult reconversion due to over-specialization in traditional activities, such as Gangwon in South Korea and Eastern province in Taiwan, which locate away from core economic regions.
Although further understanding the geographic logic of each factor would necessitate their cartographical representation, this article opted for mapping only the typology of port regions based on the same factor analysis.
3.3 A global typology of port regions
Eight types of port regions have been retained from the non-hierarchical clustering analysis applied to the six relevant factors (see Appendix 2 for a more detailed description of clusters). Each cluster is defined by a positive influence of certain variables appearing by order of importance, as well as by those having negative influence. The first two clusters (1 and 2) have in common certain issues such as higher unemployment levels, specialization in liquid bulk traffic, smaller share in total world port throughputs, and lack of industrial activities. In addition, "deprived port regions" have poor economic performance and higher specialization in primary activities, while "peripheral port regions" tend to be richer and rely dominantly on imports and services suggesting a dominance of local consumption. The two next clusters (3 and 4) also share certain features, such as being important demographic, economic, and port concentrations in their host country and handling more international traffics than world average, while concentrating noticeable shares of world port throughputs and liquid bulks. Their territorial profile differs, however, as "metropolitan port regions" are richer, more densely populated, and more service-oriented with lesser production activities but handling more general cargo, and "industrial port regions" typically resemble maritime industrial development areas where production and transformation activities dominate as well as liquid bulks. The next clusters (5 and 6) have in common to be large regions with high GDP with lower international and general cargo traffics than world average. "Productive port regions" are richer and more industrialized than average while handling more imports and liquid bulks, and "bulky port regions" are better defined by a large share of world port throughputs (50%), specialization in solid bulk traffics, and population density. Finally, the two last clusters (7 and 8) share a smaller size and lower liquid bulk traffics than average. "Transit port regions" specialize in higher valued goods and industrial activities while "traditional port regions" specialize in solid bulk traffics and the primary sector. The last cluster can be seen as a typical
class of agricultural and mining regions having lesser population density and higher exports than average, while transit port regions have lesser services.
The spatial distribution of clusters (Figure 4) shows interesting patterns in terms of recurrences in the location of certain types within countries and continents. Certain types are concentrated at specific areas, such as "bulky port regions" comprising many Chinese, Indian, Australian, North American regions as well as Kwazulu-Natal (South Africa) and southern Brazil, but no such type appears in Europe. Conversely, "metropolitan port regions" are few outside Europe: they underline the importance of some large cities such as Casablanca, Western Cape (Cape Town), Gujarat, Maharashtra (Mumbai), Kerala, Hyogo (Kobe), Osaka, and Kanagawa (Yokohama), others being national capital regions, such as Valparaiso-Santiago, New York, Selangor-Kuala Lumpur, Taipei, Seoul-Incheon, Auckland, and Tokyo. It is surprising that despite their metropolitan dimension, Shanghai and Beijing-Tianjin do not belong to this category, perhaps due to the still "developing" character of China defined by the importance of industrial sector and bulk traffics, but the same also applies to New South Wales (Sydney) in a totally different context. Inside Europe, not only national capitals but also other cities belong to this category: Zuid and North Holland (Rotterdam and Amsterdam), Hamburg, Provence (Marseilles), Liguria (Genoa), Hampshire (Southampton), Pomorskie (Gdansk), Skane (Malmo), and Izmir. Their location echoes the continental core-periphery pattern of economic and logistics activities (Lee et al., 2008) with few cases away from the European megalopolis: Lisbon, Attiki (Athens-Piraeus), Istanbul, Stockholm, Helsinki, and Oslo.
By contrast, many remotely located regions belong to the first two clusters and confirm the socio-economic difficulties of many UK and southern European regions. Elsewhere, deprived regions also locate away from core economic centers of their country (e.g. Hainan, Sabah, Hokkaido, Nova Scotia, Newfoundland), with the notable exception of California and Florida being often seen as rather dynamic port regions. Peripheral port regions underline the insular effect as many of them are islands or territories separated from mainland, such as Hawaii, Alaska, Okinawa, Baleares, Corsica, Ceuta and Melilla (Spanish enclaves in Morocco), Ionia Nisia (Greece), but also some states in the US such as Maine, Rhode Island, and Delaware. Industrial port regions also concentrate very much in Europe while often including large regional cities (e.g. Barcelona, Bilbao, Nantes, Antwerp, Bremen, Goteborg, Bergen) just like outside Europe with the examples of Texas (Houston), Veracruz, Antofagasta, Western Australia (Perth), Adelaide, Taichung, and many Korean regions of which Gyeongnam province (Busan). Productive port regions concentrate in certain parts only of the most globalized areas, such as Northern Italy in Europe and a number of regions in the United States and Japan. Those regions levy high rents from transformation activities (e.g. Louisiana) after importing raw materials for domestic redistribution (e.g. steelworks and petrochemical industries). Transit port regions often locate near metropolitan regions due to their gateway function (e.g. Valencia for Madrid, East Anglia/Felixstowe and Kent for London, Tangier in Morocco, Johor in Malaysia), while traditional port regions appear as small primary centers of economic and port activity dedicated to local resources such as in Mexico, Chile, Morocco, and Turkey.
[Insert Figure 4 about here]
4. Mutual influences between port and regional activities
A multiple regression investigates which variables most influence total regional port throughput on the one hand and total regional GDP on the other as dependent variables. The stepwise method was used to best select the variables having most significance on the model's results (Goldberg and Jochems, 1961; Gujarati, 2003). Four models are compared in their ability explaining each dependent variables, with detailed scores provided in Appendix 4. The first model (A1 and B1) includes only the original traffic and socio-economic variables used in previous sections. The other models contain additional variables, such as the dummy distinguishing amongst coastal and inland (river) port regions (models A2 and B2), the level of logistical performance of the belonged country as measured by the World Bank Logistics Performance Index (Arvis et al., 2012) as well as the DHL Global Connectedness Index (Ghemawhat and Altman, 2012) (models A3 and B3)9, and dummies for each continent where regions locate (models A4 and B4). Those newly added variables bring in contextual information about the environment in which port regions operate and develop, although the integration of national-level variables should in practice make use of multilevel regressions rather than classic multiple regressions, but this aspect has been kept for further research on these issues.
On the level of the whole sample, main results show that export-oriented traffics will affect positively total throughput and this effect is even more pronounced at richer countries. However, imports affect positively regional GDP as this relates to the ability of regions to consume flows locally and/or redistribute them towards the hinterland: the influence of imports is indeed higher when Europe and North America dummies are included, i.e. mostly import regions with important inland connectivity (Rodrigue and Notteboom, 2010). The coastal dummy has positive and negative influence on throughput and GDP respectively since seaports favor traffic concentration and economies of scale while inland regions tend to be more productive than coastal regions (see also Lever, 1995). The shares (%) of throughput and GDP have both negative scores, thereby implying that port regions may grow economically and logistically without being highly concentrated on a national level. This can be explained by the fact that higher shares often correspond to smaller countries where one or two regions concentrate a majority of GDP and/or throughput (e.g. Iceland, Malta, Estonia) but without equivalent importance in terms of absolute production/traffic volumes globally. The secondary sector has a strong positive effect on regional GDP mostly in developing
9 The LPI is a composite measure including 6 sub-categories (efficiency of customs and border management
clearance, quality of trade and transport infrastructure, ease of arranging competitively priced shipments, competence and quality of logistics services, ability to track and trace consignments, frequency with which shipments reach consignees, and within scheduled or expected delivery times). The DHL index is also composed of various sub-scores covering trade, capital, information, and people flows analyzed both in terms of total volumes (breadth) and importance in the national economy (depth).
countries, thus suggesting that transformation activities still generate more profits in relation with port activities, even in advanced countries. In comparison, the tertiary sector will have rather negative effects on GDP but mostly in less developed countries (model A2). While the DHL index does not play a significant role in either throughput or GDP, the LPI index that is much more defined by logistical quality and performance has a strong positive influence on both GDP and throughputs, for the latter mostly in poorer countries. Unsurprisingly, Asia and Oceania have positive influence on throughputs while North America is negative, thus confirming the hierarchy observed in previous Figure 4 and the importance of the continental context in which port regions develop and operate.
5. Conclusion
Despite all the methodological constraints inherent to a global and comparative analysis of local economies, this research has provided a snapshot of port-region linkages across more than 1,500 ports located in more than 300 regions and 40 countries. The central hypothesis of the research was the existence of functional and spatial affinities between types of traffics and types of regions. Several statistical analyses brought a number of answers as well as new questions about the mutual influence of port activities and regional development.
Generally speaking, the specialization and spatial distribution of port traffics is far from being randomly distributed over space. Port regions vary in function and importance according to the continental context. Although the same traffics such as liquid bulks may be associated with different types of local economies (e.g. poorer or richer), their concentration reveals various combinations. Deprived and metropolitan port regions both handle liquid bulks but this occurs in totally different socio-economic contexts and for different reasons, from transit and transformation to consumption. Traffic specialization is thus highly related with local skills and does not have the same meaning everywhere. Metropolitan port regions handle lesser traffic volumes but more valued goods than bulky port regions. Thus, the types of commodities passing through the port(s) of a given region not only reflect but also shape local economic structure and wealth. Export traffics foster total throughputs while import traffics foster economic growth. Such trends are largely due to the heterogeneity of the sample composed of both emerging and advanced economies. Yet, core and peripheral regions can be identified on all continents based on their common features.
This territorial embedding raises important policy issues. First, the path-dependency of traffic specialization suggests that port development can be a driver of regional development only under certain conditions. Reviving local economies that face important socio-economic difficulties through attracting new cargo flows might not always be a relevant option if policy-makers do not take into account the link with local industries. For instance, the emphasis put on containerization by numerous industrial port regions can result in weak local impacts due to the absence of specific skills and markets, while remaining a rather artificial implant bound to transit flows. Removing port activities based on environmental and aesthetic arguments notably through waterfront redevelopment in coastal cities may also have
underestimated negative impacts if their traffics still contribute to some extent to industrial and logistical development.
Further research shall insist more on the dynamics of traffic and regional specialization, perhaps by taking inspiration from existing empirical works on regional development with an evolutionary perspective (see for instance Neffke et al., 2009). Such an approach would better elucidate the co-evolution between the growth and diversification/specialization of both traffics and regions. Attracting certain traffic types in certain localities might have positive or negative effects on further port and regional performance. Other research pathways include the need to verify the influence of neighborhood on port regions' profiles notably via spatial autocorrelation tests as well as through applying multilevel rather than classic multiple regressions in order to better understand the role of the national context. Enlarging the current sample of port regions will face difficult challenges of data availability, but recent works on global maritime flows suggest the possibility complementing traditional port throughput data by vessel movement data while lowering problems of comparability across countries (see Van Hamme, 2012).
References
Arvis J.F., Mustra M.A., Ojala L., Shepherd B., Saslavsky D. (2012) Connecting to Compete
2012. Trade Logistics in the Global Economy. The Logistics Performance Index and its Indicators. The International Bank for Reconstruction and Development/The World Bank,
Washington.
Charlier J. (1994) Sur le concept de tonnages pondérés en économie portuaire. L'exemple du Northern Range. Les Cahiers Scientifiques du Transport 29: 75-84.
De Langen P.W. (2007) The Economic Performance of Seaport Regions. In James J. Wang et al. (eds.), Ports, Cities, and Global Supply Chains (Aldershot: Ashgate), pp. 187-202.
Ducruet C. (2009) Port Regions and Globalization. In Theo E. Notteboom, César Ducruet and Peter W. De Langen (eds.) Ports in Proximity: Competition and Coordination among
Adjacent Seaports (Aldershot: Ashgate), pp. 43-51.
Ducruet C., Carvalho L., Roussin S. (2012) The Flight of Icarus ? Incheon’s Transformation from Port Gateway to Global City. In Peter V. Hall and Markus Hesse (eds.) Cities, Regions,
and Flows, (London and NewYork: Routledge), pp. 149-169.
Ducruet C., Koster H.R.A., Van der Beek D.J. (2010) Commodity variety and seaport performance. Regional Studies 44(9): 1221-1240.
Ducruet C., Mohamed-Chérif F.Z., Cherfaoui N. (2011) Maghreb port cities in transition: The case of Tangier. Portus Plus (Online, Accessed December 2012).
Dunford M., Yeung G. (2009) Regional Development: Port-Industrial Complexes. In Rob Kitchin and Nigel Thrift (eds.) International Encyclopedia of Human Geography (Amsterdam: Elsevier), Vol. 8, pp. 285-294.
Fujita M., Krugman P., Venables A.J. (1999) The Spatial Economy: Cities, Regions and
International Trade (Cambridge and London: MIT Press).
Fujita M., Mori T. (1996) The role of ports in the making of major cities: Self-agglomeration and hub-effect. Journal of Development Economics 49(1): 93-120.
Ghemawhat P., Altman S.A. (2012) DHL Global Connected Index 2012. Analyzing Global
Flows and their Power to Increase Prosperity.
http://www.dhl.com/content/dam/flash/g0/gci_2012/download/DHL_Global_ConnectednessI ndex_2012.pdf (Accessed December 2012)
Goldberg S., Jochems D.B. (1961) Note on stepwise least-squares. Journal of the American
Statistical Association 56: 105-110.
Grobar L.M. (2008) The economic status of areas surrounding major U.S. container ports: Evidence and policy issues. Growth and Change 39(3): 497-516.
Gujarati D.N. (2003) Basic Econometrics (Fourth Edition, McGraw Hill).
Hall P.V. (2009) Container ports, local benefits and transportation worker earnings.
Geojournal 74(1): 67-83.
Hall P.V., Jacobs W. (2012) Why are maritime ports (still) urban, and why should policy makers care? Maritime Policy and Management 39(2): 189-206.
Hesse M. (2010) Cities, material flows and the geography of spatial interaction: Urban places in the system of chains. Global Networks 10(1): 75-91.
Hesse M., Rodrigue J.P. (2006) Global production networks and the role of logistics and transportation. Growth and Change 37(4): 499-509.
Hoare A.G. (1986) British ports and their export hinterlands: A rapidly changing geography.
Geografiska Annaler 68B(1): 29-40.
Hoyle B.S. (1996) Ports, Cities and Coastal Zones: Competition and Change in a Multimodal Environment. In Brian S. Hoyle (ed.) Cityports, Coastal Zones and Regional Change (Chichester: Wiley), pp. 1-6.
Jacobs W., Ducruet C., De Langen P.W. (2010) Integrating world cities into production networks: The case of port cities. Global Networks 10(1): 92-113.
Jacobs W., Hall P.V., Koster H.R.A. (2011) The location and global network structure of maritime advanced producer services. Urban Studies 48(13): 2749-2769.
Jaffee D. (2010) Labor and the geographic reorganization of container shipping in the U.S.
Growth and Change 41(4): 520-539.
Lafourcade M., Thisse J.F. (2011) New Economic Geography: The Role of Transport Costs. In André de Palma, Robin Lindsey, Emile Quinet and Roger Vickerman (eds.) Handbook of
Transport Economics (Cheltenham: Edward Elgar Publishing Ltd.).
Lee J.Y., Rodrigue J.P. (2006) Trade reorientation and its effects on regional port systems: The Korea-China link along the Yellow Sea rim. Growth and Change 37(4): 597-619.
Lee S.W., Song D.W., Ducruet C. (2008) A tale of Asia’s world ports: The spatial evolution in global hub port cities. Geoforum 39(1): 372-385.
Lever W.F. (1995) Regional economic growth and port activities in European cities.
Proceedings of the 5th International Conference Cities and Ports, Dakar, Senegal.
McCalla R.J., Slack B., Comtois C. (2001) Intermodal freight terminals: Locality and industrial linkages. The Canadian Geographer 45(3): 404-413.
Merk O., Ducruet C., Dubarle P., Haezendonck E., Dooms M. (2011) The Competitiveness of
Global Port-Cities : The Case of the Seine Axis (Le Havre, Rouen, Paris, Caen) - France.
OECD Regional Development Working Papers, no. 2011/7:
http://dx.doi.org/10.1787/5kg58xppgc0n-en (Accessed January 2013).
Neffke F., Henning M., Boschma R. (2009) How do regions diversify over time? Industry relatedness and the development of new growth paths in regions. Economic Geography 87(3): 237-265.
Notteboom T.E., Rodrigue J.P. (2005) Port regionalization: Toward a new phase in port development. Maritime Policy and Management 32(3): 297-313.
Overman H.G., Winters L.A. (2005) The port geography of UK international trade.
Environment and Planning A, 37(10): 1751-1768.
Rodrigue J.P., Notteboom T.E. (2010) Comparative North American and European gateway logistics: The regionalism of freight distribution. Journal of Transport Geography 18(4): 497-507.
Slack B. (1993) Pawns in the game: Ports in a global transportation system. Growth and
Change, 24(4): 579-588.
Tabuchi T., Thisse J.F. (2002) Regional Specialization and Transport Costs. Discussion Paper
No. 3542. Centre for Economic Policy Research (CEPR), London:
http://www.cepr.org/pubs/dps/DP3542.asp (Accessed December 2012).
Vallega A. (1996) Cityports, Coastal Zones and Sustainable Development. In Brian S. Hoyle (ed.) Cityports, Coastal Zones and Regional Change (Chichester: Wiley), pp. 295-306.
Van Hamme G. (2012) Territorial Impact of Globalization on Europe and its Regions (TIGER), Draft Final Report, The European Spatial Planning Observatory Network (ESPON)
2013 Programme, Applied Research Project 2013/1/1:
http://www.espon.eu/export/sites/default/Documents/Projects/AppliedResearch/TIGER/DFR/ TIGER_DFR_2012-02-28.pdf (Accessed December 2012).
Wang C., Ducruet C. (2012) New port development and global city making: Emergence of the Shanghai-Yangshan multilayered gateway hub. Journal of Transport Geography 25: 58-69.
Country No. port regions No. ports Avg. area (000s sq. km) Total port throughput (million metric tons) Share (%) in national GDP Unit Australia 7 39 1098.5 880.9 97.9 State TL2
Belgium 3 5 3.0 202.0 40.5 Province NUTS-2/TL2
Brazil 20 80 332.6 732.9 83.0 State - Bulgaria 2 2 17.1 21.9 22.8 NUTS-2 Canada 10 90 940.4 464.0 80.3 TL2 Chile 11 19 58.8 105.9 43.6 TL2 China 18 89 166.9 8031.7 76.8 Province - Croatia 1 1 24.7 19.7 32.0 NUTS-2 Denmark 5 34 8.6 81.8 100.0 NUTS-2/TL2 Estonia 3 6 6.3 34.4 76.6 NUTS-3 Finland 3 22 77.6 89.5 90.1 NUTS-2/TL2
France 16 20 23.6 310.3 36.4 Région NUTS-2/TL2
Germany 7 39 10.8 259.7 20.6 NUTS-2/TL2 Greece 11 25 10.8 110.9 96.2 NUTS-2/TL2 Iceland 2 40 51.5 6.2 100.0 Region - India 12 187 116.4 821.1 60.9 State - Ireland 2 10 34.2 40.8 100.0 NUTS-2/TL2 Italy 13 40 16.0 455.7 66.2 NUTS-2/TL2 Japan 39 172 8.0 1966.4 87.1 Prefecture TL3 Latvia 2 3 7.0 58.9 63.7 NUTS-3 Lithuania 1 2 5.2 34.3 12.4 NUTS-3 Malaysia 10 17 29.3 380.8 55.4 State - Malta 1 2 0.2 3.4 94.4 NUTS-3 Mexico 13 33 65.9 102.6 34.6 TL2 Morocco 9 12 67.9 40.0 52.9 Province - Netherlands 6 14 4.0 482.1 64.7 NUTS-2/TL2
New Zealand 2 15 132.5 42.7 100.0 Island TL2
Norway 6 26 42.4 145.7 93.9 NUTS-2/TL2
Poland 2 5 20.6 45.0 9.6 NUTS-2/TL2
Portugal 6 8 14.5 60.0 95.7 NUTS-2/TL2
Romania 1 3 35.8 35.2 10.5 NUTS-2
Slovenia 1 1 8.0 13.3 56.3 NUTS-2
South Africa 3 8 130.9 275.2 37.6 Province -
South Korea 7 26 14.2 1032.1 100.0 TL2
Spain 12 28 18.1 360.7 65.8 NUTS-2/TL2
Sweden 8 30 51.3 140.4 100.0 NUTS-2/TL2
Taiwan 4 13 9.0 235.7 100.0 Region -
Turkey 14 51 24.2 291.1 73.4 NUTS-2
United Kingdom 24 52 7.9 489.6 65.8 NUTS-2/TL2
United States 36 287 165.9 2052.0 86.8 State TL2
All countries 353 1,556 115.9 20963.3 72.5
Europe 148 484 18.9 3787.3 53.1
Asia-Pacific 99 358 132.3 13391.4 82.7
Americas 90 419 261.5 3457.5 83.1
Africa 12 20 83.7 315.2 41.3
327 regions Factors
1 2 3 4 5 6
Eigenvalues 4.31 2.23 1.95 1.68 1.46 1.20
Variance (%) 23.95 12.40 10.85 9.36 8.13 6.64
Cumulated variance (%) 23.95 36.35 47.19 56.55 64.67 71.32
Total port throughput (LN) 0.700 0.163 0.354 -0.034 0.256 0.073
Throughput share in national total (%) 0.721 -0.487 0.012 -0.021 0.188 0.213 International throughput (index) 0.279 -0.586 -0.222 0.039 -0.084 0.251
Import throughput (index) -0.030 0.376 -0.226 0.345 0.063 -0.094
Solid bulk throughput (index) -0.272 0.033 0.691 -0.329 -0.223 0.325 Liquid bulk throughput (index) 0.228 0.190 -0.321 0.391 0.683 0.173 General cargo throughput (index) 0.234 -0.187 -0.467 0.066 -0.414 -0.578
Population (LN) 0.633 0.341 0.477 -0.184 0.054 -0.272
Population share in national total (%) 0.739 -0.507 0.094 0.002 0.080 -0.046
Population density (index) 0.661 0.326 -0.106 -0.181 -0.139 -0.208
Unemployment rate (index) 0.117 -0.035 -0.206 -0.250 0.457 -0.281
Gross Domestic Product share in national total (%) 0.801 -0.449 0.043 0.054 -0.052 0.052
GDP per capita (index) 0.427 0.181 -0.241 0.163 -0.476 0.461
GDP per capita (LN) 0.136 0.375 -0.160 0.564 -0.072 0.289
Gross Domestic Product (LN) 0.634 0.558 0.353 0.187 0.020 -0.078
Employment in primary sector (index) -0.554 -0.342 0.298 0.207 0.340 -0.070 Employment in secondary sector (index) 0.157 -0.171 0.332 0.565 -0.271 -0.236 Employment in tertiary sector (index) 0.267 0.311 -0.479 -0.651 0.030 0.199
Figure 1: Socio-economic convergence or divergence between port and non-port regions
Figure 2: Correlations among throughput, population, and GDP at region and country levels
2.92 2.67 1.22 1.10 0.99 1.14 0.93 1.08 0.86 0.51 1.03 1.02 1.22 1.06 1.01 1.04 1.18 1.07 1.01 0.75 1.46 1.50 1.01 1.06 1.01 1.03 1.07 1.04 1.03 1.21 1.62 1.75 0.93 1.04 1.01 0.99 1.07 1.01 1.09 2.39 1.02 0.89 0.44 0.94 0.98 1.18 1.00 1.35 1.28 2.50 ASIA AMERICAS WORLD EUROPE AFRICA P o p u la ti o n s h a re G D P s h a re P ri m a ry s e c to r G D P v o lu m e P o p u la ti o n s iz e S e c o n d a ry s e c to r G D P p e r c a p it a U n e m p lo y m e n t T e rt ia ry s e c to r P o p u la ti o n d e n s it y
Figure 3: Spearman correlations among port-region variables
Appendix 1: Data sources
Port throughput data (2009) N.B.
Eurostat (Europe), American Association of Port Authorities (Mexico), Army Corps of Engineers (USA), Ports Australia (Australia), Ministry of Maritime Affairs and Fisheries (MOMAF, South Korea), Statistik Pengangkutan (Malaysia), States & Union Territories Maritime Boards (India), Transnet (South Africa), Ministry of Land, Infrastructure, Transport and Tourism (Japan), Statistics Canada (Canada), Agência Nacional de Transportes Aquaviários (Brazil), Directemar (Chile), Statistics New Zealand (New Zealand), Agence Nationale des Ports (Morocco), Icelandic Maritime Administration (Iceland), Ministry of Transportation and Communications R.O.C. (Taiwan)
Sabah state 2010 (international), China 2010 (throughputs), estimates for Iceland and New Zealand (international)
Socio-economic data (2009) N.B.
Eurostat (Europe), OECD Territorial Database (OECD countries), Instituto Brasileiro de Geografia e Estatística (IBGE, Brazil), Ministry of Labour and Employment & Central Statistics Office (India), Statistics Bureau, Ministry of Internal Affairs and Communications (Japan), Bureau of Statistics (USA), Institudo Nacional de Estadistica y Geografia
(Mexico), Haut-Commissariat au Plan (Morocco), Statistics Iceland (Iceland), National Statistics & Directorate-General of Budget,
Accounting and Statistics (Taiwan), National Statistical Office (Malta), Statistics Lithuania (Lithuania), Central Statistical Bureau (Latvia), Statistics Estonia (Estonia)
Chile 2005, Mexico 2010, Australia 2007 (employment)
Gross Value Added (South Africa 2005; Brazil 2009), national currency (Morocco 2007; Norway 2007; Turkey 2008), average current income per household (Taiwan 2010) (GDP)
Appendix 2: List of variables
Variable Unit Index
Total port throughput Metric tons Natural logarithm (LN)
Throughput share in national total % %
International throughput Metric tons Regional share / world share
Import throughput Metric tons Regional share / world share
Solid bulk throughput Metric tons Regional share / world share
Liquid bulk throughput Metric tons Regional share / world share
General cargo throughput Metric tons Regional share / world share
Population No. inhabitants Natural logarithm (LN)
Population share in national total % %
Population density Inhab./sq.km. Regional density / national density
Unemployment rate % Regional unemployment / national unemployment
Gross Domestic Product share in national total % %
GDP per capita $US Regional GDP per capita / National GDP per capita
GDP per capita $US Natural logarithm (LN)
Gross Domestic Product $US Natural logarithm (LN)
Employment in primary sector No. employees Regional share / National share Employment in secondary sector No. employees Regional share / National share Employment in tertiary sector No. employees Regional share / National share
Appendix 3: Description of port region clusters
Cluster
no. Cluster name Positive Negative
No. regions
Least distance to cluster
center
World traffic shares (%)* All SB LB GC 1 Deprived port regions Unemployment Liquid bulk Primary sector
GDP per capita (index) Secondary sector
Solid bulk GDP per capita (LN)
General cargo
46 Tees Valley &
Durham 10.6 5.6 21.4 8.5 2 Peripheral port regions Tertiary sector Import traffic Liquid bulk GDP per capita (LN) Unemployment National shares (%) Secondary sector Total size (LN) Solid bulk International 19 Azores 0.7 0.2 1.6 0.7 3 Metropolitan port regions Tertiary sector National shares (%) Population density GDP per capita (index)
International traffic Primary sector Solid bulk Secondary sector 44 Izmir 14.9 7.0 23.3 19.4 4 Industrial port regions National shares (%) Secondary sector International traffic Primary sector Liquid bulk Tertiary sector Population density 43 Ostra Mellansverige 11.7 8.7 18.1 10.6 5 Productive port regions
GDP per capita (index) Import traffic Secondary sector GDP (LN) National shares (%) Tertiary sector International traffic Unemployment General cargo 54 Ehime 8.3 6.3 11.5 8.7 6 Bulky port regions Total size (LN) Solid bulk Population density Liquid bulk International traffic Primary sector General cargo 44 Liaoning 49.8 68.6 22.6 45.8 7 Transit port regions General cargo Secondary sector Liquid bulk Total size (LN) GDP per capita (LN) Tertiary sector Solid bulk 37 East Anglia 2.1 0.7 0.8 5.4 8 Traditional port regions Solid bulk Primary sector Total size (LN) Liquid bulk Population density Import traffic General cargo 40 Samsun 1.8 2.8 0.8 0.9
Appendix 4: Stepwise multiple regression results
REGIONAL GDP(LN) All regions Economic level of belonged countries (GDP per capita in 000s US$) Low (<20) Middle (20<, <40) High (>40)
MODEL # A1 Beta t-value Beta t-value Beta t-value Beta t-value
Const. .165 .290 .054 .070 .527 .756 2.363 1.776 PORT Traf(LN) .588 18.680 .562 13.437 .563 14.018 .546 7.626 PORT Traf(%) -.031 -7.744 -.021 -4.369 -.067 -7.563 -.026 -3.228 PORT_Traf(international) -.283 -2.665 -.429 -2.614 .503 3.448 -.638 -3.817 PORT Traf(import) .611 5.042 .427 2.379 .456 2.918 .389 1.748 REGION Pop(density) -.014 -2.104 -.011 -1.218 -.025 -3.083 .055 1.633 REGION GDP(%) .039 7.199 .030 4.257 .077 7.757 .029 2.949 REGION_secondary .560 2.912 .841 3.157 .001 .005 .234 .631 Adj R"2 .577 .698 .706 .493 Durbin-Watson 1.078 1.188 1.461 1.787
MODEL # A2 Beta t-value Beta t-value Beta t-value Beta t-value
Const. 2.420 3.716 1.992 2.198 1.707 1.447 1.620 1.032 PORT Traf(LN) .593 19.674 .577 14.023 .605 14.122 .618 8.742 PORT Traf(%) -.031 -8.311 -.022 -4.946 -.058 -6.177 -.035 -4.652 PORT Traf(lmport) .600 5.163 .415 2.298 .402 2.371 .391 1.809 REGION GDP(%) .037 7.367 .028 4.115 .066 6.402 .037 3.970 REGION_tertlary -.942 -2.615 -.870 -2.095 -.371 -.590 .126 .108 Coastal region 0/1 -1.267 -6.293 -1.001 -2.834 -1.009 -1.416 -1.092 -4.656 Adj R"2 .608 .693 .647 .493 Durbin-Watson 1.089 1.132 1.283 1.691
MODEL # A3 Beta t-value Beta t-value Beta t-value Beta t-value
Const. -.858 -1.419 .482 .558 -.415 -.371 11.099 2.616 PORT Traf(LN) .466 15.260 .459 10.731 .511 11.569 .554 6.934 PORT Traf(%) -.023 -6.642 -.018 -4.685 -.051 -5.819 -.025 -3.130 PORT Traf(lmport) .413 3.917 .606 4.133 .472 3.046 .257 1.200 REGION GDP(%) .036 7.771 .038 6.537 .072 7.426 .025 2.464 REGION Pop(denslty) -.014 -2.331 -.012 -1.665 -.035 -4.225 .102 2.748 REGION primary -.189 -3.024 .041 .381 -.185 -2.571 .122 .732 REGION_secondary .438 2.645 .696 2.917 .054 .188 .305 .856 Coastal region 0/1 -.994 -5.482 -.438 -1.505 -.665 -1.033 -1.113 -4.113 DHL overall 2010 -.014 -2.665 -.069 -7.730 .006 .931 .012 .687 WB LPI 2010 1.375 8.398 1.368 4.673 .740 3.275 -2.452 -2.135 Adj R"2 .696 .810 .728 .530 Durbin-Watson 1.223 1.343 1.521 1.725
MODEL # A4 Beta t-value Beta t-value Beta t-value Beta t-value
Const. -2.216 -4.073 PORT_Traf(LN) .540 19.340 PORT_Traf(%) -.027 -8.223 PORT_Traf(lmport) .616 6.306 REGION_GDP(%) .041 9.876 REGION_Pop(denslty) -.010 -2.019 REGION_secondary .526 3.530 Coastal region 0/1 -.807 -4.821 DHL overall 2010 -.016 -3.005 WB LPI 2010 1.135 7.559 Europe .471 4.327 North America 1.096 8.900 Adj R"2 .750 Durbin-Watson 1.483 No. regions 327 115 120 92