HAL Id: cea-01394591
https://hal-cea.archives-ouvertes.fr/cea-01394591
Submitted on 21 Nov 2016HAL is a multi-disciplinary open access archive for the deposit and dissemination of sci-entific research documents, whether they are pub-lished or not. The documents may come from teaching and research institutions in France or abroad, or from public or private research centers.
L’archive ouverte pluridisciplinaire HAL, est destinée au dépôt et à la diffusion de documents scientifiques de niveau recherche, publiés ou non, émanant des établissements d’enseignement et de recherche français ou étrangers, des laboratoires publics ou privés.
Tomographic capabilities of the new GEM based SXR
diagnostic of WEST
A. Jardin, D. Mazon, Martin O’Mullane, J. Mlynar, V. Loffelmann, M.
Imrisek, M Chernyshova, T. Czarski, G. Kasprowicz, A. Wojenski, et al.
To cite this version:
A. Jardin, D. Mazon, Martin O’Mullane, J. Mlynar, V. Loffelmann, et al.. Tomographic capabilities of the new GEM based SXR diagnostic of WEST. Journal of Instrumentation, IOP Publishing, 2016, 11, pp.C07006. �10.1088/1748-0221/11/07/C07006�. �cea-01394591�
Tomographic Capabilities of the new GEM based
SXR diagnostic of WEST
A. Jardina,*, D. Mazona
,
M. O’Mullaneb,J. Mlynarc, V. Loffelmannc, M. Imrisekc, M. Chernyshovad, T. Czarskid, G. Kasprowicze, A. Wojenskie, C. Bourdellea and P. Malardaa
CEA, IRFM, F-13108 Saint Paul-lez-Durance, France.
b
Department of Physics, University of Strathclyde, 107 Rottenrow, G4 0NG Glasgow, UK
c
Institute of Plasma Physics AS CR, Prague, Czech Republic
d
Institute of Plasma Physics and Laser Microfusion, 23 Hery Street, 01-497 Warsaw, Poland
e
Warsaw University of Technology, Institute of Electronic Systems, Nowowiejska 15/19, 00-665 Warsaw, Poland
E-mail: [email protected]
ABSTRACT: The tokamak WEST (Tungsten Environment in Steady-State Tokamak) will start operating by the end of 2016 as a test bed for the ITER divertor components in long pulse operation. In this context, radiative cooling of heavy impurities like tungsten (W) in the Soft X-ray (SXR) range [0.1 keV; 20 keV] is a critical issue for the plasma core performances. Thus reliable tools are required to monitor the local impurity density and avoid W accumulation. The WEST SXR diagnostic will be equipped with two new GEM (Gas Electron Multiplier) based poloidal cameras allowing to perform 2D tomographic reconstructions in tunable energy bands. In this paper tomographic capabilities of the Minimum Fisher Information (MFI) algorithm developed for Tore Supra and upgraded for WEST are investigated, in particular through a set of emissivity phantoms and the standard WEST scenario including reconstruction errors, influence of noise as well as computational time.
KEYWORDS: Soft X-Rays; Tomography; Tokamak plasmas; WEST.
* Corresponding author.
– 1 –
Contents
1. Introduction 1
2. SXR plasma tomography principles 2
2.1. Tikhonov regularization 2
2.2. The minimum Fisher information method 3 2.3. Role of the regularization parameter λ 3
3. Tomographic tests 3
3.1. Phantom models of emissivity 4
3.2. Effect of the anisotropy factor τ 4
3.3. Optimized regularization parameter λ 5
3.4. Choice of the spatial resolution Np² 6
4. Application to the standard WEST scenario 6
4.1. A scenario from WEST Physics Basis 6
4.2. Associated SXR tomography 7
5. Summary 8
References 8
1. Introduction
The tokamak WEST, for Tungsten (W) Environment in Steady-State Tokamak, will start operating by the end of 2016 as a test bed for the ITER divertor components in long pulse operation. In this context, radiative cooling of heavy impurities like W is a critical issue for the plasma core performances [1]. Thus reliable tools are required to monitor the local impurity density and avoid W accumulation. To do so, plasma tomography in the Soft X-ray (SXR) range 0.1 keV – 20 keV is a useful tool to observe radial and poloidal distribution of impurities. Unfortunately, SXR tomography is an ill-posed inverse problem [2] in tokamak plasmas due to the limited number of Lines of Sight (LoS) and presence of noise in the measurements. Thus a
priori information is generally used as additional constraint imposed on the plasma SXR
emissivity to obtain a physically meaningful solution. The SXR diagnostic of WEST will be based on Tikhonov regularization with a Minimum Fisher Information (MFI) method adapted from the former Tore Supra tokamak [3, 4].
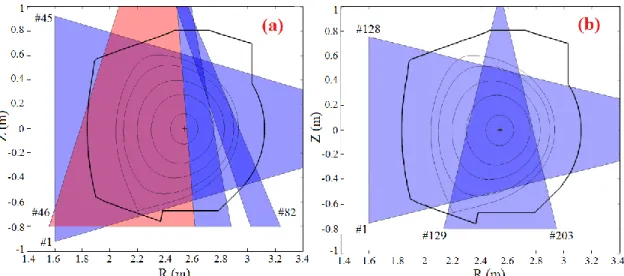
Figure 1. WEST plasma coverage of the (a) former Tore Supra diodes (b) new GEM based SXR cameras. The red part of the former viewing angle is lost due to the WEST upper divertor.
Unfortunately, most of the former SXR LoS of Tore Supra are lost due to the WEST upper divertor. Thus the design of the SXR diagnostic has been refurbished [5, 6] in order to be adapted to the WEST configuration, see Fig. 1. The WEST SXR diagnostic will be equipped with two new Gas Electron Multiplier (GEM) based poloidal cameras with a total of ~ 200 pixels, including 50 µm thick Beryllium windows that cut off SXR spectrum below 1 - 2 keV. They will work in “photon-counting mode” [7, 8] in contrast with former silicon barrier diodes working in “current mode”. Thus the system will perform 2D tomographic reconstructions with spectral resolution in tunable energy bands.
In this work tomographic capabilities of the MFI method initially developed for Tore Supra and upgraded for WEST are investigated. The paper is structured as follows. First, the main features of the tomography algorithm are described. Secondly, a set of emissivity phantoms is used to assess quality of the reconstruction, including computational time and the influence of experimental noise. Then, SXR tomographic reconstructions in a WEST scenario [9] are presented. Finally, conclusions and perspectives are given for WEST operations.
2. SXR plasma tomography principles
1.1 Tikhonov regularization
In this paper, The SXR plasma emissivity is discretized in the poloidal cross-section of the diagnostic on a matrix of Np × Np = Np
2
square pixels. The tomographic reconstruction of the emissivity elements 𝜀𝑗 from the line-integrated measurements mi is an inverse problem defined by the set of equations:
𝑚𝑖 = ∑ 𝑇𝑗 𝑖𝑗𝜀𝑗+ 𝑚̃ 𝑖 (2.1)
where 𝑚̃ denotes the experimental noise on the i-th channel and T𝑖 ij are the response matrix coefficients. Tij corresponds to the i-th chord length in the j-th pixel in the Line of Sight (LoS) approximation, as defined by the pinhole-detector geometry. A simple least-square minimization of the residual 𝜒2(𝜺) = ‖𝒎 − 𝑇. 𝜺‖2 would not be applicable here due to the
ill-– 3 ill-–
conditioned nature of the problem with quite few lines of sight and presence of experimental noise. In order to obtain a physically meaningful solution, a priori information is added through a regularization term 𝑅 = 𝜺𝒕 𝐻𝜺 in the functional = 𝜒2+ 𝜆𝑅, which can be minimized using vector differentiation [2]:
𝜺𝟎= 𝑎𝑟𝑔 𝑚𝑖𝑛
𝜺 (𝜒
2(𝜺) + 𝜆 𝜺𝒕 𝐻𝜺 ) = ( 𝑇. 𝑇 + 𝜆𝐻𝑡 )−1. 𝑇𝑡 . 𝒎 (2.2)
where the superscript t denotes the matrix transpose operation, H is the regularization operator and λ is the regularization parameter. Thus the solution of the tomographic reconstruction is a compromise between minimization of the residual and regularization of the solution, determined by the value of the free parameter λ. The choice of optimal λ values is discussed in section 1.3. 1.2 The Minimum Fisher Information method
The Minimum Fisher Information (MFI) method used here was first developed for Tore Supra [4] and is adapted for the WEST configuration. The regularization operator H is defined as:
𝐻 = (1 − 𝜏) 𝛻𝑡 ⫽. 𝑊. 𝛻⫽+ 𝜏 𝛻𝑡 ⊥. 𝑊. 𝛻⊥ (2.3) where 𝜵 denotes a discrete approximation of the gradient and W is a ponderation matrix:
{𝑊𝑖𝑗 = 1 𝜀𝑖𝛿𝑖𝑗, 𝜀𝑖 > 𝜀𝑚𝑖𝑛 𝑊𝑖𝑗=𝜀1 𝑚𝑖𝑛𝛿𝑖𝑗, 𝜀𝑖 < 𝜀𝑚𝑖𝑛 (2.4)
with 𝛿𝑖𝑗 the Kronecker’s delta and εmin > 0 the lower bound used for the zero emissivity regions.
The main upgrade from [4] consists in the decomposition of 𝜵 in two components 𝛻⫽ and 𝛻⊥ respectively parallel and perpendicular to the magnetic flux surfaces. The associated factor of anisotropic smoothing τ is introduced with 0 ≤ 𝜏 ≤ 0.5 in order to account for the privileged parallel transport direction. The effect of τ on the reconstruction is presented in Fig. (3).
1.3 Role of the regularization parameter λ
As introduced in Eq. (2.2), the regularization parameter λ quantifies the balance between overfitting of measurements and oversmoothing of the solution. Several methods exist to determine an optimal λ value like e.g. the L-curve corner selection [10]. In this work, λ is calculated with a dynamic regula-falsi method introduced in [11] such that the residual equals the experimental noise level. To do so, a normalized residual is defined as:
𝜒𝑁2(𝜆) = 1 𝑁𝑚∑ [ 𝑚𝑖 − 𝑚𝑖𝑟𝑒𝑐(𝜆) 𝜎𝑖 ] 2 𝑖 ≈ 1 (2.5)
where Nm denotes the number of measurements, 𝜎𝑖2 is the variance of the noise level on the i-th channel and 𝒎𝒓𝒆𝒄= 𝑇. 𝜺𝒓𝒆𝒄 are the retrofit measurements. The benefit of this method is that only structures of emissivity above the noise level survive the reconstruction process.
3. Tomographic tests
Tomographic tests prior to experimental use are essential to assess the performances and limits of the method. In this paper, the quality of the tomographic reconstruction will be assessed
thanks to phantom models of emissivity and using the figure of merits RMSem, which represents the root mean square of the reconstruction error:
𝑅𝑀𝑆𝑒𝑚= √𝑁1 𝑝2∑ (𝜀𝑖 𝑚𝑜𝑑− 𝜀 𝑖𝑟𝑒𝑐) 2 𝑖 (3.1) where εi mod
denotes the emissivity in the i-th element of the model, εi rec
is the emissivity in the i-th element of i-the reconstructed tomogram, and Np² is the total number of pixels.
3.1 Phantom models of emissivity
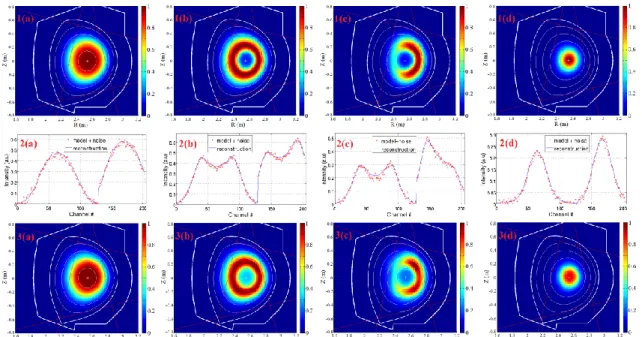
A set of 4 phantom models (Gaussian, hollow, banana and peaked) is used to mimic various experimental emissivity profiles such as impurity poloidal asymmetries, central accumulation [12] or hollow shape after a sawtooth crash. Emissivity phantoms give the advantage of knowing the initial emissivity distribution in comparison with experimental reconstructions. One example of each phantom model is presented in Fig. 2.1(a-d).
Figure 2. Phantoms of emissivity with 1(a-d) models, 2(a-d) associated measurements, 3(a-d) reconstructed profiles for (a) Gaussian, (b) Hollow, (c) Banana, and (d) Peaked shapes.
Synthetic SXR measurements are derived from these emissivity phantoms considering 2% of Gaussian noise level, see Fig. 2.2(a-d), and used as input for the tomography. Resulting tomograms are presented in Fig. 2.3(a-d), with an anisotropy factor 𝜏 = 10−2. Effect of τ value on the reconstruction is discussed in next section 3.2.
3.2 Effect of the anisotropy factor τ
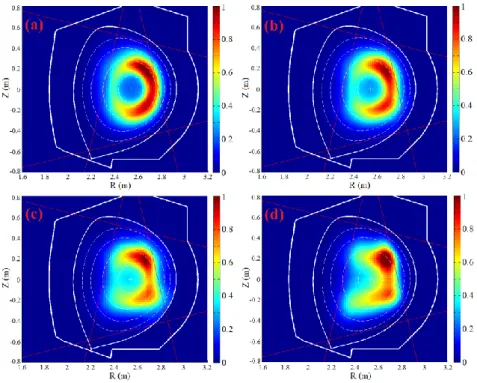
As introduced in Eq. (2.3), the anisotropy factor 0 ≤ 𝜏 ≤ 0.5 gives a privileged parallel transport direction. Given the magnetic equilibrium is well determined, such anisotropic regularization is better adapted to the plasma configuration and leads to an increase of the quality of the reconstruction. This is illustrated in Fig. 3 with the banana phantom model, for τ values from τ = 0.01 (anisotropic smoothing) to τ = 0.5 (isotropic smoothing) and 2% of noise. The disadvantage of introducing the magnetic equilibrium in the reconstruction is the associated increase of the computational time in the regularization process as presented in Fig. 5.
– 5 –
Figure 3. Effect of anisotropy factor τ on the reconstruction of the Banana phantom with (a) τ = 0.01 (b) τ = 0.10, (c) τ = 0.25 and (d) τ = 0.50.
3.3 The optimized regularization parameter λ
The optimized regularization parameter λ is determined as described in section 1.3, such that the normalized residual 𝜒𝑁2(𝜆) ≈ 1 with a tolerance of 5% on convergence of 𝜒𝑁2. This method allows finding a regularization parameter quite close to the best solution in terms of RMSem minimization, as illustrated in Fig. 4 with the Gaussian phantom model and for different noise levels from 1% to 10%.
Figure 4. λ optimization with the Gaussian phantom and different noise levels with (a) residual XN², regularization
3.4 Choice of the plasma spatial resolution
In this section, we discuss the optimal choice of the plasma spatial resolution Np x Np. First, the Tikhonov regularization is by nature only adapted to under-determined problems. As a result we should use a number of pixels Np² > NLoS ~ 200, thus Np ≥ 15. Then a set of 25 phantoms of the
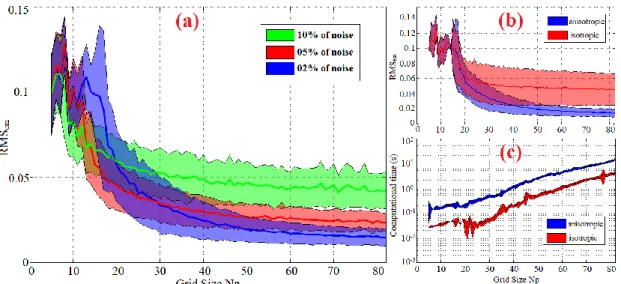
4 models with different sizes as introduced in section 3.1 is used to assess the quality of the reconstruction against the grid size, as presented in Fig. 5(a) for 3 different Gaussian noise levels of 2, 5 and 10% in measurements. The benefit and computational cost of anisotropic regularization is highlighted in Fig 5(b-c).
Figure 5. (a) Reconstruction error RMSem, (b) benefit of anisotropic regularization (τ = 0.01), and (c) associated
computational time versus spatial resolution Np.
Fig. 5(a) shows a global increase of the quality of the reconstruction with Np. On the other hand, the computational time is an increasing exponential function of Np. Np > 50 is time consuming (> 1s) and does not lead to a significantly better reconstructions while Np < 25 leads to quite poor reconstructions without any benefit in computational time (~10-50ms). As a result, Np ≥ 25 could be used for real-time or automatic post-processing analysis with dedicated fast computing units like e.g. FPGA, while Np ≥ 50 could be used for finer analysis.
4. Application to the standard WEST scenario
4.1 A scenario from WEST physics basis
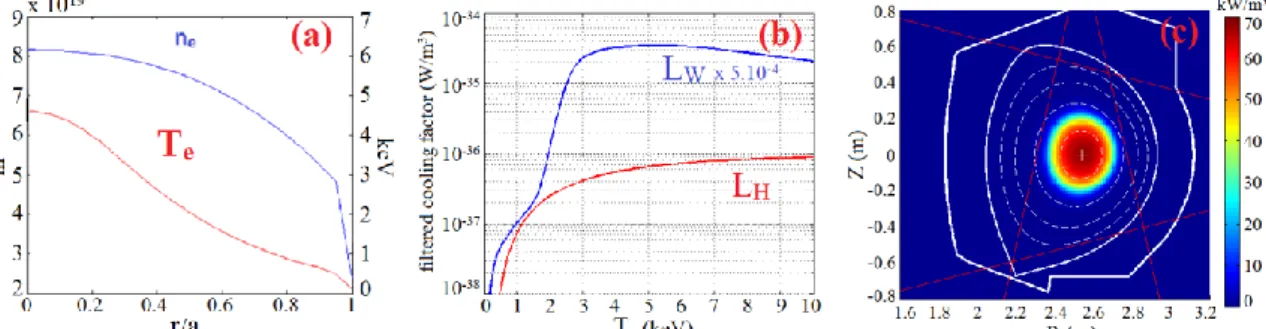
In this section, we apply the minimum Fisher method on SXR emissivity profiles extrapolated from the standard WEST physics basis [9] H-mode scenario with P = 12 MW of Radio Frequency heating power and Ip = 0.6 MA of plasma current. Electron density ne and temperature Te profiles are shown in Fig. 6(a). In this scenario, the tungsten density profile nW is assumed to be flat with nW ~ 10
16
m-3 and its concentration cW = 5.10 -4
at the separatrix. For simplicity, the spectral response of the GEM detector will be assumed here to be η = 1 in the SXR range ℎ𝜈 ∊ [0.1 – 20 keV], including the 50µm thick Beryllium filter that cuts off energies below 1 – 2 keV. The GEM spectral response characterization is the subject of ongoing parallel work [13]. The SXR emissivity is calculated as follows, considering only W impurities:
– 7 –
where 𝐿𝜂𝑊 and 𝐿𝜂𝐻 denote the filtered cooling factors of tungsten and deuterium. They are calculated according to Eq. (4.2):
{𝐿𝑊
𝜂 = ∑ 𝑓
𝑊,𝑞. (𝐾𝑊,𝑞𝜂,𝑏𝑏+ 𝐾𝑊,𝑞𝜂,𝑓𝑏+ 𝐾𝑊,𝑞𝜂,𝑓𝑓) 𝑞
𝐿𝜂𝐻 = 𝐾𝐻𝜂,𝑓𝑓 (4.2) where the W fractional abundances fW,q and line radiation (𝐾𝑊,𝑞
𝜂,𝑏𝑏
) are computed using respectively ionization-recombination coefficients and photon emissivity coefficients from the OPEN-ADAS database. Analytic formulae from [14] are used to compute Bremsstrahlung (𝐾𝑊,𝑞𝜂,𝑓𝑓, 𝐾𝐻𝜂,𝑓𝑓) and radiative recombination (𝐾𝑊,𝑞𝜂,𝑓𝑏) contributions. Deuterium is fully ionized where the SXR emissivity is significant inside the separatrix. Dielectronic recombinations are not included here as well as transport effect on 𝐿𝑊𝜂 [15] for simplicity. W line radiation is the dominant contribution overall.
Figure 6. (a) Temperature and density profiles of the WEST standard scenario (b) filtered cooling factors computed in the SXR range and (c) extrapolated SXR emissivity in the poloidal cross-section of the diagnostic.
4.2 Associated SXR tomography
The tomographic algorithm is then tested on the W dominated emissivity, as well as on the Deuterium emissivity only to account for a pure plasma case. The resulting reconstruction error maps are presented on Fig. 7.1-2(c) and show that the tomography is valid for both emissivity reconstruction due to impurities and main ions in a realistic case with < 10% reconstruction error in the region of interest where 𝑇𝑒≳ 1 − 2 𝑘𝑒𝑉.
Figure 7. Tomographic inversion of 1(a-c) Tungsten and 2(a-c) Deuterium emissivity calculated in section 4.1, with (a) SXR emissivity, (b) associated measurements assuming 2% Gaussian noise, and (c) 2D reconstruction error map.
5. Summary
In this paper, the SXR tomography originally used for Tore Supra has been adapted and upgraded for the WEST configuration. In particular, the regularization parameter λ is now routinely optimized using the 𝜒𝑁2(𝜆) ≈ 1 method, and the magnetic equilibrium can be included with the anisotropy factor 0 ≤ 𝜏 ≤ 0.5 to improve the reconstruction, but with an increase of the associated computational cost.
Tomographic capabilities for the new SXR diagnostic of WEST have been well-tested using a set of phantom models of emissivity and including influence of noise in the measurements. Finally, the tomographic reconstruction has been validated for the standard scenario from WEST physics basis including the presence of W impurities.
References
[1] T. Pütterich et al., Calculation and experimental test of the cooling factor of tungsten, Nucl. Fusion 50 (2010) 025012
[2] M. Anton et al., X-ray tomography on the TCV tokamak, Plasma Phys. Control. Fusion 38 (1996) 1849. [3] D. Mazon et al., Soft x-ray tomography for real-time applications: present status at Tore Supra and
possible future developments, Review of Scientific Instruments 83 (2012) 063505.
[4] A. Jardin et al., Comparison of two regularization methods for SXR tomography at Tore Supra, Phys. Scr. 91 (2016) 044007
[5] D. Mazon et al., Design of soft X-ray tomographic system in WEST using GEM detectors, Fus. Eng. Design 96–97 (2015) 856–860
[6] D. Mazon et al, GEM detectors for WEST and potential application for heavy impurity transport studies, ICFDT4 conf. (2016)
[7] M. Chernyshova et al, Conceptual design and development of GEM based detecting system for tomographic
tungsten focused transport monitoring, 2015 JINST 10 P10022.
[8] T. Czarski et al, Serial data acquisition for the X-ray plasma diagnostics with selected GEM detector
structures, 2015 JINST 10 P10013
[9] C. Bourdelle et al, WEST Physics Basis, Nucl. Fusion 55 (2015) 063017
[10] P.C. Hansen 1992 Analysis of discrete ill-posed problems by means of the L-curve SIAM Rev. 34 561–80 [11] V. Loffelmann et al, Minimum Fisher Regularization adapted to real-time tomography, Fusion Science and Technology 69 (2016) 505-513
[12] F. J. Casson et al, Theoretical description of heavy impurity transport and its application to the modelling
of tungsten in JET and ASDEX upgrade, Plasma Phys. Control. Fusion 57 (2015) 014031
[13] A. Jardin et al, Synthetic SXR diagnostic using GEM detectors on WEST, EPS conf. (2016) P5.023 [14] H.-J. Kunze, Introduction to plasma spectroscopy, 1st ed. New York: Springer, 2009.
[15] D. Vezinet et al., Impurity density derivation from bandpass soft x-ray tomography: applicability,