Vulnerability and
Adaptation Assessment
Climate Resilient Development
In Bundelkhand Region of Madhya Pradesh
Climate Resilient Development
In Bundelkhand Region of Madhya Pradesh
This report is prepared under the financial support by the for the project
region of India. The objective of the action oriented project was to enhance the adaptive capacities of vulnerable communities in Bundelkhand region, identify strategies for climate resilient development and mainstream climate change in development policy and plans.
Ms. Harshita Bisht, Ms. Jyoti Nair, Ms. Rashi Gupta, Development Alternatives
Swiss Agency for Development and Cooperation (SDC) Sustainable Civil Societies Initiative to Address Global Environmental Challenges in Bundelkhand
Authors Overall guidance Reviewers Acknowledgment
Design and Layout
Disclaimer
Mr. Anand Kumar, Development Alternatives
Dr. Shirish Sinha, Swiss Agency for Development and Cooperation
We place on record our gratitude to the Swiss Agency for Development and Cooperation (SDC) for providing the financial and institutional support and guidance to this task, Development Alternatives field team for providing field support, local communities of the project villages, local NGOs for their untiring work and enabling us to broaden our understanding of field realities, Environmental Planning and Coordinating Organization (EPCO) for coordinating and providing inputs in the state level workshops.
Mr. Kamal , K K Graphics & Printers Ms. Neha Gupta, Development Alternatives
The views, analysis, interpretations and conclusions expressed herein are those of the contributors/authors and do not necessarily reflect or can be attributed to the Swiss Agency for Development and Cooperation (SDC). information contained herein has been obtained from different secondary and primary sources and deliberations of the consultations/workshops organized by Development Alternatives, which the contributors/authors believe to be reliable and accurate. The contributors/authors, the reviewers and the supporting agency associated with the report are not liable for any unintended errors or omissions, opinions expressed herein. The contents of this report may be used by anyone providing proper acknowledgment
Publications in this series:
Vulnerability and Adaptation Assessment
Climate Resilient Development
In Bundelkhand Region of Madhya Pradesh
Vulnerability and
Adaptation Assessment
Climate Resilient Development
In Bundelkhand Region of Madhya Pradesh
Climate Resilient Development
In Bundelkhand Region of Madhya Pradesh
Information and Communication
Needs for Adaptation Mainstreaming Climate ChangeAdaptation in Policy and Planning
Climate Resilient Development
Contents
1. Introduction 1
. Methodology for Vulnerability Assessment 7
3. Results 13
4 Adaptation Measures for Bundelkhand 35
Annex - Policies & Programmes Related to Adaptation for Bundelkhand 43
In central India, regional climate model projections indicate that there are possible changes in future weather patterns that will significantly affect climate-sensitive agriculture, water, and health sectors . Development deficit and widespread reliance on agriculture as a source of nourishment and income makes Bundelkhand region particularly vulnerable to changes in the climate.
1
Figure 1: Geographical coverage of the project
1 Indo-UK Collaborative Project on Vulnerability and Adaptation Assessment of the Madhya Pradesh, 2011
The approach of transition from a poverty and vulnerability reduction orientation that primarily addresses development deficit in the region to one that responds to its climate adaptation deficit to promote climate-resilient development presents significant challenge.
1.1. Climate Change in India
The IPCC's Fourth Assessment Report and an ever-growing body of scientific research continue to illuminate the perilous nature of global climate change and the need to take action against its potential impacts. In India, climate change is a particularly serious challenge that will significantly impact the Indian economy (and the livelihoods that depend on it) due to a high reliance on climate-sensitive sectors such as
agriculture, forestry, and fishing . Agriculture, on which approximately 70% of the population is completely dependent, will be impacted by the expected change in predictability and variability in the availability of water . Thus, climate change may
2
3
alter the distribution and quality of India's natural resources
2 Sharma, S. K. & Chauhan, R., 2011. Climate Change Research Initiatives: Indian Network for Climate change assessment.
101(3), pp. 308-311.
Current Science,
3 Gosain, A. K., Rao, S. & Arora, A., 2011. Climate change impact assessment of water resources in India.
pp. 356-371
Current Science,
and adversely affect the livelihood of its people by affecting the agricultural productivity and thereby the quality of human life.
In India the most important climatic factor is the Indian summer monsoon because it plays a critical role in sustaining various economic, social and environmental systems of the country. The current observed climate and projected changes in the country as consolidated by the Second National Communication to the UNFCCC are highlighted below (MoEF, GoI).
The annual mean temperature
during the period
. has been observed
in the recent period between 1971 and 2007 and is attributed to intense warming caused in the decade of 1998-2007. Temperatures have increased in the winter season by 0.70°C and in the post-monsoon season by
0.52°C. The in the country
has shown an per hundred
years. The highest annual mean maximum temperatures are observed in the central (Madhya Pradesh) and north-western (Rajasthan) parts of the
country. The has also shown a
with a
. In the last thirty years this increase in minimum temperatures has been more pronounced with an increase in the temperature of 0.20°C every 10 years.
The mean rainfall in the country is 848mm with high variability. In a period of 139 years, there were a total of 23 deficient years and 20 excess years. Although no significant trend in rainfall has been observed on an all India basis
. Certain extreme precipitation trends have been noticed in the country. A trend analysis of extreme rainfall received over a day's period shows that such
.
has shown a warming trend of 0.56°C per hundred years
1901-2007 Accelerated warming
maximum temperature increasing trend of 1.02°C
minimum temperature
warming trend rise in temperatures by 0.12°C
per hundred years
, increasing and decreasing trends have been observed on a regional basis
extreme rainfall is increasing in many places in India
While some climatic changes are already beginning to manifest in India, regional climate models indicate greater impacts in the future. Using the PRECIS climate model (a regional climate model developed by the Hadley Centre, UK) under the IPCC A1B socio-economic scenario, a report released by the Ministry of
Temperature
Indian Summer Monsoon Rainfall
Environment and Forests projects the following climate change impacts for India :
A 3% to 7% increase in summer monsoon rainfall by 2030 as compared to 1970; decreased rainfall during winter and pre-summer periods in all regions except the Himalayan region.
The frequency of rainy days (2.5+mm) will decrease in most parts of the country.
Annual mean surface air temperature will increase from 1.7°C to 2°C by 2030, with lowest daily minimum and highest daily maximum temperatures increasing by 1°C to 4°C.
Scenarios show that every 1 °C rise in temperature will reduce wheat production by 4-5 million tonnes. Small changes in temperature and rainfall will have significant effects on the quality of fruits, vegetables, tea, coffee, aromatic and medicinal plants, and basmati rice. Pathogens and insect populations are strongly dependent upon temperature and humidity, and changes in these parameters may change their population dynamics. Other impacts on agricultural and related sectors include lower yields from dairy cattle and decline in fish breeding, migration, and harvests. Global reports indicate a loss of 10-40% in crop production by 2100.
4
l
l l
Various studies have been conducted to understand the implications of changes in key climate variables in India through projections or scenarios (INCCA, 2010; NATCOM, 2012). Some of the potential impacts will
adversely ,
increased vulnerability of forest areas through expected
increase in and
and a
and in turn food and livelihood security.
Studies by Indian Agricultural Research Institute (IARI) and others indicate greater expected losses in the Rabi crop. While in certain scenarios some crops such as groundnut and chickpea show an increase in yields with an increase in temperature and CO emissions, the yield of certain crops such as potato could decline.
impact availability of water resources
species losses induced changes in
habitat for many species negative impact on
agricultural productivity
2
Potential Impacts at the National Level
4 Kothawale, D. R., Munot, A. A., & Krishna Kumar, K. (2010). Surface air temperature variability over India during 1901-2007, and its association with ENSO. ,
(2), 89104.
Climate Research 42
Changes in climate may alter the distribution of important vector species (for example, malarial mosquitoes) and may increase the spread of such diseases to new areas. A significant threat is the increase in extreme climatic events such as cyclones, floods, and drought, and large declines in sown areas in arid and semi-arid zones occurring during climate extremes. Large areas in Rajasthan, Andhra Pradesh, Gujarat, and Maharashtra and comparatively small areas in Karnataka, Orissa, Madhya Pradesh, Tamil Nadu, Bihar, West Bengal and Uttar Pradesh are frequented by drought. About 40 million hectares of land is flood-prone, including most of the river basins in the north and the north-eastern belt, affecting about 30 million people on an average each year. Such vulnerable regions may be particularly impacted by climate change.
eleven Madhya Pradesh is the second largest state of India comprising of fifty districts spread across agro-climatic zones. As of 2011, the total population of the state is 72.6 million, with 72.37% of the population living in rural areas . The rural areas are primarily dependent on climate sensitive sectors such as agriculture making them highly vulnerable to impacts of climate change. In India, the most important climatic factor is the Indian summer monsoon because it plays a critical role in sustaining the economic, social and environmental progress of the country. The rural population heavily relies on primary sectors like agriculture, horticulture, fishery, livestock, poultry and forestry for livelihood. Due to climate change, these natural-resource based livelihood sources are expected to be impacted more than the other sectors.
is a critical resource in the state because several regions such as Bundelkhand suffer the dual challenges of scanty rainfalls and high run-off rates. The state is drained by rain-fed rivers and receives 1160 mm average rainfall annually (MP Resource Atlas 2007, MPCOST). Thus, the dependence on rain for the rejuvenation of water resources makes the region highly susceptible to the variations in distribution and pattern of rain. This irregular pattern eventually influences the groundwater resources. Already, the groundwater extraction is unsustainable (for reasons such as highly subsidised electricity and diesel based pump sets) which increases the insecurities in future scenario.
5
Water
1.2. Climate Change in Madhya Pradesh
5 Government of India. (2011). .
Census of India 2011; Provisional Estimates
Agriculture is pivotal to the state's economy, accounting for about 45% of the State Domestic Product (SDP) and more than 70% of the rural labour force . The state is classified into eleven agro-climatic zones and five cropping zones (based on cultivation of major crops) on the topography, soil type, land-use and climatic conditions. The net area sown is about 150.74 lakh hectares which is half of MP's geographical area. Total irrigation area of the state is 30.5% and about 70% of the area is rain fed. Cropping Intensity of the state is calculated to be 135%, 126% being the national average and 29 districts of the state have a higher net irrigated area than the country average. Also, the state contributes to 7% of the food production in India.
These figures point to the huge weightage agriculture has on the state's economy and livelihoods. The state has a large number of marginal and small farmers. In the semi-arid regions, extended dry season compel people to migrate as the food production and livelihood are becoming increasingly unreliable. Mono-cropping practice, which is prevalent even today in certain farms in the state, makes the crops susceptible to failure if there is any change in the climate conditions for optimal production. Also, a further rise in temperature can lead to pest emergence earlier than usual, making plants susceptible towards insect attacks. The most important crops are wheat, soybean, rice, sorghum ( ), maize, pulses (peas, beans, lentils), and groundnuts .
6
7
8 jowar
Climate Change Projections for Madhya Pradesh Temperature: According to Indian Institute of Tropical Metrology (IITM, Pune) the average surface daily maximum temperature, in the period 2030s is projected to rise by 1.8-2.0°C throughout Madhya Pradesh and the daily minimum temperature is projected to rise between 2.0°C to 2.4°C during the same period; the eastern half of the state experiencing more warming than the western half. By 2080s, the maximum temperature is projected to rise between 3.4°C to 4.4°C, with northern region experiencing warmer temperatures. The minimum temperature is likely to rise by more than 4.4°C all over MP.
6 Indo- UK Collaborative project on Vulnerability assessment and adaptation planning for MadhyaPradesh, 2011
7 MP COST, Resource Atlas 8 Indian State of Forest Report -2009
Rainfall: The climate data analyzed by IITM Pune indicates a declining trend for rainfall over the state of MP from 1901 to 2000. The water availability in the state has been declining. Shifting of rainfall pattern has affected the cropping patterns. Projections of rainfall in Madhya Pradesh for the period 2021 to 2050 indicates that there is likely to be a decrease in winter rainfall as one moves from the eastern part of MP to its western part. The decline in the winter precipitation will impact the wheat crop. In the pre-monsoon period, there is an increase in the rainfall only in the Southern part of MP, with a decrease in rainfall in all other parts .9
In the context of Madhya Pradesh, and especially the Bundelkhand region, exposure to variable climatic conditions causes high physical vulnerabilities. The region being largely rain-fed, it is perturbed with variable precipitation trends. Drought conditions are frequent in the region, leading to unstable socio-economic conditions. The varying temperature conditions influence the crop productivity in summers as well as in winters (due to frost). Monsoon is a critical determinant of the sowing time, which has been varying drastically in the past few years, causing big loss to farmers due to the paucity of correct and timely information.
Bundelkhand region of Madhya Pradesh is a semi-arid geography, which is significantly sensitive to climate change due to its internal weak conditions. Forest
1.3 Impacts and Vulnerabilities:
Bundelkhand
resources are rich in the central, eastern and southern parts, whereas the western area is susceptible to desertification. The incidence of poverty in the state is among the highest in the country, with people living below the poverty line increasing from 44.6% in 1993-94 to 48.6% in 2004-05. This is more so in rural rather than urban areas (53.6% in rural areas as against 35.1% for urban areas in 2004-05). The ecosystem stability is at a loss due to deforestation, resource exploitation, and low water recharge and so on. Maintaining and enhancing productivity in agriculture is one of the major challenges faced, due to loss of soil fertility and increasing cost of production owing to the largely rain-fed nature of agriculture in the state .10
9 Madhya Pradesh State Action Plan for Climate Change, 2012
Barren, undulating and semi arid geography of Bundelkhand
l Aggregated HDI rank is amongst the lowest in the country l l l l l l l l l
10 out of 13 districts classified backward
80% population dependent on agriculture and livestock
96% farmers' income from agriculture and livestock
85% cropped area in Kharif and 55% in Rabi (60% gross) is un-irrigated due to absence of irrigation facilities.
~70% irrigation is dependent on groundwater sources
Migration in normal rainfall years 15-20%, enhanced to 40% in drought years of 2007-08 Industrial development and tertiary sector contribution to economy is less than 20% (two industrial units registered in UP part between 1991 and 2006)
Per capita energy consumption 130 Kwh in UP side (All India average 411 Kwh) with industry share being only 18.7%
Literacy less than 50% (national average 65%) with female literacy less than 20%
1
Source: Multiple sources, UNDP Human Development Report, 2012, Report of Drought Mitigation, Inter-Ministerial Te a m , 2 0 0 8 , w w w. B u n d l e k h a n d i n f o . o rg , A B S S S ,
The Bundelkhand region comprising seven districts of Uttar Pradesh State and six districts of Madhya Pradesh State is
relative to other regions. It is a hard rock area with limited or inadequate groundwater resources, lacks infrastructure and access to improved technologies.
Climate data from 1980 to 2005 period has indicated an increase in the mean maximum temperatures in Bundelkhand region by 0.28 C, as compared to the complex, diverse, rain-fed, risky, under-invested, vulnerable, socio-economically heterogeneous, culturally unique, agrarian and backward
o
11 IITM, Pune; India Second National Communication to the United Nations Framework Convention on Climate Change, MoEF, Govt. of India, 2012.
12 ibid 13 14
Indo- UK Collaborative project on Vulnerability assessment and adaptation planning for MadhyaPradesh, 2011
http://www.wateraid.org/documents/ perspectivebundelkhand.pdf
Variable precipitation trends and extreme tempratures increases the risks of climate change in the drought
prone region of Bundelkhand
baseline period of 1960-1990. Analysis of simulated data generated by the PRECIS Regional Climatic Model predicts that the temperature throughout the year is likely to be higher; in the range of 2 to 3.5° C by mid-century . The major precipitation season is expected to shift by one month (from July to August) and the winter temperatures too are likely to become more erratic in the time slice from 2071 to 2100 with respect to baseline situation of the 1960-1990 period . The shift in the monsoon causes delay in sowing the seeds, which in turn delays harvesting and the potential yield is lesser in drier conditions. Annual average rainfall of the region falls between 800-1000 mm. The continuous drought years in Bundelkhand has severely affected the agricultural productivity and subsequently weakened the livelihood systems.
As per the Indo-UK collaborative project on Vulnerability and Adaptation Assessment of Madhya Pradesh , wheat productivity in the Bundelkhand Region is likely to decline by 14-20% as adjudged through the model under the A1B (2030) scenario.
The recent in
Bundelkhand impacted 16 million people; 40% of the region's farms were not sown, while 70% of ponds and tanks dried up. The people with smaller land holdings bec me prone to the high input costs in agriculture, lower profitability per unit of land and higher risks of crop failures . 11 12 13 1 drought period (2003 - 2009) a 4
The IPCC defines climate vulnerability as “the propensity of human and ecological systems to suffer harm and their ability to respond to stresses imposed as a result of climate change effects ”. Vulnerability to climate change in the context of rural agrarian livelihoods, like that of Bundelkhand region, is influenced by exposure to climatic (and non-climatic) hazards and the underlying sensitivity of the natural resource base to such hazards. These hazards together impact the human and natural systems adversely. The primary objective of vulnerability assessments is to identify people or places that are most susceptible to harm and to identify vulnerability-reducing actions. Identification of such target groups and their specification in terms of enhanced sensitivity or low adaptive capacity to the exposure aids the decision makers to recommend or implement definite policies to reduce the vulnerability. These assessments include identification of the characteristics of vulnerable systems, type and number of stressors involved, root causes, their effects on the system and the time horizon of the assessment.
15
Figure 2: IPCC Framework for assessing vulnerability
The overall approach followed for the vulnerability assessment sought to proactively engage stakeholders/ stakeholder institutions in a process of dialogue through the course of the assignments via workshops, brainstorming sessions, in-depth interviews, observing on-site conditions and Focussed Group Discussions (FGDs). This project was divided into four key components and under each component the major activities were as follows:
a) Set Up and Mechanisms for Effective
Delivery:
b) Vulnerability Assessment
c) Adaptation Planning and Option
Assessment
d) Planning and Capacity Development
Assessment
In order to run the project successfully, a short scoping phase had been designed with the following key activities: Situation Analysis for climate change adaptation in Madhya Pradesh and partnership development with EPCO and Planning Department, Government of Madhya Pradesh.
In order to achieve the above mentioned activities, thorough desk research was conducted to collate lessons from secondary information and convergent projects. Using the information vulnerability assessment in the six districts was calculated using the Livelihood Vulnerability Index Methodology (Hahn et al, 2009). In addition to assessing the vulnerabilities in the region the project approach emphasised on the desk research to study and analyze existing policy framework at state and national levels and relevant state public programmes and schemes. This was intended to identify gaps in convergence, requirement of planning support tools and monitoring indicators that enable policy-practice connects from a climate change lens. To validate the study, primary consultations (with line departments and local CSOs in the six districts) and FGDs (with the farmers in a randomly selected village) in each district of Madhya Pradesh part of Bundelkhand were conducted. Finally, the study incorporated a multistakeholder outlook aided by stakeholder consultations at regional, state and national levels. The aim was to share findings with identified stakeholders
Exposure
Sensitivity
Potential
Impact
Vulnerability
Adaptive
Capacity
15 IPCC, C. C. (2007). Contribution of Working Groups I, II and III to the Fourth Assessment Report of the Intergovernmental Panel on Climate Change. Cambridge Univ. Press, Cambridge.
from nodal agencies for climate change, technical and extension agencies to verify analysis, prioritize the list of adaptation measures, share lessons of vulnerability assessment and define a strategic road map for future initiatives.
Several researchers have put forward various methodologies to assess the vulnerabilities to climate change. One such methodology is the vulnerability assessment using
given by Hahn et al, 2009. The LVI methodology comprehensively evaluates the livelihood risks of the vulnerable communities posed by climate change. The methodology was tailored (using climatic data and secondary information verified by primary consultations) to meet the local rapid assessment needs of the current study. It measures the socio-economic vulnerabilities of a region using IPCC's three contributing factors to vulnerability
-. The reason for the selection of this methodology is that it presents a framework for grouping and aggregating indicators at the district level, which can be critical for development and adaptation planning. In addition, the sub components and weighing measures of the index can be adjusted in relevance to the local community needs of Bundelkhand. This provides an added advantage over other methodologies where these components are more or less fixed. Lastly, it is a socio-economic vulnerability index in which the socio-economic indicators are standardized, therefore it is designed to provide Livelihood Vulnerability Index
exposure, sensitivity and adaptive capacity
2.1. Measuring Vulnerability to Climate
Change in Bundelkhand
development organizations, policy makers, and public health practitioners with a practical tool to understand demographic, social, and health factors contributing to climate vulnerability at the district or community level . It is a flexible tool so that researchers and planners can tailor the framework to meet the needs of unique geographic areas such as that of Bundelkhand. Thus, variation and applicability are its biggest advantage .
16
17
The vulnerability profiles of six districts of Bundelkhand (M.P. part) were calculated using the climatic data for the region and secondary information obtained from the state's statistical records. The results were further verified by primary data collection in the region. The climate data was used to understand the variability of climate and the long term trend of parameters. For the purpose of conducting vulnerability assessment, indices were computed for all six districts under study. Secondary data was collected and normalized at the district level and census at the block level was used to derive the vulnerability contributing factors
-of each district and census at the block. Each contributing factor was determined using proxy indicators listed in Table 1. The LVI uses a balanced weighted average approach where each sub-component contributes equally to the overall index even though each major component is comprised of a different number of sub-components. The LVI formula uses the simple approach of applying equal weights to all major components . The following equations are derived to calculate the vulnerability of these districts:
exposure (E), sensitivity (S) adaptive capacity (A)
-, and
18
19
16 Hahn, M. B., Riederer, A. M., & Foster, S. O., 2009. The Livelihood Vulnerability Index: A pragmatic approach to assessing risks from climate variability and changeA case study
in Mozambique. , (1), 7488.
17 ibid
Global Environmental Change 19
18 Sullivan, C., Meigh, J.R., Fediw, T.S., 2002. Derivation and testing of the water poverty index phase 1, Final Report. Department for International Development, UK, 2002. 19 Hahn, M. B., Riederer, A. M., & Foster, S. O., 2009. The
Livelihood Vulnerability Index: A pragmatic approach to assessing risks from climate variability and changeA case
study in Mozambique. , (1),
7488.
Step 1: Indicators
Step 2: Profiles
Step 3: Components
Step 4: Vulnerability Index
l Values for all the indicators are to be standardized for all the districts.
Where, Ix = Standardized value for the indicator
Ia = Value for the Indicator I for a particular district, d. I (min) - Minimum Value for the indicator across all the districts I (max) = Maximum Value for the indicator across all the districts.
where, - number of indicators in the profile Indicator Index Index of the i th indicator.
where W is the weightage of the Profile
l l l l l l l l l
Indicator Index (Ix) =
Indicator Index Values are combined to get the values for the profiles Profile =
Values of the profiles under a component are to be combined to get the value for that component. Component =
Weightage of the profile will depend on the number of indicators under it such the
The combination of the value of the three components will give the vulnerability Index. Vulnerability Index = (exposure - Adaptive Capacity) x Sensitivity
Scaling in done from -i to +i indicating low to high vulnerability
(P) (C) n i -i P1 within a profile each indicator has equal weightage
I - I (min)a I (max) - I (min) Indicator Index1 n n i = 1W PiPi i = 1WPi i = 1 Contributing Factors Exposure (E) Sensitivity (S)
Adaptive Capacity (A)
Components Climate Demographics Ecosystem Agriculture Socio-economic Weightage (Wpi) 2 2 3 7 9 Sub-Components Temperature variability
Annual average rainfall
Percentage of rural population to the total population Sex ratio
Percentage forest cover Area of waste land
net annual groundwater availability irrigation intensity
Cropping intensity
Per capita food grain production
Livestock population per hectare of net sown area Number of cultivators
Number of agricultural workers Total literacy rate
Number of health care centres per thousand persons Per capita rural electricity consumption
Number of electrified pump sets per thousand hectares of gross cropped area
Average daily employment in working registered factories per lakh population
Total no. of BPL families
Number of small farmers (0-2 hectares landholding)
Number of agriculture credit societies per lakh cultivators Number of hand pumps per thousand population
Number of agricultural machinery
Table 2: Major components and sub components comprising Livelihood Vulnerability Index for the six districts of Bundelkhand Region of Madhya Pradesh
2.2. Selection of Indicators for the
Vulnerability Index
Exposure
Climate
Demographic
A holistic set of indicators have been selected in the current study in order to represent the contributing factors for vulnerability i.e. exposure, sensitivity and adaptive capacity. The indicators are representative of the livelihood and socio-economic vulnerabilities in the six districts of climate sensitive region of Bundelkhand.
This factor includes the current climate variability in the region, indicating the temperature and rainfall variability in the region. Higher inter-annual rainfall variability indicates a higher probability of unanticipated amounts of rainfall in a given year. This could mean flooding, drought, or simply below/above average rainfall that impacts agriculture (e.g. farmers planting a crop suited for below- average rainfall, but then receiving above-average rainfall, causing decreased yields and/or the opportunity cost of increased yields with an alternative crop suited for the above-average rainfall). Also, rainfall is crucial in water recharge and in rain-fed cultivation systems. Additionally, temperature variability exposes the region by affecting crop productivity (due to uncertainties), increased evapo-transpiration losses and decrease in soil moisture.
More than 70% of the rural labour force is engaged in the agricultural sector and is therefore highly dependent on agriculture for their subsistence and income. Agriculture is one of the most sensitive sectors to a variable climate. Therefore, the rural population percentage acts as a proxy for the degree to which a district's population relies on agriculture for their livelihood, which correlates with climate change sensitivity.
The low sex ratio further increases the sensitivity of women towards climate change due to increased cultural and social pressures additionally increasing their already high vulnerability to climate change. Women and young girls are the responsible for the basic necessities in a household i.e. securing drinking/potable water, food, and fuel. Impacts of climate change such as drought and erratic rainfall will further deteriorate their position. In order to meet these Percentage of rural population:
Sex ratio:
needs, women (and girls) may have to traverse long distances and spend more of their time collecting water and fuel. Girls may have to drop out of school to help their mothers with these tasks, continuing the vicious cycle of poverty and inequity. This will further limit their access to information and awareness.
The forest resources are highly sensitive to the impacts of climate change. The climatic uncertainties in future may affect the composition and distribution of forest resources. This will disturb the delicate balance of bio-geochemical cycle, making the forests prone to degradation. This will also affect the forest productivity. Lastly, this may result in habitat shifting of fauna in the region (e.g. disturbance in the tiger territories in Panna district of Bundelkhand).
The wasteland in the region increases the sensitivities due to loss of land's fertility, thus decreasing the land area fit for farming or grazing in the region. The area of wasteland increases with the changing soil moisture conditions, climate change is thus likely to affect the situation of wasteland in the semi-arid geography.
The variability in rainfall may affect the recharging of groundwater in the region. This may also result in over-extraction of groundwater resources.
Climate variability and impacts such as drought will affect the water resources (e.g. water in wells, dug wells, ponds) available for agriculture. The vulnerability of the irrigation sources makes irrigation highly sensitive.
It refers to raising a number of crops from the same field during one agricultural year. This indicates the pressure on the same amount of land for farming. Cropping is directly related to the irrigation facilities available, thus indirectly making it sensitive to climate change.
Crop productivity is highly sensitive to extreme events in the region, thus increasing the susceptibility in terms of availability/unavailability of sufficient food produce in the region.
Forest cover:
Area of wasteland:
Net annual groundwater availability:
Irrigation intensity:
Cropping intensity:
Per capita food grain production:
Sensitivity
Ecosystem
Livestock population per hectare of net sown area:
Number of cultivators:
Number of small farmers (0-2 ha landholding) and agricultural labour:
Number of agricultural workers:
Total literacy rate:
Number of agriculture credit societies per lakh cultivators:
Number of health care centres per thousand persons: Livestock - an adaptation option - has itself become highly prone to uncertainties of climate change. Adverse impacts of climate change in the Bundelkhand region (such as increasing extreme temperatures, increased frequency of droughts, scarcity of water resources, and poor availability of fodder) have severely affected the livestock population in the region. Their sensitivity may further increase due to the occurrence of new unidentified diseases, heat strokes and low productivity.
This indicates the dependency on agriculture as a major source of livelihood, which is one sector that is highly sensitive to climate change.
Small and marginal farmers are more sensitive to climate variability because they tend to have less resources/means to respond to external pressures. Districts with relatively higher numbers of small farmers will be more sensitive to climate variability.
Agriculture workers are highly sensitive to climate change due to lack of permanent farming resources to sustain themselves. These workers depend on other farmers and work on their lands on a seasonal basis. The temporary nature of their livelihood source further increases their sensitivity to climate change.
The literacy rate acts as a proxy for the general level of human capital (i.e. education) in a district. Higher levels of human capital allow for improved access to information and thus a higher degree of adaptive capacity.
Agriculture credit societies increase adaptive capacity by providing financial services that can help farmers recover from a poor harvest or losses due to extreme events such as drought.
Health care facilities increase adaptive capacity by providing infrastructures to respond to the health impacts of climate variability.
Adaptive Capacity
Socio-economic
Number of handpumps per thousand population:
Per capita rural electricity consumption:
Number of electrified pump sets per thousand hectares of gross cropped area:
Average daily employment in working registered factories per lakh population:
Total number of BPL families:
Agricultural machinery:
The availability of hand pumps indicates access to groundwater resources, an additional source of water for the community. Having access to this type of water resource increases adaptive capacity to drought and related climate stressors.
This indicates the relative state of development in rural areas of each district. More developed areas have a higher adaptive capacity due to greater access to resources such as irrigation pumps (for which rural electricity consumption serves as a proxy) with which to respond to climate variability.
This shows the capability of farmers to source water from nearby irrigation canal or groundwater source. This also reduces the use of diesel based pump sets in the region.
This indicates the availability of alternative sources of livelihood, which can act as an appropriate adaptation strategy for agricultural workers.
Poor families will be less able to adapt to climate stressors due to lack of resources. Districts with higher numbers of BPL families will have a lower adaptive capacity.
Agricultural machinery serves as a proxy for the state of agricultural development in each district. Districts with more agricultural machinery are assumed to be more developed. A more developed agricultural sector will have a higher adaptive capacity to climate variability.
In addition, block level assessments were also carried out for each of the six districts. This was intended to prioritize the vulnerable blocks for future adaptive planning. Various indicators were selected for developing the profile. These indicators include the average number of drought events in past ten years, average rainfall (in mm) average temperature (in centigrade), rural BPL families, per capita forest cover, ground water table (in metres), wasteland (in hectares), work force in agriculture, yield per hectare, net irrigated area, number of pump sets per ha, agricultural land, per capita loan, average land holding, livestock population etc. The vulnerability profile obtained in the
results is in the range of -1 to +1, showing low to high vulnerability. The study, however, faced obstacles due to data constraints.
Block level vulnerability assessment was conducted to prioritize the blocks for rapid primary assessment. Extensive series of consultations were held at the block, district and state levels. State level consultations involved scientific and government bodies to reflect the science-policy connect. Sample surveys were conducted at the block level to contextualize climate induced impacts on agriculture. To conduct the socio-economic vulnerability assessment, a detailed questionnaire was developed to obtain primary information. The questionnaire revolved around the social capital, economic status and natural ecosystems to understand the affect of climate change impacts on livelihood systems of the region. Focused group discussions were conducted with the farming community to understand the current vulnerabilities and information gaps.
Adaptation assessment was done through secondary research, which aided in enumerating the adaptation options. Primary consultations were conducted with the agriculture and water departments at the district level to understand the capacities, gaps and understanding of these officials on climate change. In addition, discussions were also held with Non-Governmental Organizations in the six districts to
validate the study by understanding their experiences on vulnerabilities in terms of exposure, sensitivity and adaptive capacity.
was also utilized to document the adaptation options through Civil Society Organizations efforts on ground. The Civil Society Organizations working in the region shared their experiences from different parts of Bundelkhand. This helped to analyze the existing adaptation options and the potential adaptation strategies which can be introduced in the region in future.
Bundelkhand Knowledge Platform
Bundelkhand Knowledge Platform used for extensive consultations to share the on ground experiences
District Damoh Sagar Chattarpur Tikamgarh Datia Panna 0.242242 0.104078 -0.03927 -0.09543 -0.22251 -0.26794 Vulnerability Index
Figure 3: Vulnerability indices of the six Bundelkhand districts
3.1. Vulnerability Assessment of
Bundelkhand
The vulnerability assessment done using secondary data, using the LVI approach, brings out the following
3.2. Analysis of Climate Change
Vulnerabilities in the Region
Exposure
It is the magnitude and duration of the climate-related exposure such as a drought temperature variability or change in precipitation . Climate data from 1980 to20
20 Ebi K.L., Mills D.M., Smith J.B., Grambsch A., 2006. Climate change and human health impacts in the United States: an update on the results of the U.S. National Assessment. Environmental Health Perspectives 114: 1318-1324.
vulnerability ranking for the six districts under study. Vulnerability Profile ranges from -1 to +1 depicting low to high vulnerability. It is clear from the calculated LVI that Damoh is the most vulnerable district. (District-wise LVI is indicated in the table below.)
2005 period has indicated an increase in the mean maximum temperature in Bundelkhand region by 0.28 C as compared to the baseline period of 1960-1990. Analysis of the simulated data generated by PRECIS Regional Climatic Model predicts that the temperature throughout the year is likely to be higher, in the range of 2 to 3.5º C by mid century . The major precipitation season is expected to shift by one month
o
21
21 IITM, Pune, India, Second National Communication to The United Nations Framework Convention on Climate Change, MoEF, Government of India, 2002.
(from July to August). The shift in monsoon causes delay in sowing, which in turn delays harvesting and culminates in reduction of the potential yields in drier conditions. The climate science data developed by Indian Institute of Tropical Meteorology, IITM has revealed the climatic change exposure of Bundelkhand region by the end of the century . The data was developed using the PRECIS model run over three time slices (2020s, 2050s and 2080s) using 1970s as the baseline period. A 50 × 50 km resolution was used to develop the results for 5 QUMP (Quantifying Uncertainties in Model Predictions) simulations for A1B scenario. A1B describes a future world of very
22
rapid economic growth with global population that peaks mid-century and declines thereafter.
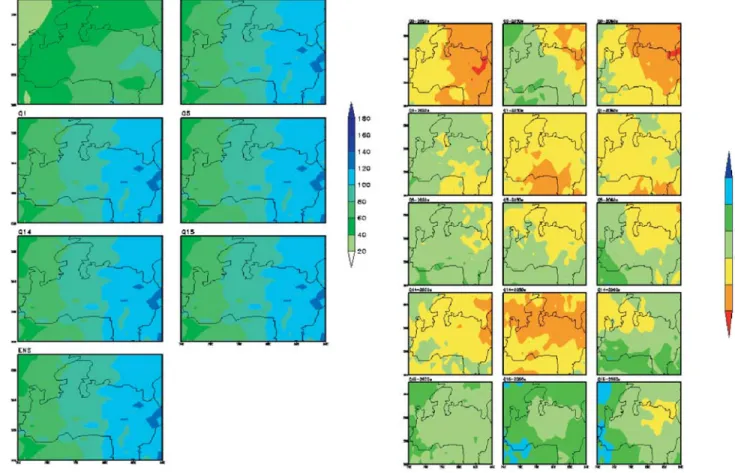
The study focussed on two major indicators of climate change - rainfall and temperature in the region. The results from the model predicted variability in climate by the end of the century. The annual average surface temperatures are projected to rise by 1-2 C, shooting up to 3 C and even up to 5 C towards 2020s, 2050s and 2080s respectively, especially in the northern part of Bundelkhand. Projected rise in the minimum temperature is more as compared to the rise in maximum temperature.
o
o o
Figure 4: Time series of monsoon rainfall 1951-2007 for Bundelkhand region of M.P (IITM Pune)
22 The climatic projections were shared by the IITM in the National workshop on “Climate Resilient Development for semi arid region A case of Bundelkhand region” organized by Development Alternatives and Swiss Agency for Development and Cooperation (SDC)
In near future, there may not be much change in the seasonal monsoon rainfall; however, it may increase by 5-10% percent towards 2050s and up to 20% towards
2080s with respect to the baseline. July rainfall is likely to decrease, but other months reveal an increase in the rainfall by the end of the century. The number of cyclonic disturbances may decrease in future but the systems may be more intense with increase in the associated rainfall by 10-15 mm. The number of rainy days may decrease, but they may be more intense in the future.
Figure 5: Change ( C) in Annual average Surface Temperature towards 2020s, 2050s and 2080s (IITM, Pune)
o
Figure 6: Monthly rainfall change (%) in QUMP simulations towards 2020s, 2050s and 2080s in individual monsoon months
and season as a whole (IITM, Pune)
Figure 8: Simulated number of rainy days and projected changes through 2020s, 2050s and 2080s (Source: IITM, Pune)
High Sesitivity and Low Adaptive Capacity
Social Vulnerabilities
Sensitivity is defined as the degree to which the system is affected by the exposure, and its adaptive capacity is the system's ability to withstand or recover from the exposure . The parched geography of Bundelkhand is one of the most underdeveloped regions of the country, with poor human development indices. In addition to undulating terrain and climatic variability, the drought-prone region suffers from high socio-economic vulnerabilities marked by increased climatic sensitivities and low adaptive capacities.
The Bundelkhand region is among the most backward regions in the country. Out of the six districts of the Madhya Pradesh part of Bundelkhand, districts like
23
23 Ebi K.L., Mills D.M., Smith J.B., Grambsch A., 2006. Climate change and human health impacts in the United States: an update on the results of the U.S. National Assessment. Environmental Health Perspectives 114: 1318-1324.
Chhatarpur, Panna, Tikamgarh and Damoh currently receive funds from the Backward Regions Grant Fund Programme (BRGF) under the aegis of Ministry of Panchayati Raj. Incidence of poverty in the state is among the highest in the country, with people living below the poverty line increasing from 44.6% in 1993-94 to 48.6% in 2004-05. This is more so in rural than urban areas (53.6% in rural areas as against 35.1% in urban areas during 2004-05).
100 90 80 70 60 50 40 30 20 10 0 India Madhya Pradesh Chattarpur
Datia SagarDamoh Panna Tikamgarh
% Rural Population % Rural Population
Figure 9: Comparision of percentage of rural population in India, Madhya Pradesh and Bundelkhand region (Source: Census, 2011)
Widespread poverty, unbiased socio-economic conditions and high levels of illetracy increases the
vulnerablities of the communities
There is widespread poverty in the region, with majority of the populace dependent on agriculture as their core source of livelihood. There is an evident social hierarchy existing in the region. Even though there are primary schools in most of the villages, the quality of education is poor with less teachers and irresponsible attitude of teachers towards teaching in some parts of the region. Girls drop out of school past the primary level as the higher level schools are situated far from the village.
There is a general lack of awareness among the community due to illiteracy and lack of support services which could have enabled them through information. The status of women is further low in the region due to cultural and social barriers and low development indices. Water for drinking and other household purposes purposes is fetched from far off sources by the females of the households, adding to their normal work load.
Figure 10: Male Female Literacy Gap Rate (Source: Census, 2011)
The farmers in the block are small scale with an average land holding size of two hectares. In addition the productivity is low and is dependent on weather conditions. Also, only a very small number of farmers were able to get access to national crop insurance schemes of the government. As wheat was perceived to require a larger quantity of water the farmers have switched to growing lentils and sesame as an autonomous adaptation/coping strategy. Farmers have also diversified their livelihood options and have started small scale enterprises such as selling vegetables in the adjoining urban centres. Most of the farmers are under debt for fulfillment of basic needs. Informal institutions such as money lenders and relatives contribute to about half of the debt.
Figure 11: Comparision of Sex Ratio in India, Madhya Pradesh and Bundelkhand
(Source: Census, 2011) Sex Ratio Sex Ratio 840 860 880 900 920 940 960 0 5 10 15 20 25 30 Male Female Literacy Gap Rate (%) Datia Sagar Damoh Panna
Male Female Literacy Gap Rate (%)
Chattarpur
Scarcity and other socio-economic conditions increases the burden on women in the region
Ecological Vulnerabilities Natural Resources
The 13 districts of Bundelkhand region consists of 7.08 million hectares of ravenous and undulating terrain, making the region prone to high run-off and increase in loss of soil fertility . Above an impervious layer of rock that is found at depths of 6 to 15 metres, several kinds and grades of soil are found across Bundelkhand. Broadly, the soil falls into two categories: red soil and black soil.
loss of soil fertility . Above an impervious layer of rock that is found at depths of 6 to 15 metres, several kinds and grades of soil are found across Bundelkhand. Broadly, the soil falls into two categories: red soil and black soil.
Across Bundelkhand, soils of both categories have poor organic content. Bundelkhand region is rocky and has a high percentage of barren and uncultivable land. According to the Wasteland Atlas of India (2005), Department of Land Resources, Ministry of Rural Development (GoI), a total of roughly over 11,000 sq km, or over a sixth of the area of Bundelkhand (M.P and U.P) falls under four broad categories of wasteland. Wastelands found in Bundelkhand can be grouped as: land affected by shallow, medium or deep gullies; wastelands with or without scrub in lowlands or uplands; degraded notified forest lands and barren, rocky and totally uncultivable land. Over half the total wasteland of the region is with or without scrub, half of
24
24
which falls in the Chhatarpur district. Around a quarter of the total wasteland is degraded notified forest land, found mostly in Bundelkhand upland (Chhatarpur, Tikamgarh, and Panna) and Sagar and Damoh plateaus.
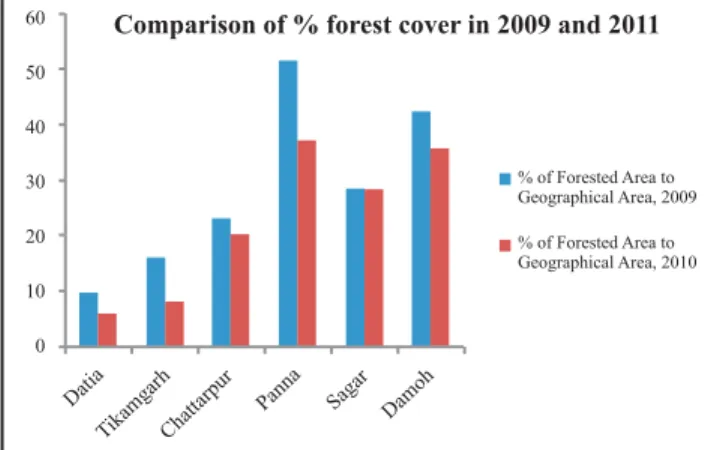
About 22.53% of the Bundelkhand region consists of forest cover and scrubs. Additionally, population growth, increase in cultivable land, increased extraction of fuel wood, anthropogenic pressures and climatic changes have, all-in-all, affected the quality of forests in the region. osses in the agricultural produce due to variable climate have also increased people's dependence on forests for other livelihood options. Deforestation has also become rampant, which has lead to a slow environmental degradation of the district . Over the decades, the forested area has shrunken. Due to the declining forest cover, the land is becoming barren because of the increasing rate of erosion. This has also lowered the water holding capacity of the soil. Panna was the only district in the entire country which had a forest area of over 50% with respect to its geographical area. However, the forest resources in this biodiversity-rich region are now under threat.
L
s
leaf and other NTFPs are being taken from the forest. Particularly fruit, which is used for alcohol production is a major source of livelihood for the local community. -making also provides a sustainable livelihood to a large number of poor families in the region. Mainly, fuel wood is sourced from nearby forests.
mahua,
tendu , chironji
mahua Bidi
Forests
24 Report on Drought Mitigation Strategy for Bundelkhand Region of Uttar Pradesh and Madhya Pradesh, Inter Ministerial Central Team, Government of India, 2008
Rocky, barren, semi arid and undulating topography of Bundelkhand
A women sorting tendu leaves derived from forests for bidi making
Figure 12: Comparison of % forest cover in 2009 and 2011 (Source: District Statistical Handbooks, 2009 and India State of
Forest Report, 2011)
Sensitivities in Bundelkhand are majorly aggravated by water stress in the region. This is chiefly due to inadequate and erratic rainfall, high run-off rates and poor water retention capacity of the soil. Loss of traditional water management practices and insufficient water harvesting structures have further added to the cause. Most part of the Bundelkhand
region is covered with an impermeable rocky layer which is found at quite shallow depths. These factors cause low groundwater recharge, making groundwater availability a major issue of concern. Water availability from aquifers is inadequate and non-dependable. The groundwater recharge is a slow process due to physiographic conditions, low porosity of the strata and occurrence of clay layers .25
Water
The average annual rainfall of Bundelkhand region of Madhya Pradesh is 990.9 mm, with a range of 767.8 to 1086.7 mm. The region witnessed continuous meteorological, hydrological and agricultural drought for six years in the period 2003-2009. According to the Inter-ministerial Report on Drought Mitigation Strategy for Bundelkhand Region (2008), the semi-arid region of Bundelkhand experienced meteorological drought in the years 2004-05 and 2005- 06 in the districts of Tikamgarh and Datia. In 2006-07, the region experienced an overall 37% shortfall in five out of six districts receiving deficit rainfall ranging from 27% to 47%. The overall shortfall in precipitation went up to 46% during 2007-08, with all the six districts having more than the threshold deficit of 20% for declaring a meteorological drought.
Increasing temperatures have also led to high evapo-transpiration rates which, when greater than the received precipitation, lead to loss of soil moisture and reduction in groundwater recharge and surface water levels. Vulnerability assessment of the region also reveals that the region is also facing the brunt of depleting groundwater resources. In the six districts of Bundelkhand region of MP, the actual filling of 19 reservoirs (storage capacity- 950 MCM) progressively reduced from 52% in 2004 to 10% in 2007. Drying up of 70% of tanks, ponds and dug-wells and fall in the groundwater table in the region clearly indicated hydrological drought situation.
About 44.7% of net sown area (NSA) is irrigated by canals, dug wells, shallow tube wells, lift irrigation and other flows. Major portion of this, i.e. 31.7% of NSA is irrigated by ground water . Irrigation heavily relies on26
25 http://moef.nic.in/downloads/public-information/MP-SAPCC.pdf
26 Report on Drought Mitigation Strategy for Bundelkhand Region of Uttar Pradesh and Madhya Pradesh, Inter Ministerial Central Team, Government of India, 2008
0 10 20 30 40 50 60 % of Forested Area to Geographical Area, 2009 % of Forested Area to Geographical Area, 2010
Comparison of % forest cover in 2009 and 2011
Water scarcity in the region forces the communities to obtain water from handpumps located at far off distances
the availability of water through rainfalls, which further increases the sensitivities to climate change. A large portion of irrigation depends on extraction of groundwater through diesel based pump set, which is heavy on the pockets of small and marginal farmers. With groundwater levels falling and lakes and ponds drying up, the overall water availability for irrigation has drastically reduced.
Furthermore, the area is witnessing inefficient water management practices such as inadequate rain water harvesting, flood irrigation and insufficient groundwater recharging structures. The recharging of groundwater resources through collecting the rainwater in traditional ponds is not taking place due to degradation of such ponds, encroachment of forest lands, cutting of forests and blocking of the catchment areas of watershed regions. The result is that wells being used for drinking water and irrigation are not providing enough water to serve the purpose for whole year .
In the semi arid geography like that of Bundelkhand, livestock-rearing is a common livelihood option practiced by the communities. People have moved beyond cattle and are taking up poultry and goat-rearing as options. But, the growing unavailability of grazing pastures has added to the woes in livestock rearing.
27
Livestock
About 50% of the indigenous cattle population is unproductive. Hardly 0.5% of cattle population is
cross-bred as compared to 15% of the national average. Except a few communities, such as the clan which chiefly depend on cattle, others have shown a declining trend in continuing with this livelihood option due to lack of resources to keep the animals healthy. Lack of fodder availability and water has reduced the interest of local communities in livestock-rearing, which has further lowered their adaptive capacities.
In the predominantly agrarian economy of Bundelkhand, over 80% of the population is dependent on agriculture, livestock rearing, collecting forest produce and outsourcing income by seasonal migration after the Rabi sowing season. Agriculture in the region is chiefly rain-fed, risky and vulnerable. Major crops
grown in the region are ,
and during and
and during .
Agricultural production consists of more than 56% of cereals, 32% of pulses, 8% of oil seeds and 4% other crops. Out of the total number of land holdings, 68% belong to small and marginal farmers who have less than two hectares of land. Majority of these farmers are highly dependent on monsoon rains and modern agricultural practices for efficient water use have not been adopted . The Bundelkhand region faced its worst ever drought from 2004 to 2009, with a rain deficit of about 66%. According to the report of an
inter-28
29
Yadav
soyabean, arhar, groundnut
sugarcane kharif wheat, mustard,
masur, urad mung rabi
Figure 13: Livestock population per geographical area, 2007 livestock census
Agricultural Sector Vulnerabilities
27 http://planningcommission.nic.in/reports/sereport/ser/ bndel/stdy_bndel.pdf
28 Report on Drought Mitigation Strategy for Bundelkhand Region of Uttar Pradesh and Madhya Pradesh, Inter Ministerial Central Team, Government of India, 2008 29 DA-Swiss report on “Resource Vulnerability of Semi-Arid
Bundelkhand and Recommendations for Policy Response - a brief analysis, 2012”
Increasing demand for resources has affected the livestock rearing practice in the region
Livestock population per Geographical Area (Ha)
0 500 1000 1500 2000 2500 3000
Datia Tikamgarh Chattarpur Panna Sagar Damoh
Livestock Population per Geographical Area (Ha)
ministerial central team, headed by Dr. J. S. Samra of National Rainfed Areas Authority (2008), the region could not cultivate even 40% of the farms, leading to about 30% reduction in food grain production. More than two million livestock were abandoned. Around 40% of the region's population had migrated out in search of work. These incidences of drought and high vulnerabilities indicate the negative impacts of climate uncertainties on food security of Bundelkhand.
Consultations with farmers revealed that unavailability of seeds, fertilizers and pesticides further cripples their situation. They are facing crisis due to increased agricultural inputs as compared to agricultural outputs and benefits. Over the years, dependence on chemical fertilizers has also increased manifold, which is gradually decreasing soil fertility and also adding to the monetary input requirements for the farm.
During the past 25 years, factors such as promotion of cash crops, changing agro-cycle, forest degradation, over- exploitation of groundwater and damage to traditional water bodies have led to drying up of natural land moisture. Water is being pumped out from the ground using tube wells which has led to drying up of natural water sources in many areas of the region. Now, the water level for tube-wells has gone down to around 600-750 feet in some part of the region. Lack of forests and grass in the region, causes the water to flow with high velocity on the Bundelkhand land that it is slowly turning into a ravine. There is a downfall in the number of rainy days in the entire region and the state as well. In the year 1999, there used to be 52 rainy days during the year, but it has gone down to the level of 35 in a year . The scarcity of water, along with the poor soil quality, adds to the vulnerability in the region. Productivity is
30
affected by the poor water retention ability of the soil, weather fluctuations and large tracts of wasteland .
Since the crops are mainly rain-fed, monsoons are crucial for sowing and subsequent growth of the crops. It has been experienced that the onset of monsoons has shifted from the end of June to end of July August. This has caused a delay in the sowing time of seeds, which affects the growth and harvest of the crop due to different temperature conditions which the crop has to tolerate. Also, due to sudden downpours, the crops also face water-logging conditions which decay their growth. Recently, during 2012, the farmers considering the delayed monsoons and low rainfall sowed (sesame) seeds, but the delayed heavy rains damaged the standing crop to such an extent that the crop started to decay.
Another issue causing the low yield rate is the non-replacement of seeds. Timely seed non-replacement is not taking place at the required rate. Foundation seeds work for a maximum period of three years, providing a high yield during this span, after which the produce declines. The farmers are either not aware of this or not ready to change because they have been cheated time and again by the seed companies. On several instances poor farmers were sold grains instead of seeds, as a results farmers incurred heavy losses. Actually, most farmers depend totally on the government, without making much effort on their own.
The average land holding of the region is less than two hectares, meaning that it is mainly the small and marginal farmers who will be impacted with the future implications of climate change. The landless farmers
( ) work in two ways, either they
take land from some other farmer to practice agriculture or they work as labour in their farms to till their land and take a meagre share as their income. Around 80 % of the small scale farmers work as agriculture labour.
These farmers depend on agriculture for their own subsistence and seldom have a produce to sell in the market. Their decisions on the agricultural inputs are influenced by the process followed either by large farmers in the village or the market trend. They are deprived of correct information on time, thus forbidding the scope of improvisation in farming practices. Crops are also affected by unavailability of water on time. Fluctuating and discontinuous electricity supply has forced the farmers to invest hugely on diesel pump sets to draw water from nearby canals.
31
Kharif til
Bhumiheen Majdoor High sensitivity of the farmers due to increasing
vulnerability of the agriculture sector in the region
30 IITM, Pune
31 http://bundelkhandinfo.org/economy/employment/ employment_sources.html
Not just natural climatic conditions affect farmer's vulnerabilities, government's incapacity to disseminate seeds on time and the market trend which fetches the farmers lower returns on produce add to their pathetic conditions.
An increasing trend of distress migration is observed in the region. Due to degrading environment and poor economic conditions, local people are migrating out to other regions in search of better income and opportunities for sustenance. The drought period of 2003-2009 witnessed a migration of 40% of region's population . Typically, migration is sought as an adaptive response once the other sources have been tested for support and proved incapable. Rising input costs and frequent incidence of drought are pushing agricultural labourers and small farmers out of agriculture. Mining of minerals and stone-quarrying has emerged as a major non-agricultural activity. Women also accompany men as they migrate to the cities to work as unskilled labours. Migration has increased to around 70-80% (especially the bread winners), with farmers migrating to cities in search of job opportunities. The migrating population ranges from seasonal to permanent. This leads to migration of large rural population to towns and cities. This has also affected the agriculture practices in villages. The region is also starved with timely information and technological interventions which further cripples their situation.
It was found that though the villages had been electrified, but for the past few years' electricity supply has been disconnected in some villages due to
non-32
payment of electricity bills. The villagers did not find it feasible to pay rental charges for a connection wherein the supply of electricity was not reliable. For this reason the communities in such villages are not able to pump ground water for irrigation purposes.
Chhatarpur district is located in central portion on the plateau of Bundelkhand in M.P. The district is spread over an area of 8616.82 km and is located at the northern boundary of the state. It is bounded by Mohaba district in U.P in the north and Panna district in the east, Tikamgarh district in the west and Sagar & Damoh districts in the south. Chattarpur district is divided into six blocks (Gourihar, Londi, Nowgaon, Chhatarpur, Rajnagar, and Bijawar) and eight development blocks (Gourihar, Loundi, Nowgaon, Chhatarpur, Rajnagar, Bijawar, Badamalhera & Buxwaha) .
The district witnesses a hot summer and general dryness except during the South- west monsoon season. Weather-wise, the entire year can be divided into four seasons. The cold season ranges from December to February, followed by the hot season from March to middle of June. The period from middle of June to September in the South-west is the monsoon season. October and November form the post-monsoon or transition period. The nearest IMD observatory is in Nowgaon.
2
33
Climate Profile:
3.3. District Vulnerability Profiles
3.3.1. Chhatarpur District
Blocks
Avg Year Wise
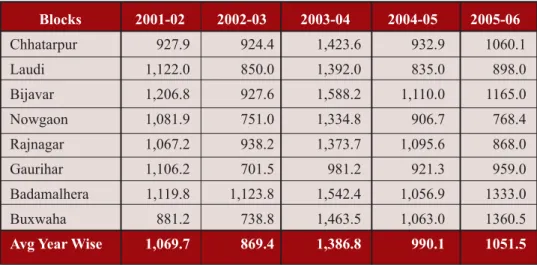
Chhatarpur Laudi Bijavar Nowgaon Rajnagar Gaurihar Badamalhera Buxwaha 2005-06 1051.5 1060.1 898.0 1165.0 768.4 868.0 959.0 1333.0 1360.5 2004-05 990.1 932.9 835.0 1,110.0 906.7 1,095.6 921.3 1,056.9 1,063.0 2003-04 1,386.8 1,423.6 1,392.0 1,588.2 1,334.8 1,373.7 981.2 1,542.4 1,463.5 2002-03 869.4 924.4 850.0 927.6 751.0 938.2 701.5 1,123.8 738.8 2001-02 1,069.7 927.9 1,122.0 1,206.8 1,081.9 1,067.2 1,106.2 1,119.8 881.2
Table 3: Average Annual Rainfall from 2001-06 in Chhatarpur District (in mm.)
32 Report on Drought Mitigation Strategy for Bundelkhand Region of Uttar Pradesh and Madhya Pradesh, Inter Ministerial Central Team, Government of India, 2008
The normal annual rainfall of Chhatarpur district is 1068.3 mm. The district receives maximum rainfall during South-west monsoon period i.e. June to September. About 90.2% of the annual rainfall is received during monsoon season. Only 9.8% of the annual rainfall takes place between October to May period. The normal maximum temperature during the month of May is 42.3 C and the minimum ( during the month of January) is 7.1 C. The normal annual mean maximum & minimum temperatures of Chhatarpur district are 32.7 C and 18.1 C respectively. During the South-west monsoon season, relative humidity generally exceeds 88% (during August), whereas the rest of the year is drier. The driest part of the year is the summer season, when relative humidity is less than 30%, in fact, May is the driest month of the year.
The population of Chhatarpur district
0 0
0 0
Demographics:
as per the 2011 Census is 17,62,857 (9,35,906 males and 8,26,951 females) with the population density around 203 per km . A total of 77.35% of the population resides in rural areas which implies that the majority population is dependent on agriculture sector. The sex ratio is 884 females per thousand males, which is quite less than the state ratio of 930 and the national figure of 940 respectively. The decadal population growth of the district is 19.5%, which is higher than the state and national averages of 20.3% and 17.64% respectively. The increasing rate of population and subsequent decline in the resource base adds to the susceptibility of the people to be affected by any untoward incident. In 2006, the Ministry of Panchayati Raj named Chhatarpur as one of the country's 250 most
It is one of the 24 districts in Madhya Pradesh currently receiving funds from the
2
backward districts.
Backward Regions Grant Fund Programme (BRGF).