HAL Id: hal-01675303
https://hal.sorbonne-universite.fr/hal-01675303
Submitted on 4 Jan 2018HAL is a multi-disciplinary open access archive for the deposit and dissemination of sci-entific research documents, whether they are pub-lished or not. The documents may come from teaching and research institutions in France or
L’archive ouverte pluridisciplinaire HAL, est destinée au dépôt et à la diffusion de documents scientifiques de niveau recherche, publiés ou non, émanant des établissements d’enseignement et de recherche français ou étrangers, des laboratoires
Transcranial ultrasonic stimulation modulates
single-neuron discharge in macaques performing an
antisaccade task
Nicolas Wattiez, Charlotte Constans, Thomas Deffieux, Pierre Daye,
Jean-François Aubry, Pierre Pouget
To cite this version:
Nicolas Wattiez, Charlotte Constans, Thomas Deffieux, Pierre Daye, Jean-François Aubry, et al.. Transcranial ultrasonic stimulation modulates single-neuron discharge in macaques performing an antisaccade task. Brain Stimulation, Elsevier, 2017, 10 (6), pp.1024-1031. �10.1016/j.brs.2017.07.007�. �hal-01675303�
Transcranial ultrasonic stimulation modulates single-neuron
1discharge in macaques performing an antisaccade task
2
3
Nicolas Wattiez1, Charlotte Constans2, Thomas Deffieux2, Pierre M. Daye1, Mickael
4
Tanter2, Jean-François Aubry2§ and Pierre Pouget1§.
5
1Institut du Cerveau et de la Moelle épinière, UMRS 975 INSERM, CNRS 7225, UMPC, Paris, France
6
2Institut Langevin Ondes et Images, ESPCI ParisTech, CNRS 7587, UMRS 979 INSERM, Paris, France
7 8 9
§ Both authors are co-responding authors and contributed equally to the work: [email protected] and
10
11
ABSTRACT
13Background
14Low intensity transcranial ultrasonic stimulation (TUS) has been demonstrated to
non-15
invasively and transiently stimulate the nervous system. Although US neuromodulation
16
has appeared robust in rodent studies, the effects of US in large mammals and humans
17
have been modest at best. In addition, there is a lack of direct recordings from the
18
stimulated neurons in response to US. Our study investigates the magnitude of the US
19
effects on neuronal discharge in awake behaving monkeys and thus fills the void on both
20
fronts.
21
Objective/Hypothesis
22In this study, we demonstrate the feasibility of recording action potentials in the
23
supplementary eye field (SEF) as TUS is applied simultaneously to the frontal eye field
24
(FEF) in macaques performing an antisaccade task.
25
Results
26We show that compared to a control stimulation in the visual cortex, SEF activity is
27
significantly modulated shortly after TUS onset. Among all cell types 40% of neurons
28
significantly changed their activity after TUS. Half of the neurons showed a transient
29
increase of activity induced by TUS.
30
Conclusion
31Our study demonstrates that the neuromodulatory effects of non-invasive focused
ultrasound can be assessed in real time in awake behaving monkeys by recording
33
discharge activity from a brain region reciprocally connected with the stimulated region.
34
The study opens the door for further parametric studies for fine-tuning the ultrasonic
35
parameters. The ultrasonic effect could indeed be quantified based on the direct
36
measurement of the intensity of the modulation induced on a single neuron in a freely
37
performing animal. The technique should be readily reproducible in other primate
38
laboratories studying brain function, both for exploratory and therapeutic purposes and
39
to facilitate the development of future clinical TUS devices.
INTRODUCTION
41
Focused ultrasound provides a new method to non-invasively stimulate the nervous
42
system using an external focused ultrasonic transducer to induce transient local
43
stimulation. Fry and colleagues demonstrated that US can suppress visually evoked
44
responses(1) in the primary visual cortex of anesthetized cats using focused ultrasound.
45
Gavrilov and collaborators elicited thermal, tactile, and pain sensations when they
46
applied focused ultrasound to the human and(2). The application of transcranial
47
ultrasonic stimulation (TUS) to the brain gained momentum in the new millenium, with
48
low frequency, low intensity ultrasound being applied the primary motor cortex in rodent,
49
generating motor responses without observing any adverse effect on the stimulated
50
tissue(3–6). Thermal effects are unlikely to play a role in the process when compared
51
with the mechanical effects such as radiation pressure and cavitation(7,8). However, the
52
exact mechanism for neural ultrasonic stimulation remains unknown(9,10). Several
53
models have been developed to explain the neuronal activation observed with acoustic
54
pressure: the Soliton model (11), the bilayer sonophore (BLS) model ( Intramembrane
55
cavitation as a unifying mechanism for ultrasound-induced bioeffects, (12) and the
56
neuronal intramembrane cavitation excitation (NICE) theory (13) combining the BLS
57
model and the Hodgkin-Huxley spiking model (which describes how action potentials are
58
initiated and propagate in neurons). No model has yet been evaluated using single
59
neuron recording during TUS in an alert animal performing a task. An improved
60
understanding of the physiological action of TUS would enable fine tuning of protocols
61
based on a known effect of the stimulation, which will improve the effectiveness of the
technique, and thus accelerate clinical transfer. Here we report the feasibility of
63
simultaneous recording of single neuron activity during TUS in an alert macaque
64
performing an oculomotor task. A focused ultrasound transducer was positioned using a
65
neuronavigation system (Rogue Research) to apply brief pulses of ultrasound in the
66
frontal eye field (FEF) while neurophysiological recordings were performed in the
67
supplementary eye field (SEF).
68
Two discrete areas in frontal cortex are involved in generating saccadic eye movements
69
in primates—the frontal eye field (FEF) and the supplementary eye field (SEF).
70
Anatomically the FEF is reciprocally and bilaterally connected with the SEF(14,15) and
71
these connections appear to vary the least between primate species, suggesting that the
72
most conserved functions of these regions may serve as a link for facilitating, planning of
73
eye movements(16). In both regions, eye movements can be evoked by direct electrical
74
microstimulation with relatively low current(17). Invasive intra-cortical recordings and/or
75
stimulation techniques have been widely used to better apprehend the role of these two
76
frontal areas, in combination with ocular motor measurements and mapping techniques,
77
such as electrophysiological and fMRI recordings in non-human primates. Those
78
approaches have provided causal evidence about the role of the FEF, with direct
79
bearing on ocular motor and attentional function(18,19). More recently, the causal
80
involvement of FEF in attentional orienting has been demonstrated(20,21) as well as its
81
ability to modulate different aspects of visual perception(22,23) while indirect control and
82
monitoring processes have been assigned to SEF functions(24,25). In order to examine
83
the possible distant role of neuromodulation caused by FUS applied to a cortical brain
84
region, we decided to target a cortical circuit controlling voluntary eye movement.
Our short-term goal was to demonstrate the feasibility of combining real time focused
86
ultrasound with single unit (SU) recordings in an alert macaque performing an
87
antisaccade task. The combined approach of TUS and single unit recording has the
88
potential to elucidate the mechanisms underlying the effects of focused ultrasound on
89
the central nervous system. TUS and single unit recording could also be combined with
90
3D functional ultrasound imaging of brain activity, as recently demonstrated in alert
91
animals in conjunction with EEG recordings(26,27). This will serve the causal
non-92
invasive exploration of cognition in non-human primate models.
93 94
MATERIALS AND METHODS
95
Focused ultrasound
96
A single element ultrasound transducer (H115, diameter 64 mm, Sonic Concept, Bothell,
97
WA, USA), geometrically focused to 64 mm, was used with a coupling cone (C103,
98
Sonic Concepts, Bothell, WA, USA) filled with degassed water.
99
The transducer has four frequency resonances: 200 kHz, 320 kHz, 850 kHz and 1380
100
kHz. We chose the same main parameters (frequency and burst length) as our previous
101
study(6) which had shown successful neuromodulation with the same transducer in
102
monkeys: the ultrasound wave frequency was set to 320kHz and 100ms bursts of
103
ultrasound were generated with a digital function generator, with rise and fall times set to
104
5ms at the beginning and the end of the pulse, respectively (Handyscope HS5, TiePie
105
engineering, Sneek, The Netherlands). A 75-Watt amplifier (75A250A, Amplifier
106
Research, Souderton, PA) was used to deliver the required power to the transducer and
107
the input voltage and current of the transducer were recorded using a voltage probe
(HP9250, TiePie engineering, Sneek, The Netherlands) and a current probe (P6021,
109
Tektronix, Beaverton, Oregon) connected to the HS5 card inputs.
110
The recorded peak to peak voltage (VPP) was 139±26 V for monkey Y and 56±15 V for
111
monkey L. The calibration of the transducer in water with a custom built heterodyne
112
interferometer (28) led to a linear relationship between VPP and peak negative pressure
113
(PNP) in water of 5.68 kPa/V. The peak pressure in the brain of the monkeys was
114
estimated by using 3D simulations of the ultrasonic field (see details below), taking into
115
account the experimental geometry (0.41±0.08 MPa for monkey Y and 0.24±0.07 MPa
116
for monkey L). For comparison, previous studies in human and non-human primates
117
estimated peak pressures of 0.35 MPa(6) and 0.43 MPa(7).
118
The ultrasound was directly applied to previously shaved skin. A coupling cone filled with
119
water ensured ultrasonic coupling between the transducer and the animal’s head. TUS
120
was performed once every 5 trials with an unpredictable minimum duration of 3 seconds
121
between trials. There was therefore a pause of at least 10 seconds between ultrasound
122
pulses.
123
The corresponding overall spatial peak pulse average intensity (ISPPA) was thus
124
estimated to be 5.6 ± 0.2 W/cm2 and 1.9 ± 0.2 W/cm2 for monkey Y and L respectively
125
(ISPPA=#$∗&!² with and c approximated to '()*+, and -()*+,). For comparison, the Food
126
and Drug Administration (FDA) ISPPA limit for ultrasound imaging safety guidelines is
127
190 W/cm2 for adult transcranial imaging [Food, U. and D. Administration, Information
128
for manufacturers seeking marketing clearance of diagnostic ultrasound systems and
129
transducers. Rockville, MD: Center for Devices and Radiological Health, US Food and
Drug Administration, 1997]. We emphasize here that we do not claim to be below FDA
131
requirements as long pulses (100ms, or 32000 periods) are used here, as compared to
132
short pulses for imaging (one period for Bmode imaging, corresponding to 3µs at the
133
frequency used here).
134 135
Experimental setup
136
The antisaccade paradigms and data acquisition were under the control of a computer
137
running a Rexeno real-time data acquisition system(6).
138 139
Behavioral Task
140
Two captive-born macaques (Maccaca mulatta, “Y”, and “L”, one male and one female
141
11 and 8 years old and 17 and 7 kg respectively) participated in this study. The monkeys
142
were paired-housed and handled in strict accordance with the recommendations of the
143
Weatherall Report on good animal practice. Our experiments were approved by the
144
Animal Health and Veterinary Medication Division of the Department of Public Veterinary
145
Health, Nutrition and Food Safety of the French Ministry of Health (current renewal N°
146
DTPP 2010-424). Monkeys had access to toys, mirrors and swings and also had visual,
147
auditory and olfactory contact with other animals, and, when appropriate, could touch
148
and groom each other. An institutional veterinary doctor constantly monitored their
well-149
being and health conditions. Prior to participating in the study, both animals were
150
periodically chaired, head-posted and trained to perform a series of tasks for a period of
151
6-12 months, until they became regular and proficient performers.
Prior to the first experimental session, animals were specifically trained in an
153
antisaccade (AS) task. Between 500-1000 milliseconds after initial fixation onset on a
154
brown central fixation stimulus and simultaneously to its disappearance (no gap), a red
155
square appeared for 1000ms at a 16° of visual angle to a rightward or leftward location
156
(direction randomly selected). Monkeys were trained not to look at this peripheral target
157
but instead, initiate as soon as possible a saccade in the opposite direction. After the
158
saccade, the monkey received a reward if the saccade fell within a 10° x 10° window
159
centered at the mirror location of the visual target. Failure to trigger a saccade within
160
1000ms of target onset cancelled the trial. The AS task was chosen since prior human
161
and monkey TUS experiments have revealed prosaccade paradigms to be much less
162
sensitive to single pulse TUS interference than antisaccades(6). Trials were aligned on
163
the appearance of the peripheral target.
164 165
Data Analysis
166
Eye movements were recorded with an infrared video eyetracker (Eyelink 1k,
SR-167
Research, Ontario, Canada). Eye position was digitized and sampled at 1 kHz and
168
stored for off-line analysis. All the analyses were performed on a personal computer with
169
custom software written in the Python programming language. Eye position signals were
170
low-pass filtered using a third order Savitzky–Golay filter (window: 41ms). Eye velocity
171
and eye acceleration were extracted from the Savitzky-Golay filter. Saccades were
172
detected with a 30°/s velocity threshold.
173
For each cortical site tested with TUS, we used an online windows discriminator to
174
isolate one neuron at a time for each recording. Offline cluster cutting (PCA) techniques
were used systematically to confirm that action potential waveforms were produced by
176
individual neuronal elements.
177
Spikes were sorted on-line using a box sorting method as a pair of time-level windows
178
(Rasputin, Plexon Inc.). Offline examination of the sorting quality was systematically
179
realized using a semi-automatic PCA calculation without restriction to a certain number
180
of waveforms (Offline-Sorter Plexon Inc). Following the extraction of the spike time, we
181
evaluated the average firing rate of each neuron (and the confidence interval of the
182
average) using bootstrapping techniques on the computation of the spike density
183
function (27). The principle of bootstrap is to randomly select trials without replacement
184
from the larger dataset (here control trials) and with replacement in the smaller dataset
185
(TUS trials). This random selection is made N times where N = 50 * sample size of the
186
smaller dataset as described by Daye and colleagues(29). The effect of FUS between
187
functional cell types was compared using the chi-squared test.
188 189
Surgical procedure
190
The surgical procedures for the titanium head-post implant were as previously
191
described(6). Each animal was deeply anaesthetized using ketamine hydrochloride (5
192
mg/kg i.m.) for initial sedation before induction with 2-4% isoflurane gas, which was then
193
maintained during surgery. Pain medication was given prior to surgery and routinely
194
given after surgery. Implanted head posts (7.1 mm internal diameter) (Part 6-FHP-X2F,
195
Crist Instrument, Hagerstown, MD, USA) were designed to mate with a head-post holder
196
(Part 6-FHB-S2B, Crist Instrument, Hagerstown, MD, USA). SEF Recording chambers
197
were placed according to stereotactic coordinates (AP: 26; ML: 0) and MRI scans. The
craniotomies were performed under deep anesthesia with ketamine hydrochloride (5
199
mg/kg i.m.) for initial sedation, and induction and maintenance with 2-4% isoflurane gas.
200
Pain medication was given prior the surgery and routinely given after surgery.
201 202
Neurophysiological data acquisition and analysis
203
For single unit recordings, multiple tungsten microelectrodes (FHC, 8-10 MΩ) were
204
introduced through guide tubes and independently positioned with a custom-made
205
stepper-motor micro-drive. The recordings were made on a MAP system (Plexon Inc.,
206
TX, USA), storing spike times with 25μs resolution. Online discrimination based on wave
207
shape parameters was used to select a single neuron on each independent recording
208
electrode channel. Respectively 39 and 46 neurons were recorded in monkey Y and L.
209
All isolated neurons recorded were kept for the analysis. All sets of recordings consisted
210
in more than 386 and 400 valid trials for monkey Y and L respectively.
211 212
FEF Targeting with TUS
213
Targeting of the FEF with the TUS transducer was performed using a neuro-navigator
214
tool (Brainsight, Rogue Research, Montreal, Canada). An MRI dataset (structural T1)
215
was acquired for each monkey with an attached MR fiducial marker array. The FEF
216
target was manually registered once and used for all sessions. Prior to each session, the
217
position of the fiducial marker array was manually registered to a position sensor serving
218
as a reference and fixed to the chair. In a second step, the focal spot of the TUS
219
transducer, materialized using a 3D printed piece, was registered using a tracked pointer
220
to a second position sensor, which was fixed behind the transducer. Before each
session, the transducer, supported by a mechanical arm (Rogue Research, Montreal,
222
Canada) was then manually moved until the focal spot was aligned and positioned over
223
the predetermined FEF target. The arm was then locked for the rest of the session.
224 225
Numerical simulations
226
Acoustic density and velocity maps were reconstructed from CT scans of both monkeys’
227
heads (Philips Brilliance 64 CT Scanner , Voltage: 120kV, Intensity: 350mA ; FilterType:
228
'D'). The brain, skin and muscle tissue was considered as a homogeneous medium and
229
skull was modeled as a heterogeneous model by using the following conversion from
230
Hounsfield units (HU) to density and velocity of the skull1:
231
' = '*/001++ 34 − 34*/001+
346)7+ 34*/001+('6)7− '*/001+)
232
HUmax was determined from each map as the maximal value in the skull and HUtissue as
233
the mean value of HU in the brain, muscle and skin.
234
The power law model for attenuation is abs = α ∗ Ф? where the porosity Ф is defined by
235
Ф = $@ABC$
$@ABC$DAEFG in the skull (Aubry et al. 2003 Experimental demonstration of noninvasive
236
transskull adaptive focusing based on prior computed tomography scans). α and I were
237
experimentally determined by transmission measures and simulations to a monkey skull
238
flap : the best match was found with I = 0.5 and α = 8.0 NO/-Q/R3ST.T, leading to α =
239
2.3 db/cm at 320 kHz.
240
The acoustic parameters are summarized in table 2. CT images were acquired with the
241
smallest field of view to obtain the best possible resolution in the transverse plane: 0.358
242
mm and 0.136 mm for monkey Y and L respectively. The acoustic density and velocity
243
3D maps were then subsampled to respectively 0.358 and 0.407 mm isotropic resolution
for monkey Y and monkey L, which gave a ratio of 13.6 and 12.0 pixels per wavelength
245
in tissue at 320 kHz.
246
The pseudo-spectral method-based software k-Wave2 was used to perform the linear
247
acoustic simulation through the water cone, skull and brain with the same geometry
248
used in vivo with the neuro-navigator positioning. The head was modelled as immersed
249
in water, given that, in that setup, tissue/air interfaces are unlikely to play a significant
250
role compared to skull/tissue interfaces. Not considering the air medium, whose
251
impedance is much lower than water, significantly reduced the computation time.
252
To limit the computation time, the total simulation duration was limited to 150 µs, which
253
was sufficient to reach a steady-state. For each simulation, the pressure field was stored
254
in three dimensions and in a full volume including the FEF for all time steps. Time
255
profiles of the acoustic pressure were extracted at the geometric focus and at the point
256
of maximal pressure amplitude over time. Maps of the in-situ time peak pressure at
257
steady-state were also estimated by taking the time peak of the pressure field at each
258
pixel in 3 planes (orthogonal to, or including the transducer direction), centered on the
259
geometric focus. As the muscular tissue surrounding monkey Y’s skull was much thicker
260
than monkey L’s (respectively about 16mm and 5mm), a 1 cm transducer’s pressed into
261
the tissue was taken into account in the simulation. This value was set based on the
262
actual in vivo positioning of the transducer, based on the neuro-navigator guidance for
263
FEF targeting. The calibration of the transducer in water showed a linear relationship
264
between peak to peak voltage (VPP) and peak negative pressure (PNP) in water of 5.68
265
kPa/V. Simulations were first performed in water without the skull, in order to normalize
the simulations based on actual pressure measurements in water. Table 1 summarizes
267
the results of the simulations.
268 269
RESULTS
270 271
The goal of our study is to show that TUS and single unit recordings can be combined to
272
probe the interactions between two reciprocally-connected distal bilateral areas. First,
273
we present how TUS applied to FEF affects the neural activity of a SEF neuron. Then
274
we extend these analyses to the whole neuronal population that has been recorded to
275
investigate the overall effect of TUS on a distal connected area.
276 277
Simulation of ultrasonic pressure field in the brain
278
The voltage applied to the ultrasonic transducer was respectively equal to 139±26 V and
279
56±15 V for monkey Y and L. As shown in figure 2, female monkey L had a smaller head
280
than male monkey Y. 3D numerical simulations of the ultrasound propagation were
281
conducted in order to investigate the ultrasound field in the two different monkey brains
282
while taking into account head geometry, and the reflection, refraction and absorption
283
associated with the full skull cavity and head geometry, (table 1). A linear simulation
284
model was used (see supplementary materials) in which the acoustic pressure was
285
proportional to the applied voltage (VPP). In water, the peak pressure was found to be
286
2.5 times higher with monkey Y’s settings than monkey L’s. Nevertheless, the peak
287
pressure in the FEF is only 1.7 times higher for monkey Y. This is most probably due to
anatomical differences such as skull thickness, skull density, skull geometry and frontal
289
muscular tissue thickness (table 1 and figure 1). Owing to the different acoustic
290
pressures used between the two animals, as well as the compounding effects of
291
differences in head size, skull thickness, the recorded neuron data from each animal
292
was analyzed separately and is quantified in figure 4 (top panel for monkey Y and
293
middle panel for monkey L). To minimize the difference between peak pressure in the
294
brain between the two animals the pressure was slightly reduced for monkey Y
295
(compared to Deffieux et al. 2013). Behaviorally, the latencies were significantly
296
modulated by TUS for monkey L across sessions (n=46, p<0.01) and marginally
297
modulated for monkey Y (n=39, p=0.08).
298 299
Typical trials
300
Figure 3: Recordings of neuronal spikes activated by single pulse TUS. (a) Example raw
301
data from 41 trials with TUS (red) and 179 without stimulation (blue). (b) Bootstrap
302
difference of the control vs. TUS condition at the same site (p<0.01). These data were
303
selected for illustration because the TUS elicited activation of diverse neuronal
304
elements. The triangles represent latencies for each trial respectively for TUS (red) or no
305
stimulation (blue) trials. The average firing activity across trials are shown during control
306
trials (blue line) and following TUS (red line) (figure 3a,b). Red and blue shaded areas
307
represent the 99% confidence interval respectively for average activity. The time course
308
of the difference between these two conditions (control and TUS) is shown in figure 3c,d.
309
The black line and shaded areas represent the 99% confidence interval for activity
difference when comparing TUS and control trials. The blue vertical rectangles represent
311
the time interval during TUS stimulation (100ms) where time t=0 corresponds to target
312
presentation. We consider the difference between TUS and control conditions activity as
313
statistically different from zero when p < 0.01 and the duration of the difference is
314
greater than or equal to 5ms.
315
The green (increase in activity) or red (decrease in activity) segments in fig. 3c,d
316
highlights these significant time periods. In the stimulation condition, figure 3a shows
317
that the activity started to increase 67 ms after TUS onset and became statistically
318
significantly different from the control condition 78 to 111 ms and from 113 to 125 ms
319
after TUS onset (shown by the first significant segment in fig. 3b). The neuron reached a
320
peak activity of 10.1Hz (with 99% CI of 15.48 and 21.61Hz) 99 ms after stimulation
321
onset compared to 2.1Hz (with 99% CI of 5.45 and 9.53Hz) during control trials. For this
322
neuron, this level of activity was maintained during the stimulation. After stimulation
323
ceased, the neuron activity decayed back to the activity observed during the control
324
condition. As shown on the right panel (figure 3b,d), a decrease in activity in the SEF
325
was also observed following FUS in the FEF. The activity of this neuron starts to
326
increase before TUS and appeared to be significantly reduced from 24 to 41 ms after
327 TUS onset. 328 329 Population activity 330
Figure 4a,b illustrates changes in the activity of the population of the neurons recorded
331
in the two animals. Significant periods of neuromodulation were observed for 39% and
41% of the recorded neurons respectively for monkey Y and L. A transient increase of
333
activity for 53% and 47% of neurons recorded respectively in monkey Y and L reveal the
334
perturbation induced by TUS. For 47% and 53% of neurons respectively in monkey Y
335
and L the perturbation was revealed by a significant decrease in activity.
336
Among all recorded neurons the effects of TUS parameters are presented
337
chronologically during the series of experiments for the 39 and 46 neurons respectively
338
recorded in monkey Y and L.
339
Each horizontal gray line represents a neuron. As in figure 3, the time origin corresponds
340
to target presentation, and shaded gray areas represent the stimulation period. The
341
colored lines in figure 4 highlight the periods during which the neuronal activity differed
342
significantly between TUS and control trials. The color of each segment represents the
343
p-value of the difference between TUS and control trials. Green (red) colored segments
344
correspond to excitation (inhibition). Figure 4a,b shows that many of the recorded
345
neurons had their activity modulated (increased or decreased) when TUS was applied in
346
both monkeys. Overall, our analysis demonstrates a significant effect on SEF neuronal
347
activity when TUS was applied to the FEF. Comparison between cell types based on
348
their functional properties(25,30) did not reveal any significant susceptibility (respectively
349
χ
2, p=0.39, for monkey Y andχ
2, p=0.37 for monkey L). For monkey Y: of 39 neurons, 0350
of the 3 of fixation; 5 of the 11 of movement; 9 of the 18 non-specific; 1 of the 7
post-351
saccadic; and 0 of 0 visual neurons showed a significant neuro-modulation induced by
352
TUS. For monkey L: of 46 neurons, 2 of 2 of fixation; 2 of 9 of movement; 13 of 26
non-353
specific; 1 of 7 post-saccadic; and 1 of 2 of visual neurons showed significant
modulation by TUS. In contrast to TUS stimulation applied to the FEF, TUS applied to
355
control extra-striate visual cortex did not significantly generate changes in activity rates
356
(figure 4c). Only one of the 20 recorded neurons did show a brief significant period of
357
modulation when the control region was stimulated compared with 39 and 41% of
358
significant neurons showing modulation when the FEF was stimulated in the same
359
animal (monkey L). We verified whether the observed change of activity during the
360
stimulation could be explained by a modification of the spikes isolation of the neuron due
361
to the ultrasound stimulation. We did not observe any difference of spike waveform
362
when comparing TUS and control conditions (figure 5), demonstrating that the pattern of
363
activity of our neuron observed during stimulation trials is not an artifact related to a
364
propagation of the ultrasound wave to the recorded region (CI: 99%). At the population
365
level none of the recorded neurons show a significant modulation of waveforms above
366
the confidence interval (Figure 6).
367 368
DISCUSSION
369
Focused ultrasound stimulation (FUS) techniques have been used to produce increased
370
neuronal firing rates in the peripheral and central nervous system in vitro or in
371
anesthetized preparations (4,31–35). Suppression of activity following FUS has also
372
been reported (5,36,37), as well as more subtle changes in excitability(38). However,
373
non-invasive exploitation of the concomitant effects of transcranial ultrasound stimulation
374
(TUS) in alert animals would have many applications in neuroscience. However, and
despite the increasing volume of work done with the emerging of transcranial ultrasound
376
stimulation (TUS), there is limited knowledge concerning its effects on neurons.
377
Investigating neural connectivity—how two connected regions interact by stimulating one
378
area and recording in another—is the most straightforward application. Our approach
379
was to perform the feasibility of such study by studying the interaction within the
380
oculomotor regions of the frontal lobes in awake primates performing an antisaccade
381
task. By combining TUS with traditional electrophysiology, the ability to study the
382
mechanisms of TUS is vastly expanded, and paves the way for research and
383
development needed to usher in the next generation of noninvasive TUS technologies
384
and treatments. In particular, the study opens the door for further parametric studies for
385
fine-tuning the ultrasonic parameters. The ultrasonic effect could indeed be quantified
386
based on the direct measurement of the intensity of the modulation induced on a single
387
neuron in a freely performing animal. In this paper the recorded region (SEF) was
388
different from the stimulated region (FEF) and despite the fact that these two regions are
389
connected, not each FEF neuron projects to an SEF neuron. The fact that TUS can
390
induce an effect in a connected brain region re-enforces the potential uses of this
391
technic to modify network activities. Further studies are required to better understand the
392
mechanisms of action of TUS. Potentially, clinical use of TUS might be similar to
393
transcranial magnetic stimulation (TMS) and could thus be valuable in the treatment of
394
depression(39), movement disorders(40,41), or patients suffering from perceptual
395
disorders(42). The development of ultrasonic neuro- modulation is largely motivated by
396
future therapeutic applications. This is the only neuromodulation technology currently
397
capable of being selective, targeted, reversible and noninvasive with millimeter-scale
precision essentially across the entire human and non-human primate brain(6–8) and
399
peripheral nervous system(43–45).
400
Moreover, deep seated clinical sites could be targeted with TUS, as is currently the case
401
in the thalamus with transcranial high intensity focused ultrasound.
402
ACKNOWLEDGMENTS
404
This work has been supported by the Bettencourt Schueller Foundation, the LABEX
405
WIFI (Laboratory of Excellence within the French Program "Investments for the Future")
406
under references ANR-10-LABX-24 and ANR-10-IDEX-0001-02 PSL and by the
407
National Agency for Research under the program "future investments" with the reference
408
ANR-10-EQPX-15. We wish to thank Jeff Schall and Jérôme Sallet for reading a
409
preliminary version of the manuscript and for suggesting useful improvements. We also
410
wish to thank Mathieu Santin for anatomical MRI acquisition.
411 412
AUTHOR CONTRIBUTIONS
413
N.W., T.D., J.F.A., and P.P., designed the experiments; N.W., performed the
414
experiments. C.C., and J.F.A, performed the simulations. N.W., P.M.D., and P.P.,
415
analyzed the data. N.W., T.D., C.C., P.M.D., M.T., J.F.A and P.P wrote the manuscript.
416
REFERENCES
418
419
1. Fry W, Meyers R, Fry F, Schultz D, Dreyer L, Noyes R. In: Trans Am Neurol
420
Assoc 1958; p16.
421
2. Gavrilov LR, Gersuni GV, Ilyinsky OB, Sirotyuk MG, Tsirulnikov EM, Shchekanov EE.
422
The effect of focused ultrasound on the skin and deep nerve structures of man and
423
animal. Prog Brain Res 1976; 279–92.
424
3. Younan Y, Deffieux T, Larrat B, Fink M, Tanter M, Aubry J-F. Influence of the
425
pressure field distribution in transcranial ultrasonic neurostimulation. Med Phys 2013;
426
40(8):82902.
427
4. King RL, Brown JR, Newsome WT, Pauly KB. Effective parameters for
428
ultrasound-induced in vivo neurostimulation. Ultrasound Med Biol 2013; 39(2):312–31.
429
5. Yoo S-S, Bystritsky A, Lee J-H, Zhang Y, Fischer K, Min B-K, et al. Focused
430
ultrasound modulates region-specific brain activity. NeuroImage 2011; 56(3):1267–75.
431
6. Deffieux T, Younan Y, Wattiez N, Tanter M, Pouget P, Aubry J-F. Low-intensity
432
focused ultrasound modulates monkey visuomotor behavior. Curr Biol 2013;
433
23(23):2430–3.
434
7. Legon W, Sato TF, Opitz A, Mueller J, Barbour A, Williams A, et al. Transcranial
435
focused ultrasound modulates the activity of primary somatosensory cortex in humans.
436
Nat Neurosci 2014; 17(2):322–9.
437
8. Lee W, Kim H, Jung Y, Song I-U, Chung YA, Yoo S-S. Image-guided transcranial
438
focused ultrasound stimulates human primary somatosensory cortex. Sci Rep 2015;
439
5:8743.
440
9. Aubry J-F, Tanter M. MR-Guided Transcranial Focused Ultrasound. Adv Exp Med
441
Biol 2016; 880:97–111.
442
10. Hynynen K, Clement G. Clinical applications of focused ultrasound-the brain. Int J
443
Hyperth Off J Eur Soc Hyperthermic Oncol North Am Hyperth Group 2007; 23(2):193–
444
202.
445
11. Heimburg T, Jackson AD. On soliton propagation in biomembranes and nerves.
446
Proc Natl Acad Sci USA 2005; 102(28):9790–5.
447
12. Krasovitski B, Frenkel V, Shoham S, Kimmel E. Intramembrane cavitation as a
448
unifying mechanism for ultrasound-induced bioeffects. Proc Natl Acad Sci USA 2011;
449
108(8):3258–63.
450
13. Plaksin M, Kimmel E, Shoham S. Cell-Type-Selective Effects of Intramembrane
451
Cavitation as a Unifying Theoretical Framework for Ultrasonic Neuromodulation. eNeuro
452
2016; 3(3).
453
14. Huerta MF, Krubitzer LA, Kaas JH. Frontal eye field as defined by intracortical
454
microstimulation in squirrel monkeys, owl monkeys, and macaque monkeys. II. Cortical
455
connections. J Comp Neurol 1987; 265(3):332–61.
456
15. Luppino G, Matelli M, Rizzolatti G. Cortico-cortical connections of two
457
electrophysiologically identified arm representations in the mesial agranular frontal
458
cortex. Exp Brain Res 1990; 82(1):214–8.
459
16. Percheron G, François C, Pouget P. What makes a frontal area of primate brain
460
the frontal eye field? Front Integr Neurosci 2015; 9:33.
17. Schall JD. Visuomotor Areas of the Frontal Lobe. In: Rockland KS, Kaas JH,
462
Peters A, editors. Extrastriate Cortex in Primates. Boston, MA: Springer US; 1997.
463
p527–638.
464
18. Bruce CJ, Goldberg ME. Primate frontal eye fields. I. Single neurons discharging
465
before saccades. J Neurophysiol 1985; 53(3):603–35.
466
19. Marrocco RT. Saccades induced by stimulation of the frontal eye fields:
467
interaction with voluntary and reflexive eye movements. Brain Res 1978; 146(1):23–34.
468
20. Moore T, Fallah M. Control of eye movements and spatial attention. Proc Natl
469
Acad Sci USA 2001; 98(3):1273–6.
470
21. Moore T, Armstrong KM. Selective gating of visual signals by microstimulation of
471
frontal cortex. Nature 2003; 421(6921):370–3.
472
22. Ekstrom LB, Roelfsema PR, Arsenault JT, Bonmassar G, Vanduffel W. Bottom-up
473
dependent gating of frontal signals in early visual cortex. Science 2008; 321(5887):414–
474
7.
475
23. Thickbroom GW, Stell R, Mastaglia FL. Transcranial magnetic stimulation of the
476
human frontal eye field. J Neurol Sci 1996; 144(1–2):114–8.
477
24. Pouget P. The cortex is in overall control of “voluntary” eye movement. Eye 2015;
478
29(2):241–5.
479
25. Pouget P, Murthy A, Stuphorn V. Cortical control and performance monitoring of
480
interrupting and redirecting movements. Philos Trans R Soc B Biol Sci 2017;
481
372(1718):20160201.
482
26. Sieu L-A, Bergel A, Tiran E, Deffieux T, Pernot M, Gennisson J-L, et al. EEG and
483
functional ultrasound imaging in mobile rats. Nat Methods 2015; 12(9):831–4.
484
27. Macé E, Montaldo G, Cohen I, Baulac M, Fink M, Tanter M. Functional ultrasound
485
imaging of the brain. Nat Methods 2011; 8(8):662–4.
486
28. Jacob X, Barriere C, Takatsu R, Montaldo G, Royer D. Optical measurement of
487
transient ultrasonic shock waves. IEEE 2004; p52–5.
488
29. Daye PM, Roberts DC, Zee DS, Optican LM. Vestibulo-ocular reflex suppression
489
during head-fixed saccades reveals gaze feedback control. J Neurosci Off J Soc
490
Neurosci 2015; 35(3):1192–8.
491
30. Stuphorn V, Schall JD. Executive control of countermanding saccades by the
492
supplementary eye field. Nat Neurosci 2006; 9(7):925–31.
493
31. Tyler WJ, Tufail Y, Finsterwald M, Tauchmann ML, Olson EJ, Majestic C. Remote
494
Excitation of Neuronal Circuits Using Low-Intensity, Low-Frequency Ultrasound.
495
Tanimoto H, editor. PLoS ONE 2008; 3(10):e3511.
496
32. Tufail Y, Matyushov A, Baldwin N, Tauchmann ML, Georges J, Yoshihiro A, et al.
497
Transcranial Pulsed Ultrasound Stimulates Intact Brain Circuits. Neuron 2010;
498
66(5):681–94.
499
33. Kim H, Chiu A, Lee SD, Fischer K, Yoo S-S. Focused Ultrasound-mediated
Non-500
invasive Brain Stimulation: Examination of Sonication Parameters. Brain Stimulat 2014;
501
7(5):748–56.
502
34. Naor O, Hertzberg Y, Zemel E, Kimmel E, Shoham S. Towards multifocal
503
ultrasonic neural stimulation II: design considerations for an acoustic retinal prosthesis. J
504
Neural Eng 2012; 9(2):26006.
505
35. Menz MD, Oralkan O, Khuri-Yakub PT, Baccus SA. Precise Neural Stimulation in
the Retina Using Focused Ultrasound. J Neurosci 2013; 33(10):4550–60.
507
36. Min B-K, Bystritsky A, Jung K-I, Fischer K, Zhang Y, Maeng L-S, et al. Focused
508
ultrasound-mediated suppression of chemically-induced acute epileptic EEG activity.
509
BMC Neurosci 2011; 12(1):23.
510
37. Kim H, Park MY, Lee SD, Lee W, Chiu A, Yoo S-S. Suppression of EEG
visual-511
evoked potentials in rats through neuromodulatory focused ultrasound: NeuroReport
512
2015; 26(4):211–5.
513
38. Moore JH, Gieck JH, Saliba EN, Perrin DH, Ball DW, McCue FC. The biophysical
514
effects of ultrasound on median nerve distal latencies. Electromyogr Clin Neurophysiol
515
2000; 40(3):169–80.
516
39. George MS, Taylor JJ, Short EB. The expanding evidence base for rTMS
517
treatment of depression. Curr Opin Psychiatry 2013; 26(1):13–8.
518
40. Lefaucheur J-P, André-Obadia N, Antal A, Ayache SS, Baeken C, Benninger DH,
519
et al. Evidence-based guidelines on the therapeutic use of repetitive transcranial
520
magnetic stimulation (rTMS). Clin Neurophysiol Off J Int Fed Clin Neurophysiol 2014;
521
125(11):2150–206.
522
41. Hallett M. Transcranial magnetic stimulation and the human brain. Nature 2000;
523
406(6792):147–50.
524
42. Leocani L, Cohen LG, Wassermann EM, Ikoma K, Hallett M. Human corticospinal
525
excitability evaluated with transcranial magnetic stimulation during different reaction time
526
paradigms. Brain J Neurol 2000; 123:1161–73.
527
43. Tsui P-H, Wang S-H, Huang C-C. In vitro effects of ultrasound with different
528
energies on the conduction properties of neural tissue. Ultrasonics 2005; 43(7):560–5.
529
44. Colucci V, Strichartz G, Jolesz F, Vykhodtseva N, Hynynen K. Focused
530
Ultrasound Effects on Nerve Action Potential in vitro. Ultrasound Med Biol 2009;
531
35(10):1737–47.
532
45. Juan EJ, González R, Albors G, Ward MP, Irazoqui P. Vagus nerve modulation
533
using focused pulsed ultrasound: Potential applications and preliminary observations in
534
a rat. Int J Imaging Syst Technol 2014; 24(1):67–71.
535 536 537 538 539 540 541 542
Table 1: Estimations of peak pressure in monkeys' brains 543 544 Monkey Y Monkey L VPP 139±26 V 56±15 V Equivalent PNP in free water 0.76±0.08 MPa 0.31±0.14MPa
Simulated steady state
PNPin FEF 0.41±0.08 MPa 0.24±0.07 MPa
545
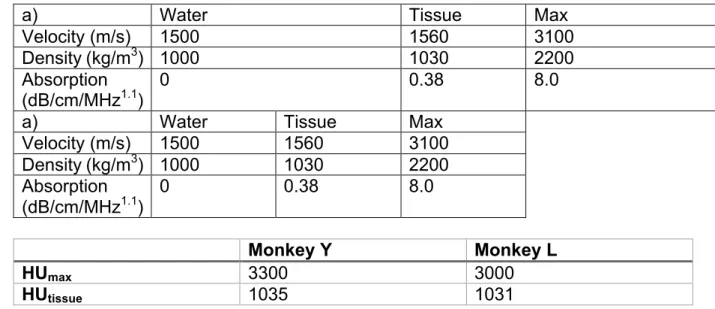
Table 2: Acoustic parameters
546 547
a) Water Tissue Max
Velocity (m/s) 1500 1560 3100
Density (kg/m3) 1000 1030 2200 Absorption
(dB/cm/MHz1.1) 0 0.38 8.0
a) Water Tissue Max
Velocity (m/s) 1500 1560 3100 Density (kg/m3) 1000 1030 2200 Absorption (dB/cm/MHz1.1) 0 0.38 8.0 548 Monkey Y Monkey L HUmax 3300 3000 HUtissue 1035 1031 549
FIGURE CAPTIONS:
550
Figure 1: The ultrasonic transducer was attached to a neuro-navigation module that
551
allows co-registration of digitized external coordinate systems with the internal MRI
552
coordinate system. This system makes it possible to direct an attached transducer in
553
real-time to functional and anatomical target regions of the brain (Rogue Research).
554
Using this co-registration, the cigar-shaped focal spot of of FUS was placed over the left
555
FEF (red spot). For each animal the FEF was identified with anatomical landmarks
556
(arcuate sulcus AC, and principal sulcus PS). A coupling cone filled with water ensured
557
ultrasonic coupling between the transducer and the animal’s head. The
558
neurophysiological recordings were performed in the left SEF area (yellow spot) through
559
a recording chamber and grid adaptor.
560 561
Figure 2: Peak negative pressure (MPa) in the brains of monkey Y (left) and L (right)
562
from simulations, taking into account the respective voltage applied to the ultrasonic
563
transducer (139±26 V and 56±15 V).
564 565
Figure 3. Average recorded spikes per seconds with (red lines) or without (blue lines)
566
single pulse TUS. The two columns represent two examples of neurons showing
567
significant change of activity following FUS. Vertical blue shaded area represents the
568
time interval of FUS. Origin of time corresponds to the appearance of the visual
569
stimulus.
(a) Example from a neuron showing an increase of activity with FUS. Triangles
571
represent ranked saccadic latencies for each trial respectively with (red) or without (blue)
572
TUS. (b) Example from a single neuron showing a decrease of activity with FUS while
573
the monkey is preparing a saccade opposite to the target. (c and d) Bootstrap difference
574
of the control vs TUS condition (grey). Significant differences between FUS and control
575
trails are respectively represented by a red (FUS < Control trials) or green (FUS >
576
Control trials) line (p<0.01). These two neurons were selected for illustration because
577
the TUS elicited activation of diverse neuronal elements.
578 579
Figure 4. Modulation while comparing TUS and control trials (p< 0.01) in the population
580
of recorded neurons in the two animals. Significant differences between FUS and control
581
trails are respectively represented by a red (FUS < Control trials) or green (FUS >
582
Control trials) line (p<0.01) for leftward (left panel) or rightward (right panel) direction of
583
eye movement. Vertical gray shaded area represents the time interval of TUS. Origin of
584
time corresponds to the appearance of the visual stimulus. Top panel population of 46
585
for Monkey L. Middle panel: 39 neurons respectively for Monkey Y. Bottom panel of 20
586
neurons while TUS is being applied to the control region. Note that the significant
587
periods of neuro-modulation are drastically reduced (if present at all) during the control
588
condition. All isolated and recorded neurons were analyzed and no selection was made
589
to avoid sampling bias due to cell types.
590 591
Figure 5. Spike waveforms with and without FUS. A) All spike waveforms from a
592
representative session without stimulation (blue thick line —) B) median ± CI 99% (blue
593
thin line —). C) All spike waveforms from a representative session with focused
594
ultrasound stimulation (red thick line —) B) median ± CI 99% (red thin line —).
595 596
Figure 6. Height / Width ratio of spike waveforms with and without FUS for all neurons
597
recorded in monkey L and monkey Y respectively. Note that none of the recording show
598
a significant deviation while comparing FUS and no FUS trials (p >0.6).
599 600
x4
x2
4.7 mm
33 mm
5 mm
10 mm
Coupling cone
Ultrasound
transducer
-3
dB
focal spot
Supporting
arm
AS
PS
Microelectrode
recording sites
Neuronavigator
markers
Upper view of
the Monkey
Head
Monkey Y
0 20 40 60 80 100 Lateral (mm) 0 20 40 60 80 100 120 140 Axial (mm)Monkey L
0 20 40 60 Lateral (mm) 0 20 40 60 80 100 120 0 0.1 0.2 0.3 0.4 0.5 0.6 80 120 Axial (mm) P (MPa)a) b)
c) d)
Example recording 1
stim. OFF stim. ON stim. Off
Example recording 2
0.1
0.3
0.5
0
20
Monkey Y
Monkey L
Control
# of N
eur
ons
Time from Stimulation (s)
-0.1
Lateralized fields of movement
0
46
0
39
0.0
0.2
0.4
-0.1 0.0
0.1
0.2
0.3
0.4
0.5
a)
b)
c)
Time (µs)
Time (µs)
V
oltage (µv)
V
oltage (µv)
a)
c)
b)
d)
0 1 2 3 4 5 6 7 8 9 10 11 0 1 2 3 4 5 6 7 8 9 10 11 0 2 4 6 8 10 12 14 16 0 2 4 6 8 10 12 14 16
Monkey L
Monkey Y
H ei g h t/ W id th r a ti o u n d er FU SHeight/Width ratio without FUS
H ei g h t/ W id th r a ti o u n d er FU S