Seasonally intermittent water
flow through deep fractures in an Alpine
Rock Ridge: Gemsstock, Central Swiss Alps
Marcia Phillips
a,⁎
, Anna Haberkorn
a,d, Daniel Draebing
b, Michael Krautblatter
c,
Hansueli Rhyner
a, Robert Kenner
aa
WSL Institute for Snow and Avalanche Research SLF, Flüelastrasse 11, CH-7260 Davos, Switzerland b
Department of Geography, Meckenheimerallee 166, Bonn University, D-53115 Bonn, Germany c
Technische Universität München, Arcisstrasse 21, D-80333 Munich, Germany
dUnit of Geography, University of Fribourg, ch. du Musée 4, CH-1700 Fribourg, Switzerland
Geological investigations and seismic refraction tomography reveal a series of 70° steep, parallel and continuous fractures at 2950 m asl within the Gemsstock rock ridge (Central Swiss Alps), at the lower fringe of alpine perma-frost. Temperature measurements in a 40 m horizontal borehole through the base of the ridge show that whilst conductive heat transfer dominates within the rock mass, brief negative and positive temperature anomalies are registered in summer. These have very small amplitudes and coincide with summer rainfall events lasting longer than 12 h. In contrast, a complete lack of anomalous thermal signals during spring snowmelt suggests that runoff does not penetrate the open joints, despite high snow water equivalents of around 400 mm. This is attributed to the development of an approximately 20 cm thick, continuous and impermeable basal ice layer which forms at the interface between the snow cover and the cold rock on the shady North facing rock wall during snowmelt. Spring snowmelt water therefore does not affect rock temperatures in the centre of the rock mass, despite the presence of deep open joints. The mechanical impact of snowmelt infiltration on rock wall stability at depth is thus assumed to be negligible at this site.
1. Introduction
Thermal regimes of fractured rock walls are of particular interest re-garding rock slope stability and infrastructure maintenance in cold mountain regions. Geological structure has a significant influence on rock temperature because the distribution and geometry of rock discon-tinuities determines patterns, rates and intensity of heat exchange in-duced by water infiltration, air circulation and phase changes within the rock mass. Although recent studies have provided detailed insight on near-surface processes in rock fractures (Hasler et al., 2011b; Magnin et al., 2015), only few measurements have been made at depth in high mountain environments (Gischig et al., 2011). Knowledge of rock temperature regimes at depth in cold regions is useful to inves-tigate the preconditioning of deep-seated rock slope failures (Gruber and Haeberli, 2007; Huggel, 2008) and is crucial for the planning and maintenance of critically sensitive anchored infrastructure such as cable car pylons (Bommer et al., 2010).
In substrates with uniform material properties and nofluid move-ment, the dominant form of heat transfer is conduction (Kane et al., 2001). In reality however, rock walls tend to be fractured to a certain
degree. Open fractures allow water infiltration and a multitude of other processes including phase change, ice segregation (Murton et al., 2006), ice degradation (Fischer et al., 2006; Krautblatter et al., 2013), va-pour transport and air circulation (Moore et al., 2011) can occur within the fractured rock system. In addition, fractured rock walls usually have a complex surface topography with asperities on which snow can accu-mulate (Wirz et al., 2011). Snow is both a thermal regulator and a source of water, which translates into potential energy transported by advection (Hasler et al., 2011a) and pressure if it can penetrate the rock mass. The thermal regime of fractured rock walls is therefore spa-tially and temporally variable and involves various combinations of con-ductive and non-concon-ductive heat transfer mechanisms as well as latent heat exchange. Water, snow and ice play a crucial thermo-mechanical role in this system.
Mountain snowpacks and spring runoff are important water re-sources at high elevations (Stewart, 2009). Recent studies show that significant amounts of snow (several decimetres to metres) can accu-mulate in very steep (70–80°), rough rock slopes (Haberkorn et al., 2015b; Magnin et al., 2015; Wirz et al., 2011). This implies potentially high snow water equivalents in mountain rock walls at the onset of snowmelt in spring. Snowmelt runoff is concentrated in fractured sec-tions of rock walls. There is a limited amount of measured data in the lit-erature on the thermal and mechanical effects of snowmelt water
⁎ Corresponding author. Tel.: +41 81 417 02 18. E-mail address:phillips@slf.ch(M. Phillips).
Published in "Cold Regions Science and Technology 125: 117–127, 2016"
which should be cited to refer to this work.
infiltration, but snowmelt is often mentioned as having a significant in-fluence on rock temperature and on slope instability (Draebing et al., 2014).Stock et al. (2013)list snowmelt as one of several‘probable’ rock fall triggering conditions, whereby the influence of snowmelt is primarily inferred by temporal coincidence.Hasler et al. (2012) ob-served that near-surface rock slope instabilities may be triggered through meltwater infiltration and temperature-related strength loss at the rock-ice interface in ice-filled clefts.Matsuoka (2001)observed that frost wedging was likely due to the refreezing of meltwater in joints. Snowmelt infiltration rates exceeding 80 mm day−1were
mea-sured on a 40° permafrost talus slope in the Swiss Alps, triggering a sharp increase in ground temperature and simultaneously causing sub-stantial slope deformation (Rist and Phillips, 2005). Steep rock slopes have a lower porosity than talus slopes, but if snowmelt runoff pene-trates open joints, it will increase shear stress by increasing hydrostatic pressure (Wieczorek and Jäger, 1996), may induce short-term cryostat-ic forcing and can lead to fracture widening (Blikra and Christiansen, 2014; Krautblatter et al., 2013).Oppikofer et al. (2009)observed that the Åknes rockslide shows acceleration during snowmelt and after heavy rainfall.
A phenomenon particular to sites with cold substrates can neverthe-less impede the infiltration of snowmelt into open fractures. Snowmelt percolates downwards along preferentialflow paths within the snow-pack and along the base of the snow on inclined impermeable sub-strates (Marsh, 2006). If the ground is cold enough to dissipate the latent heat of freezing, a basal ice layer can form at the snow-rock inter-face by refreezing of the melt water (Woo and Heron, 1981). The thick-ness of the basal ice is controlled by the amount of water percolating at the base of the snowpack, the permeability of the substrate and by the snow and substrate temperatures (Woo et al., 1982). The latter ob-served that the formation of an impervious basal ice layer immediately prevents water infiltration into the substrate.
Long-term rock temperature measurements are available from sev-eral boreholes in alpine permafrost (e.g.Gruber et al., 2004; PERMOS, 2013; Zenklusen Mutter et al., 2010) and temperature is a useful tag for providing information about the origin andflow history of water in rock fractures (Bodvarsson, 1969). However, only few boreholes are lo-cated in steep rock walls (Nötzli et al., 2010; Wegmann et al., 1998) and rock wall temperature sensors with a high spatial and temporal resolu-tion are mostly found in shallow boreholes (Hasler et al., 2012; Magnin et al., 2015). As a result, very little is known about rock wall hydrology in mountain permafrost regions (Krautblatter et al., 2012). Ideally, a com-bination of thermal and structural information is required to improve this lack of information.
Seismic Refraction Tomography (SRT) allows lateral and spatial mapping of the active layer or internal structures such as ice lenses, and sharply resolves even small structures due the seismic travel path along boundaries (Hauck and Vonder Mühll, 2003). SRT is therefore used to detect ice lenses in sub-alpine scree slopes (Kneisel and Hauck, 2003; Stiegler et al., 2014), alpine talus and debris-covered slopes (Hauck et al., 2004; Hilbich, 2010) as well as rock glaciers (Maurer and Hauck, 2007; Musil et al., 2002). In low-porosity alpine rock walls, developing ice pressure can be detected using SRT (Draebing and Krautblatter, 2012). SRT is also used to identify the spa-tial distribution of active layer thaw and structural features such as dis-continuities (Draebing et al., 2014; Heincke et al., 2006; Krautblatter and Draebing, 2014).
One site where SRT measurements are combined with rock tem-peratures measured from the surface to several decametres depth within the fractured rock mass is the Gemsstock ridge in the Central Swiss Alps (Haberkorn et al., 2015b). In this study, we investigate the thermal regime in the ridge and show how it is influenced by the geological structure and in particular by a series of steep parallel open joints. The latter intersect a horizontal borehole equipped with thermistors. Using geological and seismic investigations of rock structure, rock temperature data, and in-situ snow cover investigations
we examine thermal signals caused by snowmelt and refreezing of snowmelt water at the rock surface in spring and by water infiltration into the rock joints in summer. In contrast to widespread references in the literature, we show that the thermal and mechanical role of spring snowmelt is negligible at depth in this particular fractured rock wall.
2. Site description
Gemsstock is a NE–SW oriented ridge at 2960 m asl (Fig. 1) above Andermatt in the Gotthard range of the Central Swiss Alps (46°36′ 7.74″N; 8°36′41.98″E). The site is at the lower fringe of Alpine perma-frost, with patchy occurrences of permafrost in the North facing wall of the ridge, as indicated by the presence of ice in fresh rockfall scars and by the absence of permafrost in an instrumented horizontal bore-hole. The discontinuous nature of permafrost distribution at the site is confirmed by the Swiss map of permafrost distribution (seehttp:// map.geo.admin.ch). The North facing 30–40 m high rock wall is under-going deglaciation at its base. Terrestrial laser scans (Kenner et al., 2011) show that the retreat of the Gurschen and St. Anna glaciers (Fig. 1) causes an annual glacier surface depression of around 1–2 m every summer.
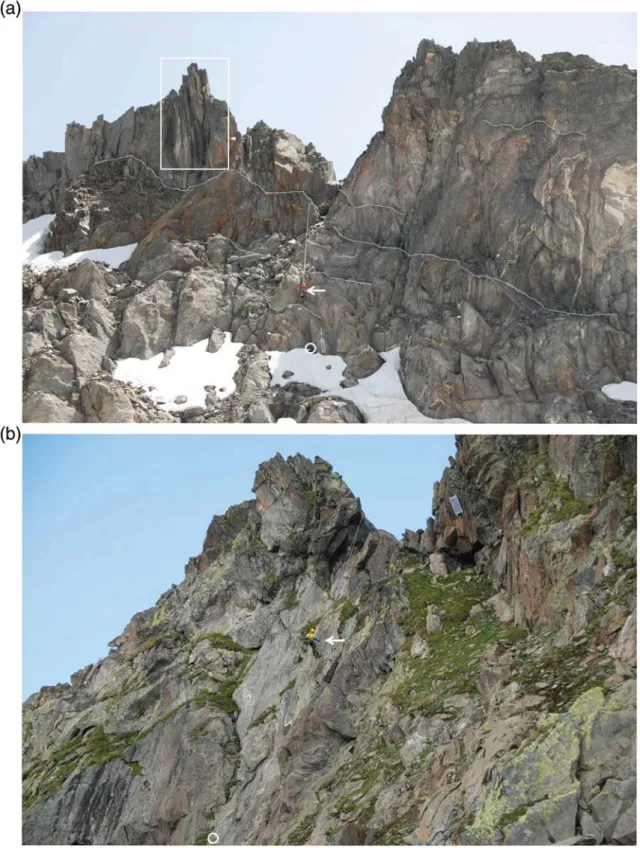
The Gemsstock ridge consists of Gotthard granodiorite and gneiss. The North facing scarp slope is characterized by a series of persistent parallel joints dipping steeply south-eastwards at 70°. The joints form horizontal ledges in the rock wall with a spacing of roughly 3–5 m (Fig. 2a). The joints are assumed to be continuous be-cause water does not accumulate in them in summer. The dominant form of failure in this scarp slope is toppling (Kenner et al., 2011). In contrast, the South facing dip slope is very stable and has a relatively smooth rock surface, exposing the mentioned south-eastward dipping joints (Fig. 2b).
The Gemsstock ridge is on the main weather divide of the Alps and is therefore affected by southerly and northerly airflows. The site has en-hanced orographic and convective cloud formation and high precipita-tion values with measured maximum winter snow depths exceeding 4 m. Mean annual precipitation at the MeteoSwiss automatic weather station (AWS) Gütsch, 6 km North of Gemsstock at 2287 m asl, was 1535 mm a−1over the 2 year study period between 1 January 2012 and 31 December 2013. The mean annual air temperature at the AWS Gemsstock (2869 m asl, seeFig. 1) was−2.9 °C for the same period (see also section onMeteorological Databelow).
This paper focuses on a sector of the North facing Gemsstock rock wall 200 m to the West of the Gemsstock summit cable car station. We analyse this particular area because a horizontal borehole was drilled through the base of the ridge here (Figs. 1–3) in 2005 and equipped with thermistors. The borehole temperature data reveal that there is no permafrost at the level of the borehole. We focus on the 2-year period between 1 January 2012 and 31 December 2013.
3. Methods
3.1. Determination of fracture characteristics
Fracture dip, direction of dip and aperture were measured manually at the surface along a transect reaching from the top of the Gemsstock ridge to the base of the northern scarp face (Querner, 2013). The south face is a dip slope consisting of one major fracture system. The same south-eastward dipping joints set is apparent from ledges as 10 continuous fractures that can be traced along the North face (Fig. 2a). In-terpretation was performed using OpenStereo (Grohmann and Campanha, 2010) along a NW–SE scanline between both ends of the horizontal borehole. Fracture widths were measured manually and pho-tographs of major fracture systems taken (Fig. 2).
3.2. Seismic refraction tomography
Seismic refraction tomography (SRT) visualises spatial patterns of compressional wave (P-wave) velocity within the ground. P-wave veloc-ities of intact rock are influenced by rock moisture (Nur and Simmons, 1969) and freezing of pore water (Draebing and Krautblatter, 2012; Timur, 1968). In addition, seismic velocities are determined by rock properties which cause rock and seismic anisotropy (Barton, 2007; Thomsen, 1986; Wang, 2001). Anisotropy can be distinguished into in-duced anisotropy due to pores and fractures and intrinsic anisotropy as a result of mineral components and textural–structural characteristics, such as bedding (Lo et al., 1986). However, only induced anisotropy cor-responds to stress and can decrease due to loading or ice pressure (Draebing and Krautblatter, 2012; Heincke et al., 2006). In rock walls, P-wave velocities also depend on the density and orientation of discon-tinuities (Leary and Henyey, 1985). If vertical discontinuities remain open, compressional waves travelling perpendicular to discontinuity di-rection will be slowed down more than parallel travelling waves (Barton, 2007). Thus, discontinuities cause macroscopic anisotropy.
To quantify the effect of microscopic anisotropy in intact rocks, P-wave velocity was tested in the laboratory on a rock sample from the Gemsstock under natural water-saturated and frozen conditions by
Draebing and Krautblatter (2012). When saturated, the P-wave veloci-ties range from 4039 ms−1perpendicular to cleavage, to 5191 ms−1 parallel to cleavage. In frozen conditions, P-wave velocity approaches 4759 ms−1perpendicular to cleavage and 6078 ms−1parallel to cleav-age (see Table 2 inDraebing and Krautblatter, 2012). Anisotropy is around 22% for saturated conditions and only shows a minor decrease due to freezing. Anisotropy is therefore predominantly influenced by intrinsic anisotropy (Draebing and Krautblatter, 2012). At the rock slope scale, the inherent microscopic anisotropy can be increased by
macroscopic anisotropy due to discontinuities and fractures (Heincke et al., 2006).
A 90 m long transect consisting of 24 drilled geophone positions with 3 m spacing was installed on the rock surface over the Gemsstock ridge between both ends of the borehole. In July 2014, seismic shots were generated by abseiling, using a 5 kg sledgehammer between every geophone and off-end shots 1.5 m and 4.5 m before and after thefirst and last geophones. The ridge topography was derived from terrestrial laser scans. Topographic data was reduced to 60 points and a topographic model reflecting the major topographic properties of the rock wall was generated using the seismic software Reflex W 7.0. SRT data was processed according to Krautblatter and Draebing (2014)with a model block size of thefinal tomography of 0.5 m. A ray tracing was performed to quantify ray density which shows the number of rays crossing a model block divided by the total number of rays (Sandmeier, 2012). To quantify the quality offinal tomographies, total absolute time difference (1.39 ms−1) and root mean square error (1.79%) were calculated, which indicate a good quality of the SRT (Sandmeier, 2012).
3.3. Borehole temperature measurements
In 2005 a horizontal borehole was drilled through the Gemsstock ridge at an elevation of 2905 m asl and equipped with a watertight, grouted PVC tube with wall thickness of 6 mm and an inner diameter of 71 mm. Grout thickness at the interface between the PVC tube and the rock is 43 mm. The borehole is oriented NW to SE and is perpendic-ular to the orientation of the ridge. The southern end was plugged with grout and a water-tight lid was installed at both ends of the PVC tube to prevent any incursion of air or water. The borehole is 40 m long and equipped with a chain of 27 YSI-44008 thermistors, which were
Fig. 1. Aerial photograph of Gemsstock (map data: swissimage©2015 swisstopo, 5704000000) showing the location of the study site over the ridge where the borehole (dashed red line) is, the N and S ends of the borehole (red dots), the automatic weather station (AWS, red dot), the locations of the N and S cameras (orange dots) and the summit cable car station. Inset: Map of Switzerland showing the location of Gemsstock in the Central Swiss Alps (DHM25L2©2015 swisstopo, 5704000000).
calibrated at 0 °C in an ice-water mixture and have a calibrated accuracy of 0.01 °C. The thermistors are located at the following distances from the northern end of the borehole:−0.2, 0.05, 0.3, 0.55, 0.8, 1.3, 1.8, 2.8, 3.8, 5.8, 7.8, 9.8, 11.8, 15.8, 19.8, 23.8, 27.8, 29.8, 31.8, 33.8, 35.8, 36.8, 37.8, 38.3, 38.8, 39.05, and 39.3 m. The term thermistor‘depths’
indicates their horizontal distance from the northern end of the bore-hole (Fig. 3). The northernmost thermistor (−0.2 m) protrudes 20 cm from the rock but is encased in the PVC tube. Temperature data is regis-tered on a two-hourly basis using a Campbell CR1000 logger. In this paper, borehole temperature data from 2012 and 2013 are presented.
Fig. 2. a: The North facing scarp rock slope of the Gemsstock ridge. The northern end of the borehole is marked (white circle). Some major rock ledges corresponding to open continuous joints are shown (dotted white lines). Note the cross-sectional view of steep joints in the upper left part of the ridge (white rectangle). b: The South facing dip slope of the Gemsstock ridge. The rock face corresponds to the major south-eastward joint set. The southern end of the borehole is marked (white circle). A person is visible for scale on both photographs (white arrows). (Photographs: M. Phillips).
Nevertheless, it should be noted that comparable thermal phenomena as are analysed here have been registered yearly since the beginning of the measurements in 2005.
3.4. Near-surface rock temperature measurements
Near-surface rock temperatures (NSRT) were measured in 0.1 m deep boreholes at 2-h intervals using Maxim iButtons (DS1922L), which were calibrated in an ice-water bath and have a calibrated accu-racy of ±0.25 °C. The iButtons were placed in water-resistant plastic capsules to prevent device failure due to water infiltration. Tests in an ice–water mixture showed that these cause a delayed thermal response of 12 min (Haberkorn et al., 2015b). Thermal conduction paste was used to improve the contact between the capsules and the rock. The shallow boreholes were sealed with rubber plugs to protect the devices from at-mospheric influences and direct exposure to solar radiation.
Data from two iButtons representing typical contrasting snow cover conditions in the rock wall will be presented here: iButton N3 is located in a vertical sector near the top of the rock wall, whereas iButton N5 is located 6 m lower at the foot of this part of the rock wall close to a ledge corresponding to a joint entrance (Fig. 3). NSRT data indicate that N3 was generally snow free, except during and shortly after storms, when snow or rime adhered to the rock. Although iButton N5 is located in 70° steep rock, a rock ledge 0.5 m below allows the accumulation of a thick snow cover in winter. The presence or absence of snow was esti-mated using NSRT standard deviation thresholds (Haberkorn et al., 2015a; Schmid et al., 2012).
3.5. Terrestrial laser scanning
Terrestrial laser scanning has been carried out at Gemsstock yearly in summer since 2006 using a Riegl LPM-321 scanner to quantify volu-metric changes and to determine zones and modes of failure in the North facing rock wall (Kenner et al., 2011). These scans provide high-resolution digital elevation models of the snow-free rock walls. Since 2012 scans using a Riegl VZ6000 long-range laser scanner have also been carried out at different times in the winter. Snow distribution and snow depths in the rock wall were determined by comparing the data to that obtained in the snow-free summer scans (Haberkorn et al., 2015a,b).
3.6. Snow pits
Snow pits were dug in early- and mid-winter, as well as in spring in the rock walls above the borehole at Gemsstock since 2012. They were dug in various positions along the transect between both ends of the borehole (Fig. 1, red dashed line). These manual measurements are
carried out to obtain detailed in-situ information on snow cover charac-teristics in the rock walls. Position, elevation, slope angle and aspect were measured at each snow pit site. Snow cover characteristics were classified according toFierz et al. (2009). Snow layer thickness, grain type, grain size, hand hardness index, snow density, snow temperature and snow–rock interface temperature were recorded. Rime or glazing on the snow or rock surfaces was registered optically, as were cavity hoar and ice layers at the base of the snowpack or in rock joint apertures.
3.7. Automatic time-lapse photography
Time-lapse photographs of the north and south facing rock walls at Gemsstock were taken hourly from two positions (Fig. 1) with automat-ic cameras (Panasonautomat-ic Lumix DMC-FZ200). The photographs are useful to determine weather conditions, the approximate duration of precipi-tation events (there is no precipiprecipi-tation gauge at Gemsstock) and the timing of snow cover melt out.
3.8. Meteorological data
Two automatic weather stations provided meteorological data for this study. The AWS Gemsstock (2869 m asl) is located at the foot of the northern rock slope. This station provided data on air temperature, relative humidity, global radiation, wind speed, wind direction and snow depth over the period analysed here (2012–2013). The MeteoSwiss AWS Gütsch (2287 m asl) is situated 6 km North of Gemsstock. Data from the AWS Gütsch was used to estimate the occur-rence and duration of precipitation events at Gemsstock, since no measurement of liquid precipitation is carried out at this high alpine lo-cation. As summer rainfall events in the Alps are often local phenomena due to convection and vary strongly in timing and magnitude, the pre-cipitation measured at Gütsch is only used qualitatively here to confirm the occurrence of precipitation events captured by time lapse photogra-phy at the study site.
4. Results and discussion
4.1. Geometry of rock joints at the surface and inferred at depth
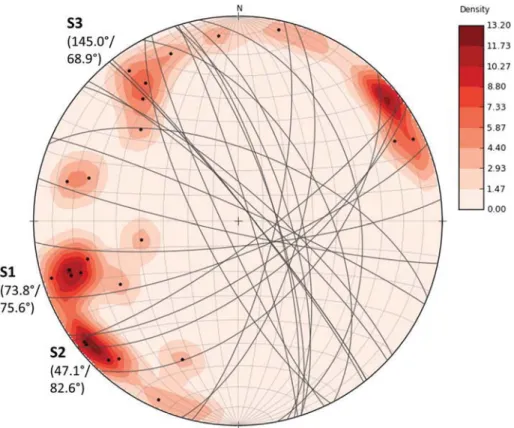
Fig. 4shows three dominant joint sets in the Gemsstock rock mass. Joint sets 1 (73.8°/75.6°) and 2 (47.1°/82.6°) are a series of steeply dip-ping SE and NW oriented joint systems; the predominant SE dipdip-ping continuous joint system (14 of 25 joints) is roughly illustrated inFig. 3
and separates the rock face into metre thick slabs separated by the frac-tures with partially infilled apertures of 4 to 25.5 cm width (Fig. 5), which are open to water and air circulation. A smaller NW dipping joint system (set 3, 145.0°/68.9°) with partially infilled apertures between 0.3 and 9.0 cm may connect with some of the dominant SE dipping joint system (Fig. 5).
The SRT highlights these linear features with higher P-wave veloci-ties than the surrounding rock mass. These correspond to the location and the dip angle (approximately 70°) of the mapped fractures (Fig. 5a). The ray density is significantly increased in these areas and over 10% of the seismic rays travel along them (Fig. 5b). Sub-vertical fractures result in a greater deceleration of the perpendicular P-waves travelling normal to the fractures than of the parallel P-waves travelling parallel to the fractures (Leary and Henyey, 1985). The South face is a 70° dip slope consisting of one major fracture system with sub-parallel fractures (S1 and S2). As a consequence, seismic waves on the South facing rock wall travel as mainly parallel P-waves, which are 20% faster than perpendicular P-waves (Draebing and Krautblatter, 2012) and are less strongly decelerated (Leary and Henyey, 1985). The combination of microscopic anisotropy due to textural-structural prop-erties and macroscopic anisotropy due to discontinuities results in areas of high P-wave velocities on the fracture-free lower part of the
south-Fig. 3. Outline of Gemsstock ridge obtained by terrestrial laser scanning and rough sketch showing the general disposition of the ~70° steep joints (dashed lines) and how they intersect the 40 m borehole (blue line). The positions of two iButton devices measuring near-surface rock temperature on the N slope are shown (yellow dots): N3 (2925 m asl) and N5 (2919 m asl).
facing rock wall. The P-wave velocity pattern is consistent with the dominant dip angle of the discontinuities and thus suggests a dominant effect of macroscopic anisotropy, similar to that observed in the Randa rock slope (Heincke et al., 2006). The SRT measurements therefore con-firm the geological structure determined manually at the rock surface and illustrate the fracture distribution within the rock mass. Further-more, the tomographies suggest that the fractures connect the north facing rock wall with the borehole and intersect the borehole between 10 and 32 m, as sketched inFig. 3. This connection enables waterfluxes as observed for example byHasler et al. (2011a)and possibly airflow (Moore et al., 2011) along fractures, which may be reduced in winter due to ice infill at the joint apertures.
4.2. Borehole temperatures
The seasonallyfluctuating quasi-sinusoidal character of the borehole temperatures indicate that the dominant form of heat transfer within the ridge is conduction, as would be expected in a 40 m thick rock mass (Fig. 6). However, the slightly skewed seasonal temperature curves characterized by slow cooling rates in winter and rapid warming in early summer underline the fact that the rock surface temperature re-gime is strongly influenced by the snow cover at this snow-rich site. The slow cooling rates in winter are caused by early winter snow accumula-tion on rock ledges, which insulates the rock against cold air tempera-tures. In contrast, warming of the rock is rapid in early summer due to
Fig. 4. Pole plot on a 10° equal area net of dip and dip direction showing the orientation of extensive persistent fracture systems and their density distribution measured over the Gemsstock ridge between both ends of the borehole and along the position of the SRT measurements. Three dominant joint sets (S1–S3) can be distinguished, with their mean directions- and angles of dip.
Fig. 5. Seismic refraction tomography: a) P-wave velocity and b) ray density in the Gemsstock ridge in July 2014. The black line indicates the borehole position. In addition, aperture widths [cm] and dip angles [°] of selected fractures are highlighted.
efficient snowmelt runoff, warm summer air temperatures (Fig. 7b) and enhanced solar radiation. For comparison, the seasonal temperature curves measured in the horizontal Jungfrau East ridge borehole (3590 m asl) in steep bedrock with very little snow cover are perfectly sinusoidal and not skewed (PERMOS, 2013). The 3D influence of the ridge topography, as described byNoetzli and Gruber (2009)is also ap-parent at Gemsstock, with permanently positive temperatures reigning southwards of 17 m depth in the borehole. In the centre of the rock mass the highest temperatures are registered in winter and the lowest ones in summer, due to the thermal phase-lag with time and depth.
4.3. Thermal anomalies in the borehole
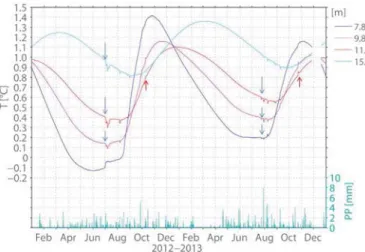
After registering a spring zero-curtain of several weeks during and after snow disappearance due to the effect of latent heat during thawing (Outcalt et al., 1990), the thermistors between 0 and 3.8 m depth all reg-istered a sharp rise in temperature over 0 °C at the end of June 2012 and at the end of July 2013 (Fig. 7c), which coincided with positive air tem-peratures (Fig. 7b) and thefirst long rainfalls after snowmelt (Fig. 7a). Rock temperatures then remained positive and thermal disturbances in the form of short-term (b60 h) and very slight (0.05–0.25 °C) but rapid temperature changes can be discerned yearly in the borehole be-tween July and October when there is no snow, yet never in the snow covered period. These thermal anomalies are registered by the thermis-tors located between the northern end of the borehole and 31.8 m depth but are best visible between 9.8 and 31.8 m (Figs. 6–8). The sporadic and short-term nature of the disturbances suggests a non-conductive form of heat transfer. Their timing coincides with summer precipitation events lasting longer than 12 h. These rainfall events can be discerned from the hourly automatic photographs taken at Gemsstock and mostly coincide with precipitation registered by the MeteoSwiss Gütsch weather station (Figs. 7a and8). The amount of precipitation required to trigger the thermal anomalies is unknown, as there is no liquid pre-cipitation measurement at Gemsstock. Nevertheless, the fact that rain-fall induces a thermal signal at the level of the borehole indicates that
the fractures are open to infiltration as soon as the snow cover has melted.
On the basis of the available information, we hypothesize that rain water penetrates the approximately 70° steep persistent joints in the northernflank of Gemsstock and flows down past the borehole below, briefly modifying the borehole temperatures, yet without having a last-ing thermal effect. The geometry of the ridge and of the joints (Figs. 3 and 4) probably explains why the thermistors located between 31.8 m and 36.8 m do not display these disturbances, as the rock mass here (and hence the borehole) are not intersected by joints. However, south of 36.8 m diurnal temperature variations strongly dominate any other signals.
It should be noted that the thermistors are located in a PVC tube with a wall thickness of 6 mm which has been grouted into the borehole (grout thickness is 43 mm). Thermal signals are therefore damped and probably do not accurately represent the actual temperature of the waterflowing past. Nevertheless, they do give an indication of the timing and the duration of the thermal disturbance and also show whether the water is warmer or colder than the surrounding rock. 4.4. Positive and negative thermal anomalies
There are no temperature measurements within the rock joints (between the level of the borehole and the rock surface) so the thermal regime is unknown there. However the borehole temperatures (Fig. 7c and d) and in particular the positive or negative nature of thermal sig-nals (i.e. increase or decrease in temperature, seeFig. 8) induced by in-filtrating rainwater may provide evidence for the presence or absence of permafrost in the rocks bounding the fractures— or point towards the presence of some ice in the joints.
During both summers 2012 and 2013, borehole thermistors at 5.8, 9.8 and 11.8 m registered sporadic cooling during precipitation events in July and August and then sporadic warming during rainfall from September onwards (9.8 and 11.8 m are shown inFig. 8). This may indicate the presence of frozen rock (or ephemeral fracture ice) in July and August, which then thawed in late summer. In contrast, all
Fig. 6. Contour plot of borehole temperatures (see colour scale) measured at two-hour intervals at Gemsstock between 1 January 2012 and 31 December 2013 (mm·yy). The thin black curve represents the 0 °C isotherm. The vertical black lines delimit the hydrological years. The top of thefigure represents the northern end of the borehole and the depths on the y axis are the horizontal distances from the northern end of the borehole. The positions of individual thermistors are shown by the horizontal dashes to the right of the y axis.
thermistors between 15.8 and 31.8 m always registered cooling during precipitation events, throughout the summer (15.8 m is shown in
Fig. 8). This could be due to the presence of ice in joints or pore ice in the rock, over which the rainwater runs and cools before reaching the borehole. Similar phenomena related to advective heat transport by waterflowing through rock clefts were observed by Hasler et al. (2011a)in laboratory experiments.
In July 2012 thermal evidence of ice was registered at 7.8 m depth in the borehole (Fig. 8): the rock temperature remained just below 0 °C from the beginning of July until mid-August 2012 and rainfall induced disturbances registered by other thermistors were not registered here (Figs. 7c and8). This zero-curtain is likely to have been caused by the presence of an ice plug in the joint at the level of the borehole. Such
ice front propagation into open joints was for example observed by
Matsuoka (2001). During the snow-rich winter 2012–2013 and spring 2013 temperatures at 7.8 m depth remained positive and there is no ev-idence of ice formation there (Fig. 8).
4.5. Snowmelt
The timing and duration of snowmelt in the rock wall can be inferred from near-surface rock temperatures measured by the iButtons at 0.1 m depth (Fig. 7b), by near-surface borehole temperature measurements (Fig. 7c) and from the time-lapse photographs. Various snowmelt runoff events during periods of positive air temperature were registered under the snow cover by the thermistors at−0.2 and 0.05 m at the northern end of the borehole from the 28th March onwards in 2012 and from 14th April onwards in 2013 (Fig. 7c, dashed blue ellipses). They were characterized by sudden, short-term increases in temperature. This led to the thermal inversion of near-surface temperatures, and culminated in a spring zero-curtain lasting around 4 weeks in 2012 and 6 weeks in 2013. As it is unlikely that there was enough water/ice contained in the bare rock to induce a long-lasting spring zero-curtain triggered by latent heat exchange, these temperature signals indicate that melt waterflowed past the borehole at the interface between the rock sur-face and the snow cover and refroze there, forming a layer of basal ice. This was confirmed by snow pit measurements. The time-lapse photo-graphs indicate that the snow cover was intact during these periods.
The subsequent thermal anomalies registered in the borehole from the end of June 2012 and from the end of July 2013 onwards all occurred when the near-surface borehole rock temperature measurements were positive and no snow was visible on the photographs. Indeed, there was no thermal evidence of infiltration at any depth along the borehole dur-ing snowmelt, which indicates that snowmelt runoff did not penetrate the joints.
Snow water equivalent (SWE), the amount of water potentially available during snowmelt, is the product of snow depth (HS) and bulk density (ρb). Although snow density was measured in winter at Gemsstock in snow pits using an aluminium snow cylinder, it was im-possible to apply this method in spring, due to the hardness of the melt-crusts and the presence of thick ice layers which the cylinder could not penetrate. Measurements made earlier in the winter cannot realistically be used to estimate SWE available for melt in spring, as the bulk density of the snow cover increases in the course of the winter due to snow compaction caused by settling and ripening (Jonas et al., 2009). However, using snow depths measured by laser scanning in
Fig. 7. a) Snow depth (HS) at the Gemsstock AWS and precipitation (PP) at the AWS Gütsch for the period 2012–2013; b) air temperature at the Gemsstock AWS (TA) and near-surface rock temperatures (0.1 m depth) measured by iButtons N3 and N5 (NSRT); c) borehole temperatures between−0.2 and 7.8 m depth; dashed blue ellipses highlight periods with short-term increases in temperature caused by snowmelt water flowing at the snow-rock interface and freezing to form a basal ice layer. d) Borehole temperatures between 9.8 and 37.8 m depth.
Fig. 8. Detailed view of borehole temperatures measured at 7.8, 9.8, 11.8 and 15.8 m depth (left y axis). Precipitation (PP) at the AWS Gütsch (right y axis), both for the period 2012–2013. A few examples of negative (blue arrows) and positive (red arrows) thermal anomalies in summer are highlighted.
June 2013, a reasonable estimate of the potential snow water equivalent could be obtained using a simple yet efficient method developed by
Jonas et al. (2009).
Eq.(1)allows the determination of snow bulk densities (ρbmod) and
thus convert measured snow depth values (HSobs) into snow water
equivalents (SWEmod) with Eq.(2)(Jonas et al., 2009). Look-up tables
in the above-mentioned publication allow the accounting of the factors with the most notable influence on snow density, i.e. the month (ɑ), the elevation (b) and the snow-climate region in the Swiss Alps (offsetreg).
ρbmod¼ α ∙HSobsþ b þ offsetreg ð1Þ
SWEmod¼ HSobs∙ρbmod: ð2Þ
Using an average measured snow depth of 2 m on the Northernflank of Gemsstock in June 2013, and taking into account the fact that the site is above 2000 m asl and is in the Central Swiss Alps, a SWE of around 400 kg m−2or 400 mm is obtained. This amount of water would not go undetected if it infiltrated the joints during the snowmelt period. Small amounts may infiltrate joint apertures and refreeze there, as was observed byMatsuoka (2001)— but we have no direct evidence of this at Gemsstock as there are no instruments in the joint apertures. 4.6. Vapour transport in joints
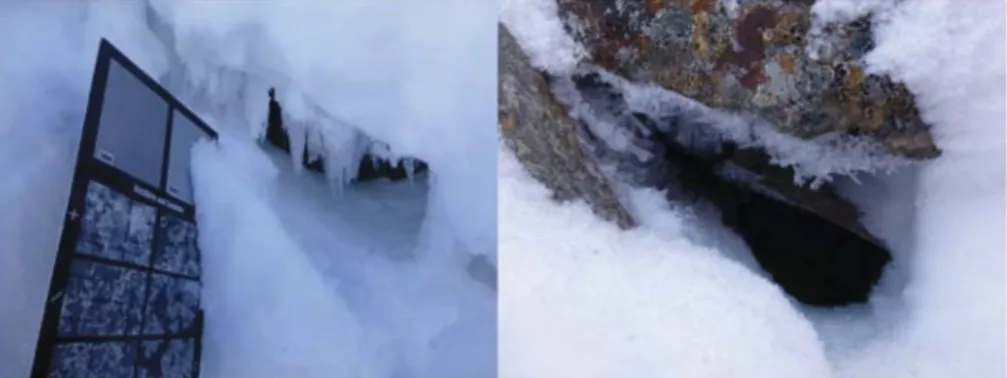
The presence of well-developed cavity hoar under the snow at sev-eral joint apertures (Fig. 9) provides evidence that the joints are open in mid-winter (January/February). Cavity or crevasse hoar forms when vapour is transported along a temperature gradient in cavities and con-denses against colder surfaces (Fierz et al., 2009). The rock surface tem-peratures at the base of the snow cover were typically−4 to −6 °C in mid-winter, whilst the rock temperatures within the rock mass at the level of the borehole were between−1.5 and +2 °C, thus forming a positive temperature gradient. A lattice of hoar gradually formed across the joint apertures. This may have provided a matrix supporting the for-mation of a basal ice layer across the joints during snowmelt.
4.7. Basal ice layer
The snow pit measurements provide an explanation for the absence of significant snowmelt infiltration into joints in the North facing rock slope during the main snowmelt period. In mid-winter the snowpack on the northern shadyflank of Gemsstock typically consists of strongly faceted and poorly consolidated snow crystals. From early April on-wards, under the influence of rising air temperatures the snow mainly comprises melt forms and hard melt-crusts. In addition, a continuous 10–20 cm thick layer of basal ice forms between the base of the snow pack and the rock surface, as was observed with in-situ snow pits (Fig. 10). This basal ice layer forms when snowmelt water emanating
from the increasingly sunnier areas with positive rock temperatures at the top of the ridgeflows under the snow and refreezes against the colder rock below. Borehole temperatures at 0.05 m depth (Fig. 7c, blue ellipses) indicate the timing of melt water infiltration events (short and marked rises in temperature) and the period during which the basal ice layer was present (temperatures remaining just below 0 °C for several weeks). Although basal ice layers have been observed in Arctic regions, as mentioned above (e.g.Woo et al. (1982)), to our knowledge there is no literature on them in the Alps.
InFig. 7b, rock temperatures measured at 10 cm depth near the top of the ridge at the snow-free point N3 and further down under the snow cover at the point N5 are shown. Melt waterflowing under the snow cover caused rock temperatures at N5 to rise rapidly on April 14th 2013 and then plateau out at 0 °C until the end of June 2013 due to latent heat release induced by basal ice formation on the rock surface. This basal ice, which also covers the joint apertures, effectively prevented the infiltration of potentially large quantities of snowmelt water, as was observed byWoo et al. (1982)in the Arctic. The same thermal phenomenon was registered simultaneously by all other iButtons located downslope from N5, with variations in the termination of the zero-curtain related to the heterogeneous snow distribution and resulting differences in timing of snow disappearance (Haberkorn et al., 2015b). A thick basal ice layer also forms on the South facing rock slope of Gemsstock, yet much earlier in the winter, due to the strong influence of solar radiation on this steeply inclined dip slope.
Fig. 9. Cavity hoar in joint apertures under a thick snowpack in mid-winter in the North facing rock wall at Gemsstock. The snow crystal card on the left is 20 cm long. Photographs: M. Phillips.
Fig. 10. Thick basal ice layer at the snow–rock interface in the North facing rock wall of Gemsstock in May 2013. The shovel blade on the left is 26.5 cm long.
4.8. Mechanical implications of water infiltration and air circulation in open fractures
Short-term instability of permafrost rocks is commonly attributed to changes in shear stress induced by water and ice-pressure (Hasler et al., 2012; Krautblatter et al., 2013). In the case of the Gemsstock ridge at the lower fringe of permafrost, we have no evidence for perched groundwa-ter levels, as fractures are not permanentlyfilled with ice. As a conse-quence, the infiltration of rainwater in summer does not have a lasting thermal effect at the level of the borehole, implying that water does not cause a water pressure effect by accumulating. In addition, the basal ice layer at the snow-rock interface prevents significant water in-filtration from snowmelt in spring — in contrast to observations at the Åknes rockslide for example, where snowmelt precedes acceleration phases (Oppikofer et al., 2009) but where the back fracture is 1.6 m wide (Ganerød et al., 2008) and therefore much wider than the joints at Gemsstock.
Ventilation of fractures may occur in winter before the fractures are plugged by the basal ice layer, and this could enhance thermal stress along the cooling fracture network (Gischig et al., 2011) due to temper-ature contrasts between the rock mass and the fractures. Sudden cryostatic pressure could develop concurrently to thefirst water infil-tration into the cooled fracture system in summer, favoured by the thermal inertia of frozen rock around the fractures. However, to prove such transient effects and to test these hypotheses, long-term crack opening data is required (crack opening is currently being measured at Gemsstock but will be published elsewhere, when more data is available).
5. Conclusions
Geological observations at Gemsstock allowed the determination of rock fracture distribution and geometry. The presence of a domi-nant series of approximately 70° steep parallel joints dipping south-eastwards from the North face was confirmed by SRT measurements. These give an overview of the internal structure of the rock mass and its anisotropy.
Thermal signals measured in a 40 m horizontal borehole intersecting the joints at the base of the Gemsstock ridge indicate that summer pre-cipitation penetrates the joints, confirming that they are open. Further evidence that the fractures are open is provided by the formation of cav-ity hoar in their apertures under the snow cover in January/February.
The borehole temperatures indicate that there is no infiltration of snowmelt water into the open rock fractures in spring, despite high snow water equivalent values. This is attributed to the presence of a thick basal ice layer under the snow cover during snowmelt, which ef-fectively‘plugs’ the joint apertures and promotes efficient downslope snowmelt runoff. We have observed the same phenomenon in other rock walls investigated in the framework of this project.
The amount of water infiltrating the fractures in summer is not known and thermal signals registered in borehole are damped— it is therefore difficult to quantify the heat exchange occurring between theflowing water and the rock. Temperature measurements within fractures would be useful to obtain the required information.
The importance of spring snowmelt infiltration on rock wall stability is often underlined in the literature, but should be considered with care as it is probably highly site-specific. Basal ice layer formation preventing snowmelt infiltration into open joints is likely at sites with cold rock surfaces and narrow joint apertures. Joint aperture size is thus a deter-mining factor, as it probably determines whether a continuous basal ice layer can form across apertures or not.
This study has shown that temperature measurements near the rock surface and at depth, as well as in-situ snow cover investigations are necessary to determine whether snowmelt is important for rock slope stability or not.
Acknowledgements
Carlo Danioth and his colleagues at Gemsstock (SkiArena Andermatt-Sedrun) are thanked for their valuable support withfield lo-gistics. The authors acknowledge Charles Fierz, Michael Lehning, Adrien Gaudard, Christoph Marty and Jeannette Noetzli for their useful input. We thank the SLF electronics team and mechanical workshop for their excellent work on the instrumentation at Gemsstock. Fieldwork carried out by Christian Querner, Christian Halla, Hermann Reinartz and Philipp Mamot is highly appreciated. This study was carried out in the context of the DACH Lead Agency and jointly funded by the Swiss National Sci-ence Foundation (SNF) (project no. 200021E-135531) and the Deutsche Forschungsgemeinschaft (DFG) (project no. KR3912/1-1). The editor Jürg Schweizer and three anonymous reviewers are thanked for their constructive suggestions.
References
Barton, N., 2007.Rock Quality, Seismic Velocity, Attenuation and Anisotropy. Routledge, London, Leiden, New York.
Blikra, L.H., Christiansen, H.H., 2014. Afield-based model of permafrost-controlled rockslide deformation in northern Norway. Geomorphology 208, 34–49.http://dx. doi.org/10.1016/j.geomorph.2013.11.014.
Bodvarsson, G., 1969. On the temperature of waterflowing through fractures. J. Geophys. Res. 74 (8), 1987–1992.http://dx.doi.org/10.1029/JB074i008p01987.
Bommer, C., Phillips, M., Arenson, L.U., 2010. Practical recommendations for planning, constructing and maintaining infrastructure in mountain permafrost. Permafr. Periglac. Process. 21, 97–104.http://dx.doi.org/10.1002/ppp.679.
Draebing, D., Krautblatter, M., 2012. P-wave velocity changes in freezing hard low-porosity rocks: a laboratory-based time-average model. Cryosphere 6 (1), 1163–1174.http:// dx.doi.org/10.5194/tcd-6-793-2012.
Draebing, D., Krautblatter, M., Dikau, R., 2014. Interaction of thermal and mechanical pro-cesses in steep permafrost rock walls: a conceptual approach. Geomorphology 226, 226–235.http://dx.doi.org/10.1016/j.geomorph.2014.08.009.
Fierz, C., Armstrong, R.L., Durand, Y., Etchevers, P., Greene, E., McClung, D.M., Nishimura, K., Satyawali, P.K., Sokratov, S.A., 2009.The International Classification of Seasonal Snow on the Ground. I.S. UNESCO, Paris.
Fischer, L., Kääb, A., Huggel, C., Noetzli, J., 2006.Geology, glacier retreat and permafrost degradation as controlling factors of slope instabilities in a high-mountain rock wall: the Monte Rosa east face. Nat. Hazards Earth Syst. Sci. 6 (5), 761–772.
Ganerød, G.V., Grøneng, G., Rønning, J.S., Dalsegg, E., Elvebakk, H., Tønnesen, J.F., Kveldsvik, V., Eiken, T., Blikra, L.H., Braathen, A., 2008. Geological model of the Åknes rockslide, western Norway. Eng. Geol. 102 (1–2), 1–18.http://dx.doi.org/10. 1016/j.enggeo.2008.01.018.
Gischig, V.S., Moore, J.R., Evans, K.F., Amann, F., Loew, S., 2011. Thermomechanical forcing of deep rock slope deformation: 2. The Randa rock slope instability. J. Geophys. Res. Earth Surf. 116 (F4), F04011.http://dx.doi.org/10.1029/2011jf002007.
Grohmann, C.H., Campanha, G.A.C., 2010.OpenStereo: open source, cross-platform soft-ware for structural geology analysis. AGU 2010 Fall Meeting, San Francisco, CA (Abstracts).
Gruber, S., Haeberli, W., 2007. Permafrost in steep bedrock slopes and its temperature-related destabilization following climate change. J. Geophys. Res. 112.http://dx.doi. org/10.1029/2006JF000547.
Gruber, S., Hoelzle, M., Haeberli, W., 2004.Rock-wall temperatures in the Alps: modelling their topographic distribution and regional differences. Permafr. Periglac. Process. 15, 229–307.
Haberkorn, A., Hoelzle, M., Phillips, M., Kenner, R., 2015a. Snow as a driving factor of rock surface temperatures in steep rough rock walls. Cold Reg. Sci. Technol. 118, 64–75.
http://dx.doi.org/10.1016/j.coldregions.2015.06.013.
Haberkorn, A., Phillips, M., Kenner, R., Rhyner, H., Bavay, M., Galos, S.P., Hoelzle, M., 2015b. Thermal regime of rock and its relation to snow cover in steep alpine rock walls: Gemsstock, Central Swiss Alps. Geogr. Ann. Ser. A Phys. Geogr.http://dx.doi.org/10. 1111/geoa.12101.
Hasler, A., Gruber, S., Font, M., Dubois, A., 2011a. Advective heat transport in frozen rock clefts: conceptual model, laboratory experiments and numerical simulation. Permafr. Periglac. Process. 22, 378–389.http://dx.doi.org/10.1002/ppp.737.
Hasler, A., Gruber, S., Haeberli, W., 2011b. Temperature variability and offset in steep al-pine rock and ice faces. Cryosphere 5 (4), 977–988. http://dx.doi.org/10.5194/tc-5-977-2011.
Hasler, A., Gruber, S., Beutel, J., 2012. Kinematics of steep bedrock permafrost. J. Geophys. Res. Earth Surf. 117 (F1), F01016.http://dx.doi.org/10.1029/2011jf001981. Hauck, C., Vonder Mühll, D., 2003.Evaluation of geophysical techniques for application in
mountain permafrost studies. Z. Geomorph. N. F. 132, 161–190 (Suppl.).
Hauck, C., Isaksen, K., Muhll, D.V., Sollid, J.L., 2004.Geophysical surveys designed to delin-eate the altitudinal limit of mountain permafrost: an example from Jotunheimen, Norway. Permafr. Periglac. Process. 15, 191–205.
Heincke, B., Maurer, H., Green, A.G., Willenberg, H., Spillmann, T., Burlini, L., 2006. Charac-terizing an unstable mountain slope using shallow 2D and 3D seismic tomography. Geophysics 71 (6), B241–B256.http://dx.doi.org/10.1190/1.2338823.
Hilbich, C., 2010. Time-lapse refraction seismic tomography for the detection of ground ice degradation. Cryosphere 4 (3), 243–259. http://dx.doi.org/10.5194/tc-4-243-2010.
Huggel, C., 2008. Recent extreme slope failures in glacial environments: effects of thermal perturbation. Quat. Sci. Rev. 28 (11–12), 1119–1130.http://dx.doi.org/10.1016/j. quascirev.2008.06.007.
Jonas, T., Marty, C., Magnusson, J., 2009. Estimating the snow water equivalent from snow depth measurements in the Swiss Alps. J. Hydrol. 378, 161–167.http://dx.doi.org/10. 1016/j.hydrol.2009.9.021.
Kane, D.L., Hinkel, K.M., Goering, D.J., Hinzman, L.D., Outcalt, S.I., 2001.Non-conductive heat transfer associated with frozen soils. Glob. Planet. Chang. 29, 275–292.
Kenner, R., Phillips, M., Danioth, C., Denier, C., Zgraggen, A., 2011. Investigation of rock and ice loss in a recently deglaciated mountain rock wall using terrestrial laser scanning: Gemsstock, Swiss Alps. Cold Reg. Sci. Technol. 67, 157–164.http://dx.doi.org/10. 1016/j.coldregions.2011.04.006.
Kneisel, C., Hauck, C., 2003.Multi-method geophysical investigation of a sporadic perma-frost occurrence. Z. Geomorphol. Suppl. 132, 145–159.
Krautblatter, M., Draebing, D., 2014. Pseudo 3D-P-wave refraction seismic monitoring of permafrost in steep unstable bedrock. J. Geophys. Res. Earth Surf. 119, 287–299.
http://dx.doi.org/10.1002/2012JF002638.
Krautblatter, M., Huggel, C., Deline, P., Hasler, A., 2012. Research perspectives on unstable high-alpine bedrock permafrost: measurement, modelling and process understand-ing. Permafr. Periglac. Process. 23, 80–88.http://dx.doi.org/10.1002/ppp.740. Krautblatter, M., Funk, D., Günzel, F.K., 2013. Why permafrost rocks become unstable: a
rock–ice-mechanical model in time and space. Earth Surf. Process. Landf. 38 (8), 876–887.http://dx.doi.org/10.1002/esp.3374.
Leary, P., Henyey, T., 1985. Anisotropy and fracture zones about a geothermal well from P-wave velocity profiles. Geophysics 50 (1), 25–36.http://dx.doi.org/10.1190/1. 1441833.
Lo, T.W., Coyner, K.B., Toksoz, M.N., 1986.Experimental-determination of elastic-anisotropy of Berea sandstone, Chicopee shale, and Chelmsford granite. Geophysics 51 (1), 164–171.
Magnin, F., Deline, P., Ravanel, L., Noetzli, J., Pogliotti, P., 2015. Thermal characteristics of permafrost in the steep alpine rock walls of the Aiguille du Midi (Mont Blanc massif, 3842 m a.s.l). Cryosphere 9, 109–121.http://dx.doi.org/10.5194/tc-9-109-2015. Marsh, P., 2006.Water Flow Through Snow and Firn, Encyclopedia of Hydrological
Sci-ences. John Wiley & Sons, Ltd.
Matsuoka, N., 2001. Direct observation of frost wedging in alpine bedrock. Earth Surf. Pro-cess. Landf. 26 (6), 601–614.http://dx.doi.org/10.1002/esp.208.
Maurer, H., Hauck, C., 2007.Instruments and methods— geophysical imaging of alpine rock glaciers. J. Glaciol. 53 (180), 110–120.
Moore, J.R., Gischig, V., Katterbach, M., Loew, S., 2011. Air circulation in deep fractures and the temperaturefield of an alpine rock slope. Earth Surf. Process. Landf. 36 (15), 1985–1996.http://dx.doi.org/10.1002/esp.2217.
Murton, J.B., Peterson, R., Ozouf, J.-C., 2006. Bedrock fracture by ice segregation in cold re-gions. Science 314 (5802), 1127–1129.http://dx.doi.org/10.1126/science.1132127. Musil, M., Maurer, H., Green, A.G., Horstmeyer, H., Nitsche, F., Vonder Mühll, D.,
Springman, S., 2002.Shallow seismic surveying of an alpine rock glacier. Geophysics 67 (6), 1701–1710.
Noetzli, J., Gruber, S., 2009.Transient thermal effects in alpine permafrost. Cryosphere 3 (1), 85–99.
Nötzli, J., Gruber, S., von Poschinger, A., 2010. Modellierung und messung von permafrosttemperaturen im gipfelgrat der Zugspitze, Deutschland. Geogr. Helv. 65 (2), 113–123.
Nur, A., Simmons, G., 1969.Effect of saturation on velocity in low porosity rocks. Earth Planet. Sci. Lett. 7 (2), 183–193.
Oppikofer, T., Jaboyedoff, M., Blikra, L., Derron, M.-H., Metzger, R., 2009.Characterization and monitoring of the Åknes rockslide using terrestrial laser scanning. Nat. Hazards Earth Syst. Sci. 9, 1003–1019.
Outcalt, S.I., Nelson, F.E., Hinkel, K.M., 1990.The zero-curtain effect: heat and mass trans-fer across an isothermal region in freezing soil. Water Resour. Res. 26 (7), 1509–1516.
PERMOS, 2013.Permafrost in Switzerland 2008/2009 and 2009/2010. University of Zurich, C.C.o.t.S.A.o. Sciences, Zurich.
Querner, C., 2013. Stabilität von Festgestein in den Schweizer Alpen. Diploma Thesis, University of Bonn, unpublished.
Rist, A., Phillips, M., 2005.First results of investigations on hydrothermal processes within the active layer above alpine permafrost in steep terrain. Nor. Geogr. Tidsskr. 59, 177–183.
Sandmeier, K.J., 2012.REFLEXW Version 7.0 Manual. Sandmeier-Geo, Karlsruhe.
Schmid, M.O., Gubler, S., Fiddes, J., Gruber, S., 2012. Inferring snowpack ripening and melt-out from distributed measurements of near-surface ground temperatures. Cryosphere 6 (5), 1127–1139.http://dx.doi.org/10.5194/tc-6-1127-2012. Stewart, I.T., 2009. Changes in snowpack and snowmelt runoff for key mountain regions.
Hydrol. Process. 23 (1), 78–94.http://dx.doi.org/10.1002/hyp.7128.
Stiegler, C., Rode, M., Sass, O., Otto, J.-C., 2014. An undercooled scree slope detected by geophysical investigations in sporadic permafrost below 1000 m asl, Central Austria. Permafr. Periglac. Process. 25 (3), 194–207.http://dx.doi.org/10.1002/ppp. 1813.
Stock, G.M., Collins, B.D., Santaniello, D.J., Zimmer, V.L., Wieczorek, G.F., Snyder, J.B., 2013.
Historical Rock Falls in Yosemite National Park, California (1857–2011).
Thomsen, L., 1986.Weak elastic-anisotropy. Geophysics 51 (10), 1954–1966.
Timur, A., 1968. Velocity of compressional waves in porous media at permafrost temper-atures. Geophysics 33 (4), 584–595.http://dx.doi.org/10.1190/1.1439954. Wang, Z.J., 2001.Fundamentals of seismic rock physics. Geophysics 66 (2), 398–412.
Wegmann, M., Gudmundsson, G., Haeberli, W., 1998.Permafrost changes in rock walls and the retreat of alpine glaciers: a thermal modelling approach. Permafr. Periglac. Process. 9, 23–33.
Wieczorek, G.F., Jäger, S., 1996. Triggering mechanisms and depositional rates of postgla-cial slope-movement processes in the Yosemite Valley, California. Geomorphology 15 (1), 17–31.http://dx.doi.org/10.1016/0169-555X(95)00112-I.
Wirz, V., Schirmer, M., Gruber, S., Lehning, M., 2011. Spatio-temporal measurements and analysis of snow depth in a rock face. Cryosphere 5, 893–905.http://dx.doi.org/10. 5194/tc-5-893-2011.
Woo, M.-k., Heron, R., 1981. Occurrence of ice layers at the base of high Arctic snowpacks. Arct. Alp. Res. 13 (2), 225–230.http://dx.doi.org/10.2307/1551198.
Woo, M.-K., Heron, R., Marsh, P., 1982.Basal ice in high Arctic snowpacks. Arct. Alp. Res. 14 (3), 251–260.
Zenklusen Mutter, E., Blanchet, J., Phillips, M., 2010. Analysis of ground temperature trends in alpine permafrost using generalized least squares. J. Geophys. Res. 115, F004009.http://dx.doi.org/10.1029/2009JF001648.