HAL Id: hal-01478299
https://hal-univ-bourgogne.archives-ouvertes.fr/hal-01478299
Submitted on 6 Jul 2017
HAL is a multi-disciplinary open access
archive for the deposit and dissemination of
sci-entific research documents, whether they are
pub-lished or not. The documents may come from
teaching and research institutions in France or
abroad, or from public or private research centers.
L’archive ouverte pluridisciplinaire HAL, est
destinée au dépôt et à la diffusion de documents
scientifiques de niveau recherche, publiés ou non,
émanant des établissements d’enseignement et de
recherche français ou étrangers, des laboratoires
publics ou privés.
Distributed under a Creative Commons Attribution| 4.0 International License
Discovering the Discriminating Power in Patient Test
Features Using Visual Analytics: A Case Study in
Parkinson’s Disease
Panagiotis Moschonas, Elias Kalamaras, Stavros Papadopoulos, Anastasios
Drosou, Konstantinos Votis, Sevasti Bostantjopoulou, Zoe Katsarou,
Charalambos Papaxanthis, Vassilia Hatzitaki, Dimitrios Tzovaras
To cite this version:
Panagiotis Moschonas, Elias Kalamaras, Stavros Papadopoulos, Anastasios Drosou, Konstantinos
Vo-tis, et al.. Discovering the Discriminating Power in Patient Test Features Using Visual Analytics:
A Case Study in Parkinson’s Disease. 12th IFIP International Conference on Artificial Intelligence
Applications and Innovations (AIAI), Sep 2016, Thessaloniki, Greece. pp.600-610,
�10.1007/978-3-319-44944-9_53�. �hal-01478299�
Discovering the Discriminating Power in
Patient Test Features using Visual Analytics:
A Case Study in Parkinson’s Disease
Panagiotis Moschonas1, Elias Kalamaras1, Stavros Papadopoulos1, Anastasios
Drosou1, Konstantinos Votis1, Sevasti Bostantjopoulou2, Zoe Katsarou2,
Charalambos Papaxanthis3, Vassilia Hatzitaki4, and Dimitrios Tzovaras1
1 Information Technologies Institute, Centre for Research and Technology Hellas, Thessaloniki, Greece,
{moschona, kalamar, spap, drosou, kvotis, Dimitrios.Tzovaras}@iti.gr 2
Department of Neurology, Aristotle University of Thessaloniki, Greece, 3
Universit de Bourgogne, UFR STAPS, Campus Universitaire, Dijon, France, 4 Department of Physical Education and Sports Sciences, Aristotle University of
Thessaloniki, Greece.
Abstract. This paper presents a novel methodology for selecting the most representative features for identifying the presence of the Parkin-son’s Disease (PD). The proposed methodology is based on interactive visual analytics based on multi-objective optimisation. The implemented tool processes and visualises the information extracted via performing a typical line-tracking test using a tablet device. Such output information includes several modalities, such as position, velocity, dynamics, etc. Pre-liminary results depict that the implemented visual analytics technique has a very high potential in discriminating the PD patients from healthy individuals and thus, it can be used for the identification of the best feature type which is representative of the disease presence.
Keywords: Parkinson’s Disease, Visual Analytics, Multi-objective Op-timisation, Feature Discrimination Power
1
Introduction
Parkinson’s disease (PD) is a degenerative disorder of the central nervous sys-tem that is mainly affecting the motor syssys-tem. Its most obvious symptoms are movement-related, including shaking, rigidity, slowness of movement and diffi-culty with walking and gait [8]. Tracking in a correct way the progress of the disease is crucial for the quality of patient’s life, thus the need of an objective and consistent way of measuring the patient motor dexterity is essential.
There are several established scales for measuring the progress of the disease. The Unified Parkinson’s Disease Rating Scale [16] is the most commonly used metric for clinical study and is used as a severity rating method. An older scaling method known as the Hoehn and Yahr scale [8], and a similar scale known as the Modified Hoehn and Yahr scale, have also been commonly used. The later
defines five basic stages of progression. These scale measurement are derived from qualitative questionnaires asked by doctors, thus they enclose the danger of subjectivity in their results: different clinical examinations may produce different answers. Additionally, the repetition period of such solutions are in the class of several months.
Electronic devices from various domains have been also used for measuring the PD progress. The current market offers a variety of wristbands capable of measuring the tremor [6]. However, these are used for complimentary assessment to the typical clinical examination. Moreover, their effectiveness is high when the tremor is present to the patient arm, but their efficiency is not guaranteed in early stages of the disease. An increasing set of smartphone and tablet PD applications has arisen in the market. Despite most of them are used for scheduling, there is a small subset which makes use of tests for tracking the progress of the disease. In most of these tests, the user has to use his/her hand to track a line or a shape and the software extract metrics representative of the current state. Factors such as velocity, target deviation, reaction time, minimum jerk, are recorded and compared to the ones measured from previous states. The results are displayed in curves, allowing the user to track the PD progress.
However, even providing the tests, there is still the matter of how the program is going to correlate the captured information with the disease presence on the individual. Comparing the velocity or deviation profiles per day measurements is not enough as it could not be representative of the specific patient symp-toms [18]. For such reasons, proper visualisation capable of identifying which of the extracted features encapsulate and discriminate better the examined person status is needed. In this paper we apply a novel multi-objective visualisation for identifying which of the measured quantities are best for discriminating the presence of the Parkinson’s Disease.
1.1 Relevant work
Information visualization concerns the use of interactive computer graphics to get insight into large amounts of abstract data, such as multivariate, hierarchical and network data [23]. Conventional visualization techniques, such as bar-charts, pie-charts, and line-charts, are useful for the depiction of information of a higher level, but fail to depict large and complex data sets in detail. Therefore, and in order to enable the easy extraction of patterns, trends and outliers, a vari-ety of novel visualization methods are continuously being developed for specific applications, e.g. [22][1][4].
Their ability to provide insight into large amounts of complex data make visual analytics techniques especially useful for healthcare and biomedical ap-plications. This has resulted in numerous existing methods and tools which uti-lize various visualization types and user interaction levels [21][10]. Recent works have employed visual properties such as color and position [15][24] or animation [17], in order to visually encode patient information, group patients with similar characteristics together and discriminate between different events. Visual queries
3
have also been utilized in combination with pattern mining and interactive vi-sualization, in order to explore large datasets more efficiently.
The continuous development in the field of information visualization has led to a variety of new methods and techniques that enable people to understand the phenomena behind large amounts of data, and which increasingly find their way to Health and real-life applications. However, and due to their specialized nature, many of these methods have limited use outside their initially targeted application. For the majority of methods, data are considered to be homogenous and in most cases just one or two types of data are supported. In addition, data are assumed to come from a single source and to be clean and exact, whereas noisy, polluted, uncertain, and missing data are rarely dealt with. Scalability is another common issue, since it is typically limited to thousands of elements. Therefore, if one of the above assumptions is violated, standard methods from information visualization fall short, and a need for new representations arises.
Since several attributes are usually available for each patient, such as age, speed of task completion, acceleration, etc., they can be combined to provide better insights in the data. The combination of multiple sources of information for classification, clustering, visualization, etc. has generally been handled by multimodal fusion methods [2]. A first category of fusion methods simultaneously combine characteristics of all modalities, e.g. through weighted sums. In [20], a graph is constructed for each of multiple attributes and the graph Laplacians are then fused. Graph-based techniques are also used in [13], which employs Multiple Kernel Learning [9] for fusion. A second category are methods that utilize information of one modality to assist learning in another modality in an iterative manner, such as [3] and [14].
A different principle is followed by works such as [11][12], where visualiza-tion of each modality is formulated as an optimisavisualiza-tion problem and then multi-objective optimisation techniques [7][5] are utilized to simultaneously optimize all objectives and resulting in a set of Pareto-optimal solutions, instead of one. Although such methods demonstrate the effectiveness of multimodal fusion, for a wide range of applications, they have not been adopted for visualization of healthcare data, where the combination of multiple modalities may reveal im-portant patient behavioural characteristics that can assist decision making. In this respect, this paper presents an application of the techniques presented in [11][12], in the task of clustering patients according to multiple attributes.
2
Applied Methodology
A set of features is first extracted by performing a simple test on a tablet device. During the test a vertical line appears at random position, while the subject has to track it as fast as possible with a stylus pen. After the test, a set of features is extracted and passed into the visual analytics engine.
The extracted features are the following: a) deviation in x axis from target, i.e. position in pixels, b) velocity, c) acceleration, and d) simulated muscle ac-tivation, extracted using methodology described in [19]. These features are
nor-malised in the time component. This is achieved by splitting the whole recording into events which start when the target line changes its position. Then a repre-sentative signal of each feature type is extracted by averaging the event signals. The resulted signals are fed to the Multi-objective visual analytics engine in order to analyse the discriminating power of each of the feature types.
2.1 Multi-objective Visualisation
The feature extraction procedure results in feature vectors describing various characteristics of a patient, such as age, speed of task completion, acceleration. Each of these types of types of features determines a specific type of similarities and dissimilarities among the users. An adequate visualisation of the patient data should be able to visualize these similarities. A common and straightfor-ward visualisation scheme is to consider each patient as a point on the screen and using the relative position of the patients to denote similarity, by placing similar patients close to each other and dissimilar ones away from each other. However, the presence of multiple notions of similarity, due to the multiple types of features extracted from a single patient, renders the problem of visualizing similarities non-trivial, since many types of similarity must be visualized simul-taneously, or some kind of compromise among the various feature types should be considered. In this respect, the multi-objective visualisation method of [11] is used hereby, which exactly considers multiple notions of similarity. The method is briefly presented in this section. The method proceeds by first considering each feature type separately, formulating visualisation as a single-objective op-timisation problem, and then combining multiple objectives in a multi-objective optimisation setting.
Visualisation of a single feature type: Let O = {O1, O2, . . . , ON} denote a
set of N patients. Each patient Oi is itself a set of M feature vectors:
Oi= {oi,1, oi,2, . . . , oi,M}, oi,m∈ RDm.
Each feature vector oi,m is a vector of dimension Dm, which is specific for the
m-th feature type.
Considering just a single feature type m, a distance function dm: RDm× RDm → R
is used to calculate the distance between the feature vectors of two patients. Hereby, the L1 distance measure is used:
dm(oi,m, oj,m) = Dm
X
k=1
|oi,m,k− oj,m,k| ,
where oi,m,k is the k-th component of vector oi,m. The distance measure is
5
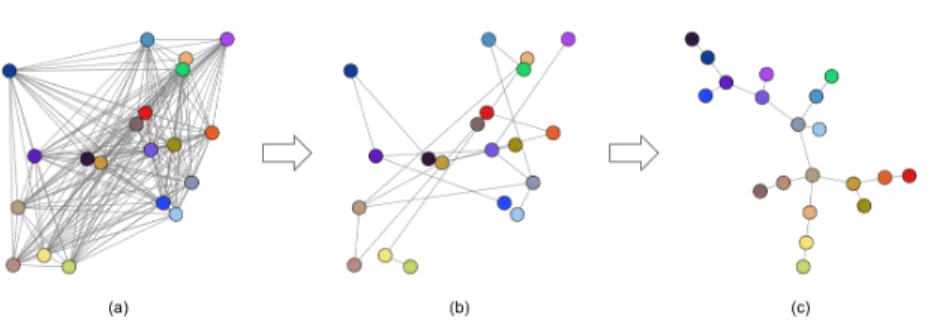
Fig. 1. Example of the potential objective minimization. (a) The points and their similarities form a complete graph. The graph’s vertices are placed at random positions. (b) The minimum spanning tree of the graph is calculated. (c) By minimizing the potential objective, the vertices are moved so that the tree’s structure is apparent.
where each patient Oi ∈ O is represented by a vertex and there is an edge
{Oi, Oj} ∈ Em between every pair of patients, weighted by the corresponding
distance between them. As a further step, the minimum spanning tree (MST), Tm(O, Em0 ), Em0 ⊂ Em, of the graph is computed, in order to reduce the number
of edges, while keeping the similarity information.
The MST is then used to guide the positioning of the patient vertices on the 2-dimensional screen. Let pi= (xi, yi)T, xi, yi∈ R, be the coordinates of patient
i on the screen. Let also P = (p1, p2, . . . , pN) T
be the matrix collecting all the 2D points as its rows. Then, the placement P of the N points is calculated by minimizing the following objective function:
Jm(P) = N X i=1 N X j=1,j6=i q2 ||pi− pj|| + X i,j: (Oi,Oj)∈Em0 k||pi− pj||2.
Intuitively, this function evaluates the potential energy of the tree, if each vertex is considered as a charged particle and the edges as springs attached to pairs of them. The first term of the sum is the energy of the charges repelling one another, following Coulomb’s law. The second term is the energy of the attracting springs, according to Hooke’s law. If such a system of charges and springs is let to act freely, the particles will tend to repel one another, while the springs will keep together particles connected by edges, thus unfolding the tree structure. The lowest energy position is one where the tree has been completely unfolded and its structure is easily visible. In this position, the patients with similar characteristics will be put close to each other, while dissimilar patients will be put away from each other. An example of the overall procedure is illustrated in Fig. 1, where the color of each point is used to visually denote the example characteristics of each point. After the minimization of the potential objective, in Fig. 1(c), the structure of the tree is apparent and similar colors are placed close to each other.
Handling Multiple Feature Types: The above procedure holds for a specific feature type m. If a different feature type is used, different distances will be calculated among the points, resulting in a different tree, a different objective function and a different ultimate positioning. The multiple feature types result in a set of objective functions J (P), instead of a single one:
J (P) = {J1(P), J2(P)), . . . , JM(P)} ,
so that the goal is to minimize them all simultaneously: Popt= arg min
P J (P).
The multiple objective Jmare conflicting, since the optimal solution for one
of them is not optimal for another, thus a single solution cannot in general be reached. Such problems of conflicting objectives are handled by multi-objective optimisation techniques, which result in a set of optimal trade-offs among the objectives, namely the Pareto set. Multi-objective optimisation is based on the notion of Pareto dominance among the feasible solutions. A solution dominates another one if it has a smaller value for at least one objective and there is no objective for which it has a larger value. Between two solution, the dominant one is preferred, since it is impartially better than the other one, with respect to all objective functions, without sacrificing any of them. Formally, a solution P1 dominates another solution P2, if
Jm(P1) ≤ Jm(P2), ∀m ∈ {1, . . . , M }, and
∃k ∈ {1, . . . , M } : Jk(P1) < Jk(P2).
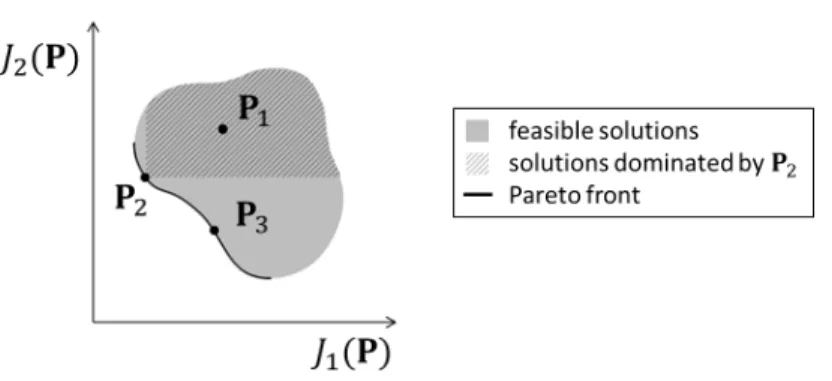
If two solutions mutually do not dominate each other, they are said to be incomparable, since there can be no impartial judgment as to which is better than the other. The goal of multi-objective optimisation is to compute the set of solutions that dominate all other feasible solutions but are mutually incom-parable. This set is called the Pareto set and consists a set of optimal trade-offs among the multiple objectives. In Fig. 2, the feasible and optimal solutions for an example problem of two objectives are depicted.
The gray-shaded area represents the set of all feasible solutions, while the bold border in the lower left of the feasible area represents the solutions of the Pareto set. In such diagrams in the space of the objective function values, the solutions corresponding to the Pareto set are called the Pareto front. Three ex-ample solutions are shown. Solution P2dominates P1since both objectives have
smaller values at P2. Similarly, P2 dominates all solutions within the hatched
area. On the other hand, solutions P2and P3are incomparable, since none
dom-inates the other. All the solutions of the Pareto front are mutually incomparable, since decreasing one objective leads to increasing the other.
Computing the Pareto front, which is the goal of multi-objective optimisa-tion, means presenting the decision maker with a minimal set of optimal trade-offs, from which to select. In this paper, this set of solutions corresponds to
7
Fig. 2. Example Pareto diagram illustrating the Pareto front for a problem of two objectives, J1 and J2. The gray area represents the set of all feasible solutions, while the bold border is the Pareto front. Solution P2 dominates P1, as well as all solutions within the hatched area. Solutions P2 and P3 are incomparable.
different trade offs among the various medical and simulated features describing the patients. By selecting among the trade-offs, through an application interface, the doctor or any decision maker can put more focus on various characteristics and thus view different kinds of relationships and groupings among the data.
3
Preliminary Results
A total of 42 PD patients of various ages (mean: 63, stdev: 8.1) and 10 healthy / control subjects of matching ages (mean: 64.9 , stdev: 7.75) were measured. All PD subjects were tested with an on-medication treatment state. The subjects performed the test with both hands and the extracted features were averaged, thus resulting into one feature-set per subject. The proposed algorithm computes the visualisation output of the 52 instances almost instantly (t < 0.05sec). The interactive environment allows its user to re-adjust the objective weights and updates the dots position without any lag. In terms of scalability the algorithm performs at O(N log N ), where N is the number of nodes. Experiments in the application domain of mobile network security have shown that a dataset of 4800 points needs less than 3ecs for the output solution [12]. The aforementioned experiments were performed using a 8-threaded Intel Core i7 processor running at 4GHz.
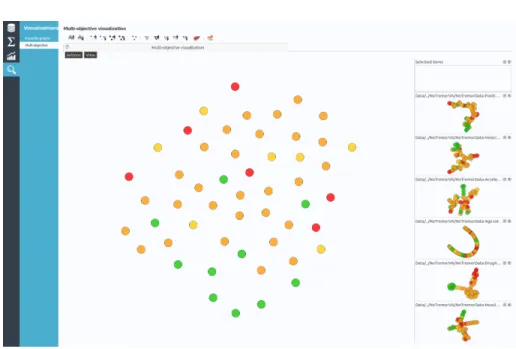
The patient space of the combining all the features, using equal weighting among them, is depicted in Fig. 3. Green coloured dots represent a control sub-ject, while yellow (mild condition), orange (medium condition) or red (severe condition) dots represent the PD patients. As it is shown, a combination of all the features results into a sparse cluster of the green dots. However, it fails to cluster three of the control subjects. This fact can be translated as that the se-lected combination of the feature types does not provide enough discriminating power.
Fig. 3. Multi-objective result of all the feature type combined. The gathering of the green dots representing the control subjects in the lower part is not concentrated.
Fig. 4. Testing the impact of each feature: increasing the weight of the “Muscle Acti-vation” feature results into a robust patient-healthy separation.
9
By adjusting the weights among the feature types, the most crucial one for separating the healthy from the patient cohort may be found. In Fig. 4, the feature representing the extracted Muscle Activations separates the two groups in much more robust way, thus, defining it as the most significant for this type of application. Other features have been tested, but none has provided such good discrepancy.
4
Conclusion
A visual analytics methodology based on multi-objective optimisation was ap-plied to a typical PD line tracking test output and managed to identify suc-cessfully the most crucial feature able to separate the healthy from the patient groups. In the future work, there are plans of investigating the potential of the methodology with other neurodegenerative genetic disorders, such as the Hunt-ington’s Disease.
Acknowledgement: Partial funding for this work was provided by the EU co-funded project NoTremor (EC FP7 Grant agreement no 610391).
References
1. Aigner, W., Miksch, S., Schumann, H., Tominski, C.: Visualization of time-oriented data. Springer Science & Business Media (2011)
2. Atrey, P.K., Hossain, M.A., El Saddik, A., Kankanhalli, M.S.: Multimodal fusion for multimedia analysis: a survey. Multimedia systems 16(6), 345–379 (2010) 3. Blum, A., Mitchell, T.: Combining labeled and unlabeled data with co-training. In:
Proceedings of the eleventh annual conference on Computational learning theory. pp. 92–100. ACM (1998)
4. Carroll, L.N., Au, A.P., Detwiler, L.T., Fu, T.c., Painter, I.S., Abernethy, N.F.: Visualization and analytics tools for infectious disease epidemiology: a systematic review. Journal of biomedical informatics 51, 287–298 (2014)
5. Coello, C., Lamont, G., Van Veldhuizen, D.: Evolutionary algorithms for solving multi-objective problems, vol. 5. Springer (2007)
6. Coy, J.A., Mehrkens, J.H., Roppenecker, D.B., Lueth, T.C.: Finding the center of parkinson’s disease. a novel measurement device for quantifying motor symptoms during dbs-surgery. In: Robotics and Biomimetics (ROBIO), 2014 IEEE Interna-tional Conference on. pp. 1691–1696. IEEE (2014)
7. Ehrgott, M.: Multicriteria optimization, vol. 2. Springer Berlin (2005)
8. Goetz, C.G., Poewe, W., Rascol, O., Sampaio, C., Stebbins, G.T., Counsell, C., Giladi, N., Holloway, R.G., Moore, C.G., Wenning, G.K., et al.: Movement dis-order society task force report on the hoehn and yahr staging scale: status and recommendations the movement disorder society task force on rating scales for parkinson’s disease. Movement disorders 19(9), 1020–1028 (2004)
9. G¨onen, M., Alpaydın, E.: Multiple kernel learning algorithms. Journal of Machine Learning Research 12, 2211–2268 (2011)
10. Holzinger, A., Jurisica, I.: Knowledge discovery and data mining in biomedical informatics: The future is in integrative, interactive machine learning solutions. In: Interactive Knowledge Discovery and Data Mining in Biomedical Informatics, pp. 1–18. Springer (2014)
11. Kalamaras, I., Drosou, A., Tzovaras, D.: A multi-objective clustering approach for the detection of abnormal behaviors in mobile networks. In: Communication Workshop (ICCW), 2015 IEEE International Conference on. pp. 1491–1496. IEEE (2015)
12. Kalamaras, I., Papadopoulos, S., Drosou, A., Tzovaras, D.: Mova: A visual analyt-ics tool providing insight in the big mobile network data. In: Artificial Intelligence Applications and Innovations, pp. 383–396. Springer (2015)
13. Lin, Y.Y., Liu, T.L., Fuh, C.S.: Multiple kernel learning for dimensionality re-duction. Pattern Analysis and Machine Intelligence, IEEE Transactions on 33(6), 1147–1160 (2011)
14. Nigam, K., Ghani, R.: Analyzing the effectiveness and applicability of co-training. In: Proceedings of the ninth international conference on Information and knowledge management. pp. 86–93. ACM (2000)
15. Ord´o˜nez, P., DesJardins, M., Lombardi, M., Lehmann, C.U., Fackler, J.: An an-imated multivariate visualization for physiological and clinical data in the ICU. In: Proceedings of the 1st ACM International Health Informatics Symposium. pp. 771–779. ACM (2010)
16. Ramaker, C., Marinus, J., Stiggelbout, A.M., van Hilten, B.J.: Systematic evalua-tion of rating scales for impairment and disability in parkinson’s disease. Movement Disorders 17(5), 867–876 (2002)
17. Rind, A., Aigner, W., Miksch, S., Wiltner, S., Pohl, M., Drexler, F., Neubauer, B., Suchy, N.: Visually exploring multivariate trends in patient cohorts using animated scatter plots. In: Ergonomics and Health Aspects of Work with Computers, pp. 139–148. Springer (2011)
18. Snow, B.: Objective measures for the progression of parkinsons disease. Journal of Neurology, Neurosurgery & Psychiatry 74(3), 287–288 (2003)
19. Stanev, D., Moschonas, P., Votis, K., Tzovaras, D., Moustakas, K.: Simulation and visual analysis of neuromusculoskeletal models and data. In: Artificial Intelligence Applications and Innovations, pp. 411–420. Springer (2015)
20. Tong, H., He, J., Li, M., Zhang, C., Ma, W.Y.: Graph based multi-modality learn-ing. In: Proceedings of the 13th annual ACM international conference on Multi-media. pp. 862–871. ACM (2005)
21. Turkay, C., Jeanquartier, F., Holzinger, A., Hauser, H.: On computationally-enhanced visual analysis of heterogeneous data and its application in biomedical informatics. In: Interactive Knowledge Discovery and Data Mining in Biomedical Informatics, pp. 117–140. Springer (2014)
22. Von Landesberger, T., Kuijper, A., Schreck, T., Kohlhammer, J., van Wijk, J.J., Fekete, J.D., Fellner, D.W.: Visual analysis of large graphs: state-of-the-art and future research challenges. In: Computer graphics forum. vol. 30, pp. 1719–1749. Wiley Online Library (2011)
23. Ward, M.O., Grinstein, G., Keim, D.: Interactive data visualization: foundations, techniques, and applications. CRC Press (2010)
24. Wongsuphasawat, K., Guerra G´omez, J.A., Plaisant, C., Wang, T.D., Taieb-Maimon, M., Shneiderman, B.: LifeFlow: visualizing an overview of event se-quences. In: Proceedings of the SIGCHI conference on human factors in computing systems. pp. 1747–1756. ACM (2011)