Buckling and Friction-Based Linear Motion Clutch with
Application to Medical Devices
by
Erik K. Bassett
Submitted to the Department of Mechanical Engineering
in partial fulfillment of the requirements for the degree of
Master of Science in Mechanical Engineering
at the
MASSACHUSETTS INSTITUTE OF TECHNOLOGY
June 2008
© Massachusetts Institute of Technology 2008. All rights reserved.
A uthor
...
. . .
Department of Mechanical Engineering
May 16, 2008
Certified by ...
...
A.-fAccepted by ...
OF TECHNOLOGYJUL 29 2008
LIBRARIES
Chairman,
... .• . . ...Alexander H Slocum
Professor of Mechanical Engineering
Thesis Supervisor
Lallit Anand
Department Committee on Graduate Students
Buckling and Friction-Based Linear Motion Clutch with
Application to Medical Devices
by
Erik K. Bassett
Submitted to the Department of Mechanical Engineering
on May 16, 2008, in partial fulfillment of the
Requirements for the Degree of Master of Science in
Mechanical Engineering
Abstract
Improperly inserted and positioned needles and catheters often require repeated attempts
at correct placement causing injury to adjacent structures or infusions into inappropriate
spaces. Existing catheter insertion methods do not uniformly provide needle tip location
feedback, nor prevent the needle from going beyond the target space. This research
achieved the development of design methods and analysis tools that can be used to create
a new catheter insertion device. This device can advance a needle through firm tissue but
automatically stop advancing it upon entrance into a target space. Prototypes of the
device were tested on raw chicken breast, the best of which had about a 50% success rate.
Tests performed on deceased pigs showed the device advanced well through muscle but
not the peritoneum. The system studied consisted of a flexible filament (OD '0.9 mm)
passing through a tube (ID -1.2 mm) with both straight and curved sections. Initially it
was believed that the capstan equation would provide a good model for the system in
tension and compression. Though the capstan equation proved valid for the system under
tension, models from drill strings used in the petroleum industry provided an accurate
model for the system in compression. Based on the geometry of the tube, this model
accurately predicts the compressive force in the filament and when the filament locks-up
inside the tube (needle). An alternate method to measure the tube geometry using a
flatbed scanner was developed and studied. This method was found to provide excellent
accuracy and repeatability for measuring tubes, and has shown potential as a
measurement method for many other applications.
Thesis Supervisor: Alexander H Slocum
Acknowledgements
I would like to thank the following individuals for their roles in my research: Alex
Slocum for his guidance and the opportunity to work with him; Omid Farokhzad for
supplying the need for this research; Jeff Karp for his help connecting key people; the
Deshpande Center for providing funding for the research; CIMIT for providing funds for
completion of the research; Douglas Shook at Brigham and Women's Hospital for
allowing me to view a procedure and give explanations of existing technology; Peter
Masiakos at Massachusetts General Hospital (MGH) for his suggestions to improve
device and expand potential market; Howard Pryor at MGH for performing and recording
the prototype tests on pigs; my now wife, Britney, for supporting me in spite of my stress
and staying up till all hours of the day and night helping me complete tasks; and last but
not least my family for their encouragement, love, support, and help editing my
Contents
1. Introduction ... 15
1.1 Capstan Analysis ...
16
1.2 Petroleum Industry Drill String Analysis...
... 16
2. D esign Param eters... ... 18
2.1 Manufacturing of Test Parts ...
... 19
2.2 CMM Measurement of the As-Formed Tubes ...
...
23
3. Experim ents ... ... ... 26
3.1 Steel Tube-Filament Friction Coefficients ... 26
3.2 Modulus of Elasticity...
28
3.3 Tension Tests of Filament Inside Tubes with Curves... 30
3.4 Compression Tests of Filaments Inside Tubes with Curves ... 44
3.5 Glass Tube Tests to Verify Buckling Mode Assumption ... 81
3.6 Measuring and Modeling Conclusions ...
... 93
4. Prototype Testing ...
... 94
4.1 M otivation ...
... 94
4.2 Prototype Development...
95
4.3 Prototype Test Results with Chicken...
... 98
4.4 Prototype Test Results with Deceased Pig...
100
4.5 Prototype Test Conclusions...
101
5. Image Processing...
102
5.1 M otivation ...
102
5.2 Introduction ...
102
5.4 Theory ...
103
5.5 Image Processing Steps ...
104
5.6 Image Scans Performed ...
104
5.7 Statistical Analysis...
106
5.8 Study of 3D Effects ...
108
5.9 Discussion of Image Processing Results... 108
5.10 Image Processing Conclusions ...
110
6. Challenges Overcome...
111
6.1 Friction Test Block ... 111
6.2 Friction Test Method ...
112
6.3 Acquiring Supplies ...
114
7. Conclusions and Future Work ...
115
8. Appendix I- Prototype Test Results ...
118
9. Appendix II- Matlab Code...
124
10. Appendix III- Image Processing Steps ...
157
List of Figures
Figure 1-1: Capstan effect ...
16
Figure 1-2: Flexible filament (green) passing through example design tube to exploit the
capstan effect... 16
Figure 2-1: Example of tube designs with one and two bends ...
18
Figure 2-2: Angular displacement description and equation...
18
Figure 2-3: Cross section views of flexible filaments inside tubes ... 19
Figure 2-4: Acrylic guide for bending tube 2C...
...
20
Figure 2-5: Tube guide and tube with additional acrylic piece on top...
21
Figure 2-6: Tube guide and tube in vise prior to bending ...
22
Figure 2-7: Tube and acrylic held down while being bent... 22
Figure 2-8: Improved method for containing the tubes vertically during bending... 23
Figure 2-9: Nylon catheter tube path inside tube showing reduced angular displacement
... ..
24
Figure 2-10: PTFE monofilament path inside tube showing reduced angular displacement
...
... . ... 2 4
Figure 2-11: Average bend radius calculation method ... 25
Figure 3-1: Friction coefficient measurement test setup ... 27
Figure 3-2: Friction test specimen with tubes glued in place...
27
Figure 3-3: Typical friction coefficient test result for nylon and steel tubing... 28
Figure 3-4: Nylon filament fixed with epoxy into threaded steel rod for modulus of
elasticity test...
... 29
Figure 3-5: Stress-strain curve of nylon filament ...
29
Figure 3-6: Stress-strain curve of PTFE filament ...
... 30
Figure 3-8: Cross-section view of assembly in low (left) and high (right) positions ... 33
Figure 3-9: Cross-section of tube passing through vises and bracket... 34
Figure 3-10: Travel of load cell and weight during tension test... 35
Figure 3-11: Typical PTFE tension test result...
...
36
Figure 3-12: Nested oversized and design tubes ...
37
Figure 3-13: Example of tube friction force tests ...
... 38
Figure 3-14: Horizontal force test setup...
...
... 39
Figure 3-15: Force required to slide the filaments through tube design 2D... 39
Figure 3-16: Predicted max, min, measured and adjusted raising nylon forces ...
41
Figure 3-17: Predicted max, min, measured and adjusted lowering nylon forces ...
41
Figure 3-18: Predicted max, min, measured and adjusted raising PTFE forces... 42
Figure 3-19: Predicted max, min, measured and adjusted lowering PTFE forces ...
42
Figure 3-20: CAD model of test setup ...
... 46
Figure 3-21: Compression data for design 1B using PTFE Filament ... 48
Figure 3-22: Truncated compression data for design 1B using PTFE filament ... 49
Figure 3-23: 'Zeroed' Fin and Fout curves at beginning of compression loading for PTFE
filam ent ...
50
Figure 3-24: Typical results from shortened test 2 using tube design IC and PTFE
filam ent ...
5 1
Figure 3-25: Typical results from shortened test 3 using tube design 2C and nylon
filam ent ...
... 52
Figure 3-26: Fin vs. Fut with parabolic curve fit on Fout for nylon filament... 54
Figure 3-27: Typical Fin vs Fout curve with capstan predictions for nylon filament... 56
Figure 3-28: Plot of Fin vs Fout with cutoff point marked for nylon filament... 57
Figure 3-29: Plot of Fin vs Fout first derivative with cutoff point marked for nylon filament
...
...
58
Figure 3-30: Plot Fin vs Fout second derivative with cutoff point marked for nylon filament
...
...
...
. . ...
•••...
59
Figure 3-31: Fin vs. Fout with Capstan predictions for nylon filament ... 62
Figure 3-32: Fin vs. Fout with log-normal scale showing exponential region for nylon
filam ent ... ... ...
... 63
Figure 3-33: Second derivative of Log(Fin) vs. Fout showing buckling transition point for
nylon filam ent ... ... 64
Figure 3-34: Fin vs. Fout with buckling transition point marked for nylon filament... 65
Figure 3-35: Drill string model prediction curves with measured data from nylon filament
... ..
... ...
...
... ...
...
...
...
70
Figure 3-36: Drill string model prediction curves with measured data from PTFE filament
...
... 7 1
Figure 3-37: Drill string model prediction curves including buckling condition for nylon
filam ent ... ...
72
Figure 3-38: Drill string model prediction curves including buckling condition for PTFE
filam ent ...
...
73
Figure 3-39: Combined capstan and drill string model prediction curves for nylon
filam ent ...
74
Figure 3-40: Combined capstan and drill string model prediction curves for PTFE
filam ent ...
...
.. ...
75
Figure 3-41: Best drill string based model prediction for nylon filament...
78
Figure 3-42: Best drill string based model prediction for PTFE filament... 79
Figure 3-43: Glass tubes with one and two bends ...
... 81
Figure 3-44: Glass tube compression test system ... 83
Figure 3-45: Section view of glass tube compression test system... 83
Figure 3-46: Typical measured forces in compression test with glass tubes ... 84
Figure 3-47: Helically buckled PTFE filament inside ink filled glass tube ... 85
Figure 3-48: (a) Picture of PTFE filament in compression inside glass tube
(b)
SolidWorks model of filament in compression in glass tube (c) SolidWorks model
of filament in tension in glass tube...
86
Figure 3-49: Glass-PTFE friction coefficient test with steel rods (diagonal pieces) to add
w eigh t ...
87
Figure 3-50: Typical friction test result between glass and black PTFE ... 88
Figure 3-51: Measured and predicted values for forces using PTFE in glass tube with one
b en d ... 89
Figure 3-52: Measured and predicted values for forces using PTFE in glass tube with two
b en d ... 90
Figure 3-53: Measured and predicted (neglecting metal tubing) values for forces using
PTFE in glass tube with one bend...
... 91
Figure 3-54: Measured and predicted (neglecting metal tubing) values for forces using
PTFE in glass tube with two bend...
... 92
Figure 4-1: Early setup for testing chicken breast on knox gelatin ... 95
Figure 4-2: Two-point doubly symmetric needlepoint used in prototype tests... 96
Figure 4-3: Three point needle tip used in prototype tests ... 98
Figure 4-4: Demonstration of prototype device that deployed after passing through raw
chicken breast...
99
Figure 4-5: Endoscopic image of needle over penetrating abdominal wall of pig ... 100
Figure 5-1: Example image of scanned tube ... 104
Figure 5-2: Tube section scanned at left middle and right locations on the scanner... 108
Figure 6-1: Example of failed grinding attempt ...
112
List of Tables
Table 2-1: Design parameter values of tube designs tested ...
. 19
Table 2-2: Values of E, I and E*I for nylon and PTFE... 19
Table 2-3: Design parameter values of acrylic guides ...
20
Table 2-4 Calculated max and min angular displacements for nylon and PTFE in each
design ... ...
24
Table 3-1 Friction coefficients for PTFE and nylon at different rates... 28
Table 3-2: Mean force values for tension tests ... 36
Table 3-3: Averages of measured tube friction forces ...
38
Table 3-4: Average force values of nylon and PTFE sliding through tubes ... 40
Table 3-5: Comparison of measured, corrected and predicted forces using nylon filament
...
. . .
...
...
43
Table 3-6: Comparison of measured, corrected and predicted forces using PTFE filament
...
... 4 3
Table 3-7: Length of long straight sections of design tubes to test effect on output... 50
Table 3-8: Design parameters of new nine tubes tested...
... 53
Table 3-9: Maximum Fout values calculated from curve fits of data ... 54
Table 3-10: Fout curve-fit coefficients for nylon (Fout
=
A*x
2+B*x+C)... 55
Table 3-11: Fout curve-fit coefficients for PTFE (Fout
=
A*x2+B*x+C)... 55
Table 3-12: Break point values for zeroed forces in nylon filament ... 60
Table 3-13: Break point values for zeroed forces in PTFE filament ... 60
Table 3-14: Break point values for measured forces in nylon filament... 60
Table 3-15: Break point values for measured forces using PTFE filament ... 61
Table 3-16: Values and ranks of design parameters bend radius and angular displacement
Table 3-17: Log-based buckling point values for zeroed forces in nylon filament... 65
Table 3-18: Log-based buckling point values for zeroed forces in PTFE filament... 66
Table 3-19: Log-based buckling point values for measured forces in nylon filament... 66
Table 3-20: Log-based buckling point values for measured forces in PTFE filament ... 66
Table 3-21: Parameters for linear curve fit of log(Fin) vs. Fout in nylon filament... 67
Table 3-22: Parameters for linear curve fit of log(Fin) vs. Fout in PTFE filament ... 67
Table 3-23: Curve fit slope divided by capstan variables for nylon filament ... 67
Table 3-24: Curve fit slope divided by capstan variables for PTFE filament ... 67
Table 3-25: Bend radius and angular displacements of glass tubes... 81
Table 3-26: Friction coefficients between PTFE and glass at different rates... 88
Table 4-1: Improved tube shapes ...
98
Table 5-1: Scan variable values for each scan...
105
Table 5-2: Output values for each scan... 106
Table 5-3: Regression slope and y-intercept values for outputs and variables tested... 107
Table 5-4: Confidence intervals (95%) for the regression slope and y-intercept ... 107
Table 5-5: Revised confidence intervals (95%) for Total Length regression coefficientl07
Table 5-6: Revised confidence intervals (95%) for Transition 1 & 2 regression
coefficients ...
107
List of Symbols
ai- Inclination build rate (rad/m)
a,- Azimuth build rate (rad/m)
P3- Buckling constant
Dfilament-
Filament diameter (mi
E- Modulus of elasticity (N/m
)fb-
Buoyancy factor
Fi,- Generalized contact force per unit length (N/m)
Flhbc- Contact force per unit length of helically buckled filament (N/m)
Flnbc- Contact force per unit length of non-buckled filament (N/m)
Fa- Input force
(N)
Fontact-
Predicted contact force
(N)
Ficr-
Critical buckling load
(N)
Fin- Input force
(N)
Fout- Output force
(N)
Fout_predicted-
Predicted output force (N)
I- Moment of inertia of filament (m
4)Lstraight-
Length of long straight section of design tube (m)
Lcurved-
Length of curved section of design tube (m)
mg- Weight per unit length of filament (N/m)
[t- Coefficient of friction between filament and tube wall
r- Radial gap spacing between filament and wall (m)
R- Average radius of curves in design tubes (m)
Chapter 1
Introduction
Medical procedures often require placement of arterial, central venous, and
epidural catheters. Misdirected insertion of needles and catheters can result in
complications including discomfort from repeated catheterization attempts, bleeding,
post-dural puncture headache, nerve injury, infusion of medication into inappropriate
tissues, hemodynamic shock, and respiratory arrest [1]. A needle system that detects
different tissues or tissue compartments could reduce these complications in placing
central venous catheters, arterial lines, and epidural catheters. This work focused on
creating a mechanical clutch system that advances a needle through more resistant tissues
and then automatically releases it when the tip enters the desired soft tissue or cavity.
This clutch is based on the shape dependent sliding resistance of a flexible
filament passing through a tube. At one extreme is a short, straight tube. A filament going
through such a tube feels little resistance and is easily advanced. At the other extreme is a
tube with many tight bends or loops. A filament going through this system only advances
to a point before it begins to bind inside the tube and 'lock-up'. Between these extremes,
both sliding and locking by adjusting the exit resistance for a single tube shape can be
achieved. This thesis presents the results of testing and modeling the clutch system, the
development and testing of a prototype device, and an improved method for quickly and
accurately measuring the shapes of the tubes using a flatbed scanner.
1.1 Capstan Analysis
The Capstan equation has proved very valuable to predict the response of cable
actuators and systems [2]. The first step of this research involved determining whether
the capstan equation (Equation 1 and Figure 1-1) modeled the tensile and compressive
forces in a thin filament passing through a tube with bends (Figure 1-2). If successful, it
would indicate whether the proposed clutch action could be predicted and used in
designing clutch systems. The primary tests for the study measured tensile and
compressive loads to a filament passing through tubes of varying shapes.
Fin = Fou
n oute()
0* e(o*)
(1)
0 = Wrap Angle
Fout, t = Friction Coefficient
Figure 1-1: Capstan effect
in
Figure 1-2: Flexible filament (green) passing through example design tube to exploit the capstan effect
The capstan equation proved to be a good model for the filament in tension but
not compression. Sections 3.3.3 and 3.4.2 respectively show the analysis performed and
results for each case. Other models were the researched to identify a better fit for the
compression force findings.
1.2 Petroleum Industry Drill String Analysis
Drill strings, used in the oil industry, undergo similar loading and buckling as this
system, but on a larger scale. For this reason drill string models were researched and
analyzed. When studying a long slender object under compression, it is important to
determine the point at which it will buckle, and how much force will be absorbed due to
increased contact with the tube wall. The earliest model to comprehensively describe
buckling forces in drill string systems was developed by Lubinski et al. [3] in the 1960's.
In that study he derived the first model to predict helical buckling of a drill string in a
vertical well. Mitchell et al. [4] further developed a simple helical buckling model that
included friction. The effects of curvature and friction on buckling were studied by
McCann et al. [5]. He et al. [6] studied helical buckling and lock-up conditions of coiled
tubing in curved wells. Qiu et al. [7] developed models for sinusoidal and helical
buckling in vertical and inclined straight as well as curved holes. The buckling behaviors
of pipes and the resulting influence on axial force transfer was studied by Kuru et al. [8].
The models developed by He et al. and Qiu et al. most closely represented the
system studied and were used to successfully predict compressive output forces as shown
in section 3.4.3. These models include the geometry of the tube and properties of the drill
string, making them comprehensive.
Equations 2-5 are from He et al. and were used in this study.
FPcr=
- Fnbc EI(2)
r
Flnbc
[(fbmgsinO + Fa•a• + (Fa sinO
]
(3)
F
2r
Flhbc a
(4)
4E1
F
FInbc for Fa
< FlcrlC Flhbc
for
Fa > Ficr (5)Where Fa is the axial input force to the top of the drill string, Fier is the critical
buckling force where
P3
= 4 and 8 for sinusoidal and helical buckling respectively, F1nbc is
the contact force per unit length for a non-buckled configuration, Flhbc is the contact force
per unit length for a helically buckled string, and Fie is the generalized contact force per
unit length of the string. See section 3.4.3 for complete definition of equations.
Chapter 2
Design Parameters
For this study the design parameters chosen were based on the primary variables
in the capstan equation. These three parameters included the number of bends (Figure
2-1), the angular displacement (Figure 2-2), and the average bend radius. Eight different
tube designs were created (each 17.8 cm long) and used in both the tension and
compression tests. Table 2-1 shows the values of each parameter for the designs tested.
The tubing used for the designs was stainless steel with an OD 1.47 mm and ID 1.22 mm.
Two different flexible filaments were used: nylon tubing (OD 0.90 mm, ID 0.47 mm) and
PTFE monofilament (OD 0.97 mm). Figure 2-3 show the differences in size and
geometry of the filament inside the tubing while Table 2-2 shows the values of E, I and
E*I for each.
Figure 2-1: Example of tube designs with one and two bends
Table 2-1: Design parameter values of tube designs tested
Design # of Bends Avg. Bend Radius (mm) Angular displacement (rad)
1A 1 24.7 1.57 IB 1 29.7 1.73 IC 1 27.3 1.94 ID 1 31.6 1.99 2A 2 26.0 1.95 2B 2 34.7 1.83 2C 2 28.3 2.09 2D 2 32.0 2.22
(a) PTFE Monofilament (b) Nylon Catheter Tube Figure 2-3: Cross section views of flexible filaments inside tubes
Table 2-2: Values of E, I and E*I for nylon and PTFE Material I (mm4) E (Mpa) E*I (N-m2
PTFE 4.26 E-02 73 3.11E-06
Nylon 3.01 E-02 172 5.17E-06
*Determined from tensile test performed in this research (see Modulus of Elasticity section)
2.1 Manufacturing of Test Parts
Plastic guides made of 3.2 mm thick acrylic sheet were constructed for bending
the design tubes. The guides were cut using an OMAX CNC Waterjet Machining Center
(www.omax.com). The shapes of the guides were chosen based on prior bench level
experiments where the nylon was pushed through test guides. The guide shapes were
defined by the angular displacement, bend radius, and number of bends. The values of
each parameter were chosen to make a two level full factorial design. Table 2-3 shows
the range of parameters used in the guides.
Table 2-3: Design parameter values of acrylic guides Guide Design
Design # of Bends Bend Radius (mm) Angle (rad) Bend Amplitude (mm)
1A 1 14.0 2.79 6.6 IB 1 17.8 2.79 8.4 IC 1 14.0 3.49 9.9 ID 1 17.8 3.49 12.7 2A 2 14.0 2.79 3.6 2B 2 17.8 2.79 4.6 2C 2 14.0 3.49 4.6 2D 2 17.8 3.49 5.8
Each guide was made with a 12.7 mm straight segment on one side the bend. On
the other side of the bend(s) was a second straight section that filled the rest of the 10.2
cm long guide. Each guide was 5.2 cm wide to provide rigidity (Figure 2-4). Before being
bent, each tube was cut to a length of 17.8 cm using a dremmel tool. To minimize the
effects of burs on the ends of each tube, honing stones and drill bits were used to round
the outside and inside corners.
Figure 2-4: Acrylic guide for bending tube 2C
To prevent kinking or collapsing of the tube during the bending process, a PTFE
filament (OD 1.14 mm) was placed inside. The tubes were bent by placing the two guides
on a flat surface with the tube in between. A third piece of acrylic was placed on top
(Figure 2-5 & Figure 2-6). All three guide pieces were secured to prevent the tube from
displacing off the surface (Figure
2-7).
The tube was positioned between the guides so
that in the post-bent shape, one end would correspond with the edge of the guide (see
Figure 2-4), resulting in a straight section -13 mm long (see Figure 2-2). The two guides
were then pressed together with a vise. Due to spring back of the metal, the resulting
shapes were different from the guides and were not always coaxial. The tubes were then
adjusted by hand so the two straight sections were as coaxial as possible. The true shape
of the tubes then had to be measured to extract exact angles and lengths.
Figure 2-6: Tube guide and tube in vise prior to bending
Later, larger tubes were made with more bends, requiring larger holding forces.
Instead of holding the tube in place vertically by hand, aluminum L-extrusions were
bolted to a table and provided the necessary forces. The guides and tubes were placed
between the aluminum and the tabletop as in Figure 2-8.
Figure 2-8: Improved method for containing the tubes vertically during bending
2.2
CMM Measurement of the As-Formed Tubes
The true final shape of each formed tube design was found using a coordinate
measuring machine (CMM). Each tube was measured approximately every 1 mm along
its entire length and the x and y locations recorded. These points were used to calculate
the angular displacement and average radius of curvature of each tube design. Because
the filaments had smaller diameters than the tube, the tensioned filaments transitioned
from side to side thus passing through less of a angular displacement than the tube
(Figure 2-9 & Figure 2-10). Thus, the tube provided an upper limit for the angular
displacement while the lower limit could be calculated based on the diameter of each
filament. This outer diameter difference between the nylon and PTFE caused there to be a
difference in the minimum angular displacement of each filament inside the tube. Table
2-4 shows these max and min angular displacement values for each design. The average
bend radius was calculated by dividing the total arc length of the bends by the angular
displacement (Figure 2-11).
Figure 2-9: Nylon catheter tube path inside tube showing reduced angular displacement
Figure 2-10: PTFE monofilament path inside tube showing reduced angular displacement
Table 2-4 Calculated max and min angular displacements for nylon and PTFE in each design Design Max Angle (Rad) Min Nylon Angle (Rad) Min PTFE Angle (Rad)
1A 1.567 1.265 1.309 1B 1.730 1.416 1.454 1C 1.934 1.710 1.741 1D 1.991 1.786 1.820 2A 1.947 1.497 1.574 2B 1.829 1.494 1.550 2C 2.092 1.728 1.787 2D 2.219 1.801 1.876
Chapter 3
Experiments
All experiments were performed using an ADMET 5601 testing machine with one
or two Interface SMT1-2.2 load cells (capacity 9.8 N). The ADMET machine included
data acquisition software (Mtestw version 9.0.6) and CNC controls for the actuator head.
Prior to testing, all critical components (i.e. tubes, filament, etc.) were cleaned with
alcohol to remove any oil and moisture. Before the design tube was placed in the setup
for testing the load cells were calibrated to ensure consistent force readings. During all
tests, powder-free surgical gloves were worn to minimize surface contamination.
Between each tension and compression test the design tube was removed and both the
filament and tube were dried with compressed nitrogen gas. A similar procedure was
conducted between friction tests.
3.1 Steel Tube-Filament Friction Coefficients
The friction coefficients between the filaments and tubing were obtained by
performing a pull test. A test specimen was pulled horizontally along parallel filaments
while measuring the pulling force (Figure 3-1). These tests were performed at rates of
0.13, 0.38, and
2.54
mm/sec and repeated three times for both nylon and PTFE filaments.
The filaments were tensioned and then clamped between the main plate and two blocks
with two parallel channels (0.8 mm wide, 12.7 mm apart, and 0.6 mm deep). A tubing
holder was created by fixing sections of stainless steel tubing in two parallel channels
(1.6 mm wide, 12.7 mm apart, 0.9 mm deep) cut in a steel block. The tubing was then
ground in half exposing the inside surface (Figure 3-2). To minimize unwanted forces
when pulling the block, it was pulled using a short section of nylon fishing line that was
adhered to it. For the tests, the block rested on the filaments so the only contact occurred
between the inside of the tubes and the filament. The clamps holding the filament ends
inhibited pulling fishing line, so an L-bracket was used to reach around the clamps
(visible in Figure 3-1). Figure 3-3 shows a typical curve for this test.
Figure 3-1: Friction coefficient measurement test setup
Nylon/Steel Friction Coefficient Test Results U.J3 0.3 0.25 z 0.2 , 0.15 0.1 0.05 0 0 2 4 6 8 10 12 14 16 Position (mm)
Figure 3-3: Typical friction coefficient test result for nylon and steel tubing
In these tests, the spike at the beginning corresponds to the static friction value
(circled in Figure 3-3) and is followed by the dynamic region. The static friction
coefficients measured are shown in Table 3-1.
Table 3-1 Friction coefficients for PTFE and nylon at different rates Measured Static Friction Coefficient
Rate (mm/sec) Nylon PTFE
0.13 0.204 0.088
0.38 0.249 0.089
2.54 0.269 0.111
3.2 Modulus of Elasticity
Tension tests were performed on each filament to obtain the corresponding
modulus of elasticity. They were achieved by bonding both ends of a -23 cm filament
section into hollow all-thread (Figure 3-4). The resulting test lengths were 17.5 cm. The
filaments were then stretched at a rate of 0.25 mm/sec and a stress-strain curve generated
(Figure 3-5 & Figure 3-6). From this, the modulus of elasticity was determined to be 172
and 73 MPa for the nylon and PTFE respectively. The epoxy bond failed while testing the
PTFE causing plateaus and inconsistent results in the latter part of the test. However, the
failure occurred late enough that it was determined not to affect the results of the
modulus calculation.
Figure 3-4: Nylon filament fixed with epoxy into threaded steel rod for modulus of elasticity test
Nylon Stress-Strain Test
5000 4500 4000 3500 E D 3000 2500 " 2000 1500 1000
500
0 0.02 0.04 0.06 0.08 0.1 0.12 Strain (mm/mm)Figure 3-5: Stress-strain curve of nylon filament
PTFE Stress-Strain Test ILUUUU 9000 8000 7000 6000 5000 . 4000 3000 2000 1000 0 0 0.05 0.1 0.15 0.2 0.25 Strain (mm/mm)
Figure 3-6: Stress-strain curve of PTFE filament
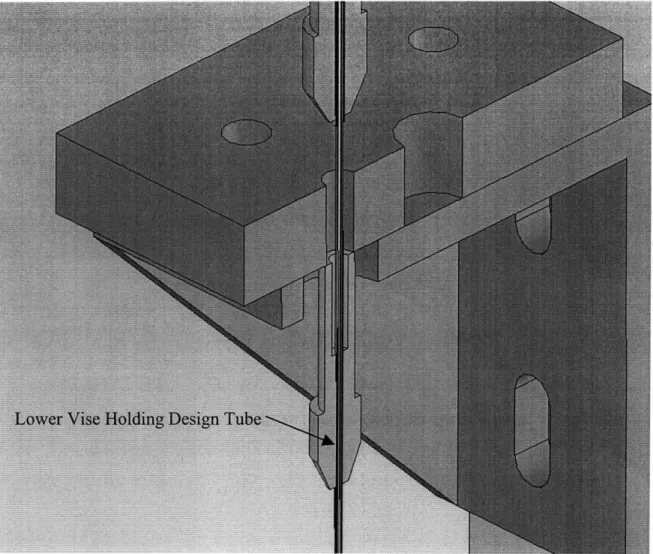
3.3 Tension Tests of Filament Inside Tubes with Curves
The tension test setup consisted of a computer controlled linear actuator and a
bracket mounted on a frame (Figure 3-7). Attached to the bracket was a pin vise that held
the design tube. A load cell was connected to the actuator above and to a second pin vise
below. This vise held a different tube containing the filament (Figure 3-8). This tube (ID
1.60 mm) was oversized in order to slide easily over the design tube and was pinched
closed at the top to hold the end of the filament. The load cell recorded the force in the
upper end of the filament during the tests. A weight hanging from the bottom of the
filament provided a constant tensile force (1.53 N). In this way the filament was always
in tension but forces felt on the upper end depended on the direction of travel. For each
test the actuator moved up and then down 10.2 mm at a rate of 0.38 mm/s. At the
beginning of each test, the weight rested on a surface and then was raised so it hung
freely before being returned at the same rate. Due to the method used to attach the weight
to the filament, some tests began and ended with tensile forces greater than zero. Each
design tube was tested four times. Figure 3-9 shows how the design tube passed through
the pin vise and bracket in the setup. Figure 3-10 shows the different positions of the
weight during the tension tests.
- Load Cell
-
Upper Vise
-
Bracket
- Lower Vise
Curved Tube with
Filament Inside
- Weight
Load Cell
-
Oversized Tube and Flexible
Filament Connection
Upper Vise (Gray)
-
Oversized Tube (Green)
----
Top of Design Tube
-
Flexible filament (Yellow)
(a) Starting Position (b) Highest Position (c) Ending Position Figure 3-10: Travel of load cell and weight during tension test
Results from a typical tension test can be seen in Figure 3-11. The two plateaus
are the regions of interest for each test. While the weight is being raised, the upper part of
the filament acts as the capstan pulling force (Fin) and the lower part acts as the capstan
holding force (Fut) (See Figure 1-1). However, when the weight is lowered, the roles
reverse. In this way, two unique capstan conditions can be analyzed from the same test.
Mean values of the plateaus were found and averaged across the replicate tests for each
design (Table 3-2).
PTFE Tension Test Results Design 1D 2 1.5 0.5 0 0 2 4 6 8 10 12 Vertical Position (mm)
Figure 3-11: Typical PTFE tension test result
Table 3-2: Mean force values for tension tests
Mean Tension Forces (N) - Nylon Mean Tension Forces (N) -PTFE
Design Raising Lowering Raising Lowering
lA 1.916 1.196 2.139 0.966 1B 1.913 1.204 2.056 0.809 iC 2.056 1.099 2.102 0.774 ID 2.034 1.139 2.043 0.685 2A 1.943 1.189 2.045 0.589 2B 1.993 1.149 2.001 0.623 2C 2.042 1.143 2.144 0.862 2D 1.885 1.228 1.923 0.531
3.3.1 Nested Steel Tube-on-Tube Friction
Analysis of tension tests showed that the capstan predictions did not match the
measured tension values. This and other tests were performed to determine the cause of
the difference. One potential source of error was the friction between the design tube and
nested oversized tube used to hold the end of the filament (Figure 3-12) through which
the force on the filament was applied. To measure this, the filament was removed from
the setup and the oversized tube was moved up and down over the design tube. This was
done at rates of 0.13, 0.38, and
2.54
mm/sec and repeated three times. These tests showed
a relatively constant sliding force between the nested steel tubes. For the analysis, the last
2.5
mm of data points (circled regions in Figure 3-13) were averaged. Table 3-3 shows
the averages calculated from these tests for each rate.
I
I
II
Tube Friction Test Results U.4 0.3 0.2 0.1 Z 0 N. -0.1 -0.2 -0.3 -n A Vertical Position (mm)
Figure 3-13: Example of tube friction force tests
Table 3-3: Averages of measured tube friction forces Rate (mm/s) Mean Force Up (N) Mean force Down (lbf)
2.54 0.200 0.243
0.38 0.099 0.138
0.13 0.207 0.227
3.3.2 Horizontal Force Tests
Another possible source of error between the capstan prediction and the measured
results was the difference of the sliding resistance of each filament. To quantify the
effects of the sliding resistance on the tension results, tests were performed measuring the
force required to slide the filament through the tube. These tests were completed
horizontally to minimize gravitational effects (Figure 3-14). The same rate and travel
were used for these tests as for the tension tests (0.38 mm/sec, 10.2 mm right then left).
Figure 3-15 shows typical force results required to slide the filament through a tube.
Table 3-4 shows the average forces measured which relate to raising and lowering forces
in the tension tests. This test included the friction and sliding resistance, making it a more
complete measure of error compared to the-tube-on tube friction tests.
Figure 3-14: Horizontal force test setup
Forces Required to Slide Strings
Design 2D - Run 2
- PTFE
--- Nylon
Position (mm)
Figure 3-15: Force required to slide the filaments through tube design 2D -0.1
-0.2
Table 3-4: Average force values of nylon and PTFE sliding through tubes Nylon Average Forces (N)
Right (Raising) Left (Lowering)
0.125 -0.136 0.097 -0.107 0.085 -0.099 0.093 -0.107 0.104 -0.102 0.101 -0.116 0.100 -0.118 0.082 -0.089
PTFE Avera e Forces (N) Right (Raising) Left (Lowering)
0.335 -0.329 0.237 -0.224 0.259 -0.244 0.248 -0.187 0.312 -0.291 0.257 -0.230 0.331 -0.281 0.194 -0.165
3.3.3 Tension Analysis
The results from the previously described tests were analyzed to determine
whether the capstan equation could provide an accurate model for the system. Maximum
and minimum capstan predictions were established using the max and min values of the
angular displacement and coefficients of friction. These numbers provided a range within
which the actual values could be considered valid. The raw data was adjusted to account
for the tube-on-tube friction and the sliding resistance (which included the tube-on-tube
friction). The adjusted and original values were compared to capstan predictions. Figure
3-16 through Figure 3-19 show these predictions and adjusted forces for each filament
type when raised and lowered. The measured forces for the nylon fell on or near the
predictions made with the raw data, but the PTFE forces did not. When the tube-on-tube
friction and sliding resistance forces were used to correct the PTFE measured forces, the
results were within the prediction range. This suggests that the nested steel tube sliding
resistance effects were significant in the case of the PTFE but not the nylon. Table 3-5
and Table 3-6 show the percent differences between the measured values, adjusted
values, and predictions.
Design 1A 1B
1C
1D 2A 2B 2C 2DRaising Tension Forces - Nylon 2.5 Z 2.0 0
91-5
1.0 0.5 0.0 0 1 2 3 4 5 6 7 8 9 DesignFigure 3-16: Predicted max, min, measured and adjusted raising nylon forces
Lowering Tension Forces - Nylon
1.4 1.2 Q m
2
1F
aW
1.0 h-a 0.8 -0 0.6 C 0.4 - Max Prediction * Measured Forces - Min Prediction0.2 o Measured Corrected by Friction & Sliding Resistance
x Measured Corrected by Friction 0.0
0 1 2 3 4 5 6 7 8 9
Design
Figure 3-17: Predicted max, min, measured and adjusted lowering nylon forces
a
Ts
*l~
~I"?I
In
lJ
i
-Max Prediction
0 Measured Forces
-Min Prediction
o Measured Corrected by Friction & Sliding Resistance
x Measured Corrected by Friction ,, ... _.____
1 2 3 4 5 6 7
Raising Tension Forces - PTFE
1 2 3 4 5 6 7 8 9 Design
Figure 3-18: Predicted max, min, measured and adjusted raising PTFE forces
Lowering Tension Forces - PTFE
A@
- Max Prediction
U Measured Forces
-Min Prediction
o Measured Corrected by Friction & Sliding Resistance x Measured Corrected by Friction
3 4 5 6 7 8
0 1
Design
Figure 3-19: Predicted max, min, measured and adjusted lowering PTFE forces 2.0
z
0 o1.0 0.5 0.0 - Max Prediction U Measured Forces -- Min Prediction* Measured Corrected by Friction & Sliding Resistance
* Measured Corrected by Friction
1.8 1.6 1.4 z 1.2
i1.0
0 0.8 S0.6 0.4 0.2 0.0 -- T ~T- 1 -t I I i0i
Table 3-5: Comparison of measured, corrected and predicted forces using nylon filament Uncorrected Forces Raising Lowering In Range In Range -0.5% In Range In Range In Range -0.5% In Range -0.4% In Range In Range In Range In Range In Range -8.1% 8.2% Friction Corrected Forces Raising Lowering -5.3% 4.4% -7.7% 7.7% -5.0% 3.8% -7.2% 8.7% -7.4% 7.9% -4.8% 4.4% -6.0% 8.0% -14.8% 16.9% Sliding Resistance Corrected Forces Raising Lowering -4.6% 7.4% -5.6% 8.4% -2.3% 3.9% -5.0% 9.4% -5.7% 8.2% -2.9% 5.9% -4.1% 9.7% -12.1% 16.0% Table 3-6: Comparison of measured, corrected and predicted forces using PTFE filament
Friction Corrected Sliding Resistance Uncorrected Forces Forces Corrected Forces Design Raising Lowering Raising Lowering Raising Lowering
lA 18.4% -14.1% 10.7% -6.5% In Range 3.8%
lB 11.8% -8.3% 8.8% -0.5% In Range 1.3%
1C 11.8% -5.3% 2.0% In Range In Range 5.9%
ID 8.0% -2.0% 3.8% In Range In Range 4.7%
2A 8.6% In Range 1.2% In Range In Range 13.1%
2B 7.7% -1.9% 2.6% In Range In Range 7.4%
2C 12.1% -6.2% -2.6% In Range In Range 6.7% 2D In Range In Range In Range -6.3% -1.7% 7.9%
Factors that influence the sliding resistance include friction, resistance to bending
(E*I), hysteresis, and radial clearance. The friction tests showed that the PTFE has a
much lower friction coefficient than the nylon so that influence was ruled out. The
modulus of elasticity test showed that the resistance to bending of each filament was
comparable, eliminating the potential influence of that factor. The remaining potential
factors include the radial clearance and hysteresis of the materials. The nylon had a larger
radial clearance and little to no hysteresis properties making it easier to slide through the
tube. The PTFE on the other hand had noticeable hysteresis. During these tests, the PTFE
did not produce flat line results as did the nylon. Instead, particularly on the second half
of the test as the PTFE was returning to the zero position, the force decreased (visible in
Figure 3-15). This was observed in most of the PTFE tests, particularly when the same
filament had been used repeatedly. This trend may be attributed to the hysteresis of the
PTFE and can be explained by thinking of the PTFE taking on an initial shape inside the
tube. As it is pulled away from the starting position it is forced to take an increasingly
Design 1A 1B 1C 1D 2A 2B 2C 2D
different shape. Due to hysteresis, the PTFE resists changing shape. The contact force of
the filament against the inside of the tube increases as it advances through the tube.
Therefore, the effects of hysteresis result in lower contact forces at initial filament
movement in each direction of travel and increasing contact forces as the test progresses
(circled regions in Figure 3-15). This trend was also noticed in the earlier tension tests but
not understood until the horizontal sliding tests were completed.
It is important to remember that when the tension test direction changes from
raising to lowering the weight, Fin and Fout trade places (from the upper to lower parts of
the filament and vise versa). This switch causes a reversal in the equation and the results.
When this occurs, points that were near the upper predictions when being raised then
become near the lower predictions when being lowered (Figure 3-16 through Figure
3-19).
3.3.4 Discussion of Tension Results
The results from the tension tests show that the capstan equation can be used to
predict forces in filaments passing through tubes if error factors are taken into account.
The uncorrected nylon and corrected PTFE results closely approximated the predictions.
Correcting the measured forces caused the nylon results to move outside the predicted
range while subsequently moving the PTFE results into the predicted range. This may be
due to the hysteresis of the PTFE. In the case of the nylon, the tensile forces seem to
dominate the mechanics, simplifying the system to the standard capstan case. With the
PTFE, hysteresis added a significant effect to the tension test results. With these
corrections the PTFE values were all within 13% of the prediction, and most were within
7%. The nylon results were all within the predicted range. Based on the close correlation
of predicted and experimentally derived results, the capstan equation can be considered a
valid model.
3.4 Compression Tests of Filaments Inside Tubes with Curves
The compression test setup was similar to the tension setup and used nearly all the
same components. The primary difference was that an additional tube and load cell
replaced the weight (Figure 3-20). This load cell was attached to the foot of the setup
frame below and to a third pin vise above. This vise held the additional tube. These
additional pieces enabled a compressive load to be applied to the filament while being
measured by the two load cells. The forces were applied as the actuator moved.
Fin(the
applied compressive force) and Fout (the measured exiting compressive force) were
measured by the upper and lower load cells respectively. The added tube had a collar into
which the design tube was placed. This collar constrained the design tube laterally but did
not transmit axial forces to the lower load cell. For these tests the actuator was advanced
at a constant rate of 0.38 mm/sec until the input force reached 8.9 N.
During the compression experiments the nylon filaments did not last more than
about three tests before kinking. Kinking occurred where the filament passed from the
oversized tube into the design tube. In the oversized tube, the filament had less lateral
support and could catch the comer of the design tube. Once the nylon kinked it could not
be reused. Due to the limited quantity of the nylon filament, some design tubes were only
tested four times (instead of five). Kinking was not a problem with the PTFE because of
the higher moment of inertia, so five tests of each tube were completed.
Load cell
Pin Vise
ized Tube
e Pin Vise
Tube with
,nt Inside
Tube
Tube
Pin Vise
Load cell
Figure 3-20: CAD model of test setup
46
3.4.1 Compression Test Results
The same tubes tested in tension were also tested in compression. These
compression tests provided very consistent results for each tube tested. Each test started
with a flat force region while the filament advanced prior to contacting the lower load
cell. This can be seen in the first
0.5
cm of the test data in Figure 3-21. For the analysis
these data points were removed (Figure 3-22). Once contact (and compression) was
achieved, the input and output forces increased. The output forces tended to follow a near
parabolic path and generally leveled off near the end of each test, while the measured
input forces had no common shape. Due to the differences in the two materials and
geometries of the filaments, the actuator had to advance about twice as far with the nylon
as with the PTFE to reach the 8.9 N limit of each test. For the analysis both the original
and re-zeroed data (zeroing of the data where compression begins) were studied. Zeroing
was achieved by averaging the flat sections at the beginning of each test and subtracting
that value from the rest of the data points. Figure 3-23 shows a force vs. position plot of
zeroed values.
Or iginal For
ce
Measurements
TiB
R1.txt
Position
1Bcm)rn
MeasuredF6rces
T
1
B..lXt
Figure 3-23: 'Zeroed' Fin and Fout curves at beginning of compression loading for PTFE filament
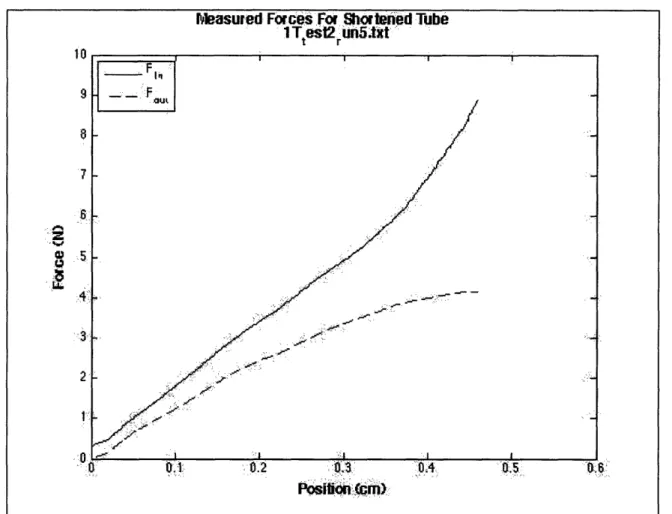
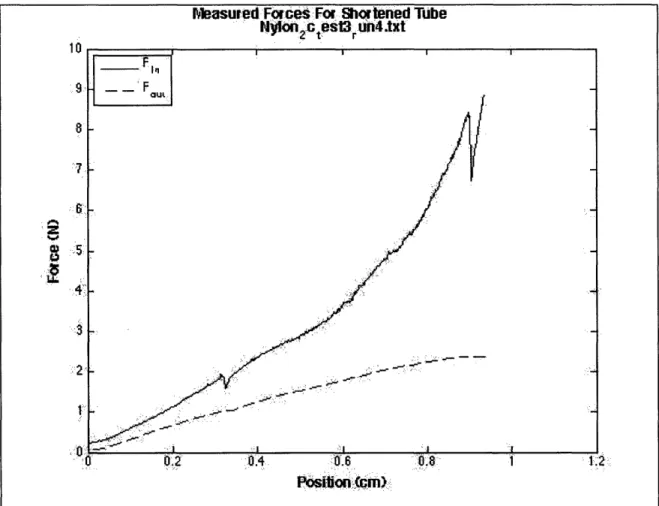
To study the effects of the length of the long straight section of the design tube,
two design tubes were shortened and tested. Designs 1C and 2C were selected for the
tests. Table 3-7 shows the original and shortened lengths of the straight section of the
design tubes. Each was tested
5
times at three shortened lengths with the PTFE filament.
The final tests were also repeated with the nylon filament. Typical results from these tests
can be seen in Figure 3-24 and Figure 3-25.
Table 3-7: Length of long straight sections of design tubes to test effect on output
Original Test 1 Test 2 Test 3
Lengths of Long Straight )
Design I C 11.7 10.5
9.0
7.3 Design 2C 11.1 9.8 8.4 6.7Re-zeroed Forces
STBR
1
xt
Poilo(cm);
Measured For ces For Shor tened
Tube
1
Ttes2run5.tIxt
•A 1U.. 7 1. 2•
:•o
••
PosiIib5Ofnm)
Figure 3-25: Typical results from shortened test 3 using tube design 2C and nylon filament
In order to develop a functional clutch system for testing on raw chicken breast,
nine additional tubes were made. The shapes of these tubes were selected to produce
lower lock-up forces than the original eight. These tubes were tested in compression to
ensure that the model remained valid. Each included two bends and were the same
diameter (OD 1.47 mm and ID 1.22 mm) and length (17.8 cm) as the original design
tubes. These tests were performed with the PTFE filament and repeated five times for
each tube. The design parameters of the new tubes are presented in Table 3-8. These tests
produced similarly shaped curves as the originals but with lower values of
Fout.
Measured For ces For
Shortened Tube
Table 3-8: Design parameters of new nine tubes tested
Design # of Bends Avg. Bend Radius (mm) Angular displacement (rad)
RO.5 A250 2 22.6 2.7123 RO.5 A300 2 20.7 3.4574 RO.5 A350 2 19.6 4.3547 RO.6 A250 2 26.2 2.6975 RO.6 A300 2 22.4 3.8198 RO.6 A350 2 23.7 4.1792 RO.7 A250 2 27.6 2.9556 RO.7 A300 2 29.4 3.3545 RO.7 A350 2 29.1 3.7416
3.4.2 Capstan Model Compression Analysis
The output forces on all of the tests produced similarly shaped curves. It was
determined that a second-order quadratic function closely approximated these curves.
Each output data set was fit with a quadratic function (Figure 3-26). The average and
standard deviations of the maximum values of each fit were found and recorded in Table
3-9. Table 3-10 and Table 3-11 contain the coefficients of the curve fit (Fout =
Figure 3-26: Fin vs. Fout with parabolic curve fit on Fout for nylon filament
Table 3-9: Maximum Fout values calculated from curve fits of data
Design Nylon Avg. (N) Nylon Stdev. PTFE Avg. (N) PTFE Stdev.
1A 2.69 0.16 5.03 0.24 1B 2.63 0.23 4.95 0.19 1C 2.43 0.31 4.73 0.33 1D 2.43 0.52 4.87 0.13 2A 2.58 0.42 5.05 0.23 2B 3.67 1.40 5.61 0.93 2C 2.73 0.38 5.20 0.34 2D 2.26 0.31 4.29 0.26
VMeasur ed
and
Pr edicted Fo ces
C
1BR 1tKt
97
A .-.'• 21
...3POition (cm)
Table 3-10: Fout curve-fit coefficients for nylon (Fout = A*x2+B*x+C) Design A B C lA -1.53 4.07 -0.04 IB -1.54 4.00 0.00 IC -1.43 3.70 0.00 ID -1.52 3.82 -0.06 2A -1.41 3.79 -0.01 2B -1.06 3.74 -0.05 2C -1.28 3.71 0.00 2D -1.52 3.71 -0.02
Table 3-11: Fout curve-fit coefficients for PTFE (Fout = A*x2+B*x+C)
Design A B C lA -11.14 15.06 -0.07 IB -11.84 15.50 -0.13 1C -10.33 14.09 -0.09 ID -10.07 14.21 -0.14 2A -11.98 15.53 -0.04 2B -6.96 12.38 -0.07 2C -8.86 13.55 -0.08 2D -12.23 14.69 -0.14
Another interesting method of comparison plotted the input forces against the
output forces. This created an efficient way to compare the capstan prediction to the
actual data. The capstan equation in these coordinates produces a straight line of slope
e(o* ). Using the maximum and minimum values of the angular displacement and friction
coefficient max and min prediction curves were expressed. Figure 3-27 shows a typical
Fin vs. Fout result and how it is similar to the predictions over a range but then diverges
Figure 3-27: Typical Fin vs Fo.t curve with capstan predictions for nylon filament
Initially the percent differences between the measured and predicted values were
studied for trends. Unfortunately there proved to be too much variation between tests and
designs to find anything conclusive.
Another point of interest was the slope of the measured curve. Theoretically, if
the measured curve was be modeled with the capstan prediction, similar slopes would be
found. To study this, the first and second derivatives of Fin vs. Fout were calculated to
determine where the measured curve diverged from the prediction. The break point was
determined to be where the first derivative significantly diverged from the prediction.
The cutoff value was chosen to be where the second derivate reached -0.2 (1/N
2). Figure
3-28 through Figure 3-30 show that point on the Fin vs. Fout, first and second derivatives
respectively.
2:.5
"2 ' 1:5 0 A. ..5Fi
Vs. F
outMeasuread
and
edicted
C1BR 1.txt
I I I I I
Measured Values
- - Max Capstan Prediction /
- Min Capstan Prediction
.. / ...:.
...
/1/..:
./.•
.
f" 1:.n i• I: .t i./ v ... .. . ... . . .. 1. 2 3 4 .5 :.6. 7 8 9 10F. (N)
InF.
inVs.
F
Out tMeasur
ed and R edicted
C
I; R .
1Bl.txt
In )
Figure 3-28: Plot of Fin vs Fot with cutoff point marked for nylon filament
2.
.z
Measured and Predicted First Derivatives
CB Rl.txt
-
.Measured
First Derivative
- - Capstan Predicted First Derivative
X: 2.001 V: .4332 I - I I i 1 2 3 4 5 F. (N)in 6 7 8 9 10
bleasured and
Predicted Second Derivatives
C B•
1
xt
1 0.80.6
S0.4 02 a, i• O1¸2C%
-0.2
0 L0i8~A-0.4
C
L -0.6 -0.8 -1IF. (N)
i nFigure 3-30: Plot Fin vs Fout second derivative with cutoff point marked for nylon filament
At this point of interest, Fin, Fout, Fin/Fout, and position values were recorded. The
following tables (Table 3-12 through Table 3-15) contain the averages of these values for
the zeroed and non-zeroed results for each filament. Each average was ranked highest
(being 1) to lowest (being 8) to show the trends in the data. For comparison to the
measured values, the tube design parameters angular displacement and average bend
radius with their associated ranks are shown in Table 3-16.
Table 3-12: Break point values for zeroed forces in nylon filament Fin (N) Average Rank 0.62 2 0.55 4 0.44 6 0.43 7 0.60 3 0.35 8 0.64 1 0.48 5 F /F,,,t uF t N) Average Rank 0.48 2 0.46 3 0.34 6 0.25 7 0.35 5 0.19 8 0.50 1 0.37 4 Average Rank 0.42 7 1.19 6 1.48 3 -4.24 8 2.63 2 4.11 1 1.25 5 1.33 4 Position (mm) Average Rank 0.14 2 0.12 4 0.10 6 0.09 7 0.13 3 0.09 8 0.16 1 0.12 5
Table 3-13: Break point values for zeroed forces in PTFE filament
Fin) Fout N) Position (mm) Fin /Fout
Design Average Rank Average Rank Average Rank Average Rank
lA 2.77 1 2.00 1 0.18 2 1.23 6 1B 1.56 5 1.09 5 0.10 5 1.30 3 IC 0.89 7 0.78 6 0.06 7 1.15 7 1D 2.71 2 1.93 2 0.19 1 1.24 5 2A 0.95 6 0.76 7 0.07 6 1.44 1 2B 1.69 4 1.20 4 0.12 4 1.11 8 2C 1.79 3 1.23 3 0.13 3 1.28 4 2D 0.47 8 0.44 8 0.04 8 1.38 2
Table 3-14: Break point values for measured forces in nylon filament
Fin (N) Fout N) Position (mm) Fin /Fout
Design Average Rank Average Rank Average Rank Average Rank
1A 1.01 2 0.70 3 2.01 2 1.43 6 IB 0.97 3 0.70 2 1.97 3 1.43 7 IC 0.86 5 0.56 5 1.68 4 1.74 2 ID 0.61 8 0.37 8 1.17 8 1.44 5 2A 0.89 4 0.58 4 1.66 5 1.61 3 2B 0.73 7 0.44 7 1.45 7 1.93 1 2C 1.07 1 0.77 1 2.30 1 1.34 8 2D 0.80 6 0.53 6 1.64 6 1.52 4 Design lA 1B