HAL Id: hal-01744808
https://hal.archives-ouvertes.fr/hal-01744808
Submitted on 25 May 2021
HAL is a multi-disciplinary open access
archive for the deposit and dissemination of
sci-entific research documents, whether they are
pub-lished or not. The documents may come from
teaching and research institutions in France or
abroad, or from public or private research centers.
L’archive ouverte pluridisciplinaire HAL, est
destinée au dépôt et à la diffusion de documents
scientifiques de niveau recherche, publiés ou non,
émanant des établissements d’enseignement et de
recherche français ou étrangers, des laboratoires
publics ou privés.
Distributed under a Creative Commons Attribution| 4.0 International License
Dynamics of H3K4me3 Chromatin Marks Prevails over
H3K27me3 for Gene Regulation during Flower
Morphogenesis in Arabidopsis thaliana
Julia Engelhorn, Robert Blanvillain, Christian Kröner, Hugues Parrinello,
Marine Rohmer, David Posé, Felix Ott, Markus Schmid, Cristel Carles
To cite this version:
Julia Engelhorn, Robert Blanvillain, Christian Kröner, Hugues Parrinello, Marine Rohmer, et
al..
Dynamics of H3K4me3 Chromatin Marks Prevails over H3K27me3 for Gene Regulation
during Flower Morphogenesis in Arabidopsis thaliana.
Epigenomes, MDPI, 2017, 1 (2), pp.8.
�10.3390/epigenomes1020008�. �hal-01744808�
epigenomes
ArticleDynamics of H3K4me3 Chromatin Marks Prevails
over H3K27me3 for Gene Regulation during Flower
Morphogenesis in Arabidopsis thaliana
Julia Engelhorn1,2 , Robert Blanvillain1, Christian Kröner3, Hugues Parrinello4, Marine Rohmer4, David Posé5,6, Felix Ott5, Markus Schmid5,7and Cristel C. Carles1,*
1 LPCV, CEA, CNRS, INRA, Université Grenoble-Alpes, BIG, 38000 Grenoble, France; J.Engelhorn@warwick.ac.uk (J.E.); Robert.blanvillain@univ-grenoble-alpes.fr (R.B.) 2 Present address: School of Life Science, University of Warwick, Coventry CV4 7AL, UK
3 Optical Engineering Group, School of Engineering, University of Warwick, Coventry CV4 7AL, UK; C.Kroner@warwick.ac.uk
4 MGX-Montpellier GenomiX, c/o Institut de Génomique Fonctionnelle, 141 rue de la Cardonille, 34094 Montpellier CEDEX 5, France; Hugues.Parrinello@mgx.cnrs.fr (H.P.);
marine.rohmer@gmail.com (M.R.)
5 Department of Molecular Biology, Max Planck Institute for Developmental Biology, 72074 Tübingen, Germany; dpose@uma.es (D.P.); felix.ott@cegat.de (F.O.); Markus.Schmid@umu.se (M.S.)
6 Present address: Instituto de Hortofruticultura Subtropical y Mediterránea, Universidad de Málaga–Consejo Superior de Investigaciones Científicas, Departamento de Biología Molecular y Bioquímica, Facultad de Ciencias, Universidad de Málaga, 29071 Málaga, Spain
7 Present address: Umeå Plant Science Centre, Department of Plant Physiology, Umeå University, S-901 87 Umeå, Sweden
* Correspondence: Christel.carles@univ-grenoble-alpes.fr; Tel.: +33-438-784-195; +33-635-595-734 Academic Editor: Etienne Bucher
Received: 15 April 2017; Accepted: 15 June 2017; Published: 29 June 2017
Abstract: Plant life-long organogenesis involves sequential, time and tissue specific expression of developmental genes. This requires activities of Polycomb Group (PcG) and trithorax Group complexes (trxG), respectively responsible for repressive Histone 3 trimethylation at lysine 27 (H3K27me3) and activation-related Histone 3 trimethylation at lysine 4 (H3K4me3). However, the genome-wide dynamics in histone modifications that occur during developmental processes have remained elusive. Here, we report the distributions of H3K27me3 and H3K4me3 along with expression changes, in a developmental series including Arabidopsis thaliana leaf and three stages of flower development. We found that chromatin mark levels are highly dynamic over the time series on nearly half of all Arabidopsis genes. Moreover, during early flower morphogenesis, changes in H3K4me3 prevail over changes in H3K27me3 and quantitatively correlate with expression changes, while H3K27me3 changes occur later. Notably, we found that H3K4me3 increase during the early activation of PcG target genes while H3K27me3 level remain relatively constant at the locus. Our results reveal that H3K4me3 predicts changes in gene expression better than H3K27me3, unveil unexpected chromatin mechanisms at gene activation and underline the relevance of tissue-specific temporal epigenomics.
Keywords: chromatin and expression dynamics; reproductive development; differentiation; ChIP-seq; RNA-seq
Epigenomes 2017, 1, 8 2 of 32
1. Introduction
Morphogenesis in plants relies on continuous and iterative production of new organs with specific functions. In annual plants like Arabidopsis thaliana, upon transition to the reproductive phase, flower primordia are produced at the flanks of the inflorescence meristem. In these primordia, stem cell activity is re-established and the newly formed flower meristems produce founder cells for the different floral organs [1]. These cell-fate specifications coincide with changes in the expression pattern of developmental regulators [2]. The LEAFY (LFY), APETALA 1 (AP1) and CAULIFLOWER (CAL) transcription factors (TF) specify floral meristem identity via activation of downstream regulators, which include several genes encoding MADS domain TF. Spatially restricted expression of these genes then induces the differentiation of stem cells into specific cell types for formation of the different floral organs, as described in the ABC(D)E model [3]. Several reports on epigenetic mutants indicate that this regulation occurs through changes in the chromatin state of the corresponding loci, such as post-translational modifications of histones [4]. Histone 3 trimethylation at lysine 27 (H3K27me3) is a repressive modification targeting developmental regulators in all higher eukaryotes and is catalysed by Polycomb Group (PcG) proteins [5–7]. Genome-wide studies of H3K27me3 distribution in whole seedlings revealed that this mark targets more than one fourth of all Arabidopsis genes [8–10], comprising tissue- or stage-specific regulators of the vegetative to reproductive transition, floral meristem identity genes and all above-mentioned floral homeotic genes. Activation of PcG-repressed genes is conducted by the conserved trithorax Group (trxG) proteins, involved in three main activation processes: (i) removal of repressive H3K27me3 marks; (ii) deposition of activation-associated Histone 3 trimethylation at lysine 4 (H3K4me3) marks; and (iii) chromatin remodelling to allow access of the transcriptional machinery [4,11,12].
Thus, PcG and trxG antagonistically ensure the correct spatial and temporal expression of developmental regulators, such as those involved in flowering-time and flower development [13–17]. As a consequence, H3K27me3 and H3K4me3 chromatin marks should be highly dynamic throughout developmental stages and cell-types in plants. However, most genome-wide studies were so far performed for one developmental stage and often in a mixture of tissues during vegetative development, yielding only a static view of chromatin states. Some comparative studies used endosperm-specific nuclei [18], meristem-enriched tissue [19], roots [10], or mature versus senescing leaves [20,21]. An early study of comparing two developmental stages was conducted in 2009 by Charron et al. [22] comparing histone mark targeting in skotomorphogenic and photomorphogenic seedlings. All studies showed differential H3K27me3 marking between tissues or stages, at thousands of genes. Additionally, several hundreds of genes display quantitative changes in H3K27me3 intensity between undifferentiated and differentiated tissue, without losing the mark completely [19,23]. Several genome-wide analyses revealed an anti-correlation between changes in gene expression and changes in H3K27me3, and oppositely, a positive correlation for the H3K4me3 mark [19,20]. Studies at single gene level provided evidence that correlative changes in these histone marks are rather a cause than a consequence of the transcriptional state [24,25].
Nevertheless, many questions concerning the mechanistic relationship between H3K27me3 and H3K4me3 marks and gene expression remain open such as (i) the quantitative dynamics of histone mark between consecutive developmental stages; (ii) the correlation extent between changes in H3K27me3, H3K4me3 and gene expression; (iii) and the chronology of changes in H3K27me3, H3K4me3 and expression. To obtain answers to these questions, we used the Arabidopsis “cauliflower” inducible system, which allows collecting meristem tissue from synchronized floral stages, in sufficient amounts for genome-wide analyses of chromatin and expression [26–29]. Thus, the system enables both tissue and stage specific analysis of chromatin marks. We resolved the dynamics of the H3K4me3 and H3K27me3 marks and their correlation with expression changes in vegetative, inflorescence meristem, early developing flower and developed inflorescence tissues. This allowed establishing a comprehensive view of antagonistic histone modification dynamics during flower development in relation to gene activation or repression. We found that both chromatin marks are
Epigenomes 2017, 1, 8 3 of 32
highly dynamic over development, with thousands of genes changing in their marking. H3K4me3 dynamics correlate quantitatively with expression changes, while pronounced H3K27me3 changes mostly occur later, with the exception of genes that are activated and required very early during flower morphogenesis, like SEPALLATA1-3 (SEP1-3), LFY and an organ boundary specifying gene (CUP-SHAPED COTYLEDON 1 (CUC1)). However, also for these genes, early changes in H3K27me3 are mild and less pronounced than H3K4me3 changes. Thus, we find that within the first two days of flower initiation, deposition of H3K4me3 is prevalent at gene activation, while strong reduction of H3K27me3 occurs at later stages. Together, our integrative analysis of histone marks and transcriptome provides a novel view on the mechanisms of gene regulation at the chromatin level.
2. Results
2.1. RNA-seq Reveals Specific Changes in Gene Expression during the Developmental Time Series
To assess the correlation between changes in expression patterns and dynamics of histone marks during early flower development, we employed the ap1cal 35S::AP1-GR floral induction system introduced in Wellmer et al. [26] (Figure 1A; Figure S1). This system allows harvesting synchronized flower buds along a developmental time course and insures (i) tissue homogeneity along the developmental time course; as well as (ii) sampling in sufficient amounts for chromatin immunoprecipitation (ChIP) [27–29].
The early time points we chose cover the initial steps of flower development during which flower buds emerge from the inflorescence meristem and further initiate the flower patterning program. During this period, cells undergo two distinct fate transitions, first establishing flower stem cell characteristics, followed by differentiation into founder cells for specific floral organs. A suitable time point to study the early events of flower formation is one at which (i) changes in expression are already detectable for important regulators of flower development; and (ii) floral organ identity genes did not reach their full expression level, to enable observation of transition states from repression to activation. In our experimental setup, two days after induction (t2) stands as the appropriate time point for investigating activation of floral organ identity genes and at which floral meristem identity is still present (Figure1B, [28]). Moreover, we previously showed using ChIP-PCR, that reduction of repressive H3K27me3 marks at the SEP3 locus is detectable at t2 [28] and thus decided to perform ChIP-seq for H3K27me3 and H3K4me3 and RNA-seq on a tissue series consisting of wild-type leaf (L) and inflorescence (I), and ap1cal 35S::AP1-GR t0 and t2 samples.
Clustering analysis of expression data for selected floral regulators (flowering time, flower development) detected five major groups of expression during the series (Figure1C–E). The assignment of the genes to the clusters revealed that the observed expression patterns are in accordance with known functions of floral regulator genes. It also confirms the t2 time-point as an intermediate stage during the activation of floral organ and meristem identity genes (AppendixA.1).
Genome-wide analysis of differentially expressed genes (DEG) showed that most genes changed from L to I, emphasizing the different nature of the two tissues. 251 genes are up-regulated from t0 to t2, among them many developmental regulators like SEP2, SEP3, FLOWERING LOCUS T (FT), UNUSUAL FLORAL ORGANS (UFO), AP3, AG, PI, AGAMOUS-LIKE 15 (AGL15), LFY and CUC1, while 448 are down-regulated (Table1, Table S1). K-means clustering and Gene Ontology (GO) analysis revealed that the gene expression is highly dynamic throughout the series and correlates with expected functionality of the tissues on a genome-wide scale (AppendicesA.2andA.3). Thus, RNA-seq analysis demonstrates transcriptome dynamics throughout the tested tissue series and validates the suitability of the selected tissue types and time-points to study the influence of chromatin marks on gene expression.
Epigenomes 2017, 1, 8 4 of 32
Epigenomes 2017, 2, 1 4 of 33
Figure 1. Experimental setup and assessment of the floral induction system. (A) Tissue types and time‐points employed in the study. dai: days after induction. Dex: dexamethasone; (B) RT‐PCR analysis of expression of the MADS floral genes AG, SEP3, AP3, as well as the flower marker gene LFY and the inflorescence and flower marker gene ULTRAPETALA1 (ULT1), at t0, 6 h (t = 6 h) and 2 days (t2) after dex induction. EF1α is used as internal control. Wild‐type (WT) leaf tissue serves as control state in which floral organ identity genes are not expressed (L). Cauliflower‐like inflorescences of ap1cal mutant plants (ac) serve as control on the inherent leakage of the induction system. Dissected WT inflorescences contain flowers up to stage 12 (I). The expression analysis showed no or only very low expression of AP3, AG, and SEP3 homeotic genes prior to dex application, validating the experimental conditions. Strong up‐regulation of MADS floral genes occurs at t2 and not at 6 h after induction. Red arrows point at the samples analysed by RNA‐seq and ChIP‐seq in this study; (C) Hierarchical clustering analysis for expression patterns of selected floral organ regulators, determined by RNA‐seq. Relative expression values are expressed as z‐scores to reveal similarities in expression patterns. Z‐scores are represented by a heat map from blue (low expression in comparison to the other tissues) to red (high expression in comparison to the other tissues). Five major groups are visible; (D) Result of k‐means clustering analysis with k = 5 to generate an overview of expression profiles in the five clusters marked in C. The grey lines represent the single genes in the cluster. Averages of z‐scores in each cluster are depicted in red; (E) Detailed view of each cluster showing normalised absolute expression values in a heat map from yellow (no expression) to red (highest expression). The black dot indicates the highest expression value reached by a gene in the sample series. The highest displayed expression value corresponds to the highest observed value in the set (SOC1, L sample, with the exception of AP1, which is expressed from the 35S::AP1‐GR transgene).
ap1cal 35S::AP1-GR
floral induction system
RNA extraction for gene expression (RNA-seq) Chromatin Immuno-precipitation for histone marks (ChIP-seq)
Final induction product L t0 t2 I Leaf t=0 +dex t=2dai
A
B
AG EF1 AP3 SEP3 LFY ULT1 t2 t=6h t0 WT L I ap1cal AP1-GR acE
C
D
Figure 1. Experimental setup and assessment of the floral induction system. (A) Tissue types and time-points employed in the study. dai: days after induction. Dex: dexamethasone; (B) RT-PCR analysis of expression of the MADS floral genes AG, SEP3, AP3, as well as the flower marker gene LFY and the inflorescence and flower marker gene ULTRAPETALA1 (ULT1), at t0, 6 h (t = 6 h) and 2 days (t2) after dex induction. EF1α is used as internal control. Wild-type (WT) leaf tissue serves as control state in which floral organ identity genes are not expressed (L). Cauliflower-like inflorescences of ap1cal mutant plants (ac) serve as control on the inherent leakage of the induction system. Dissected WT inflorescences contain flowers up to stage 12 (I). The expression analysis showed no or only very low expression of AP3, AG, and SEP3 homeotic genes prior to dex application, validating the experimental conditions. Strong up-regulation of MADS floral genes occurs at t2 and not at 6 h after induction. Red arrows point at the samples analysed by RNA-seq and ChIP-seq in this study; (C) Hierarchical clustering analysis for expression patterns of selected floral organ regulators, determined by RNA-seq. Relative expression values are expressed as z-scores to reveal similarities in expression patterns. Z-scores are represented by a heat map from blue (low expression in comparison to the other tissues) to red (high expression in comparison to the other tissues). Five major groups are visible; (D) Result of k-means clustering analysis with k = 5 to generate an overview of expression profiles in the five clusters marked in C. The grey lines represent the single genes in the cluster. Averages of z-scores in each cluster are depicted in red; (E) Detailed view of each cluster showing normalised absolute expression values in a heat map from yellow (no expression) to red (highest expression). The black dot indicates the highest expression value reached by a gene in the sample series. The highest displayed expression value corresponds to the highest observed value in the set (SOC1, L sample, with the exception of AP1, which is expressed from the 35S::AP1-GR transgene).
Epigenomes 2017, 1, 8 5 of 32
Table 1.Numbers of differentially expressed genes (DEGs). Number of DEGs found in the different comparisons between tissues/time points and their overlap with each other. The grey diagonal displays the number of DEGs in one comparison, the white fields indicate the overlap with respective other comparisons. Activation L < I L < t0 L < t2 t0 < I t2 < I t0 < t2 L < I 4910 L < t0 2835 4215 L < t2 2832 3865 4246 t0 < I 1496 154 181 3915 t2 < I 1581 188 144 3252 4530 t0 < t2 96 61 118 131 59 251 Repression L > I L > t0 L > t2 t0 > I t2 > I t0 > t2 L > I 4629 L > t0 3913 5683 L > t2 3966 5170 5964 t0 > I 186 65 98 1252 t2 > I 145 54 40 930 1365 t0 > t2 194 199 281 105 33 448
L: leaf; I: inflorescence; t0: before induction t2: two days after induction
2.2. Meristem and Differentiated Tissues Share Similar Over-All Distribution of H3K27me3 and H3K4me3 Marks
We performed quantitative ChIP-seq analysis for repression-associated H3K27me3 and activation-associated H3K4me3 marks in the same tissue samples as employed for the transcriptome analysis (L, I, t0 and t2) (AppendixA.4). The average expression values of H3K27me3 target genes are lower compared to all Arabidopsis genes, while H3K4me3 target genes display a higher average expression. This is true for all analysed tissue types and in accordance with H3K27me3 and H3K4me3 being associated with repressed and active expression states, respectively (Table S3).
Mark abundance distributions over loci for both marks is comparable to previous reports [8–10,30]: H3K27me3 is spread over the whole transcribed region, into the promoter and the 30 UTR, while H3K4me3 is more concentrated to the transcription start site (TSS), covering the proximal promoter and the 50region of the gene (Figure2A).
When sorted by H3K4me3 abundance and assessed for expression in the four tissues (Figure2A), three main categories of genes emerge: First, highly expressed H3K4me3-marked genes with a strong correlation between expression levels and both intensity and spread of the H3K4me3 signal. Second, lowly expressed genes that carry low H3K4me3 levels and high H3K27me3 levels. Many genes in this group display higher expression in the differentiated L and I samples than in the meristematic tissue. This is in line with the previous observation that expression patterns of H3K27me3 target genes are more tissue specific than other genes [8]. Third, genes with low marking in both marks. Interestingly, this is the group of genes with the lowest expression, probably representing genes carrying other repressive marks like DNA methylation or H3K9me2. These distributions are observed for all tissues including the meristematic stages t0 and t2, indicating that plant inflorescence meristems share similar overall H3K27me3 and H3K4me3 marking with differentiated cells but differ in the quantitative abundance of the marks.
Epigenomes 2017, 1, 8 6 of 32
Epigenomes 2017, 2, 1 6 of 33
Figure 2. Genome‐wide H3K27me3 and H3K4me3 distribution over loci and quantitative changes in H3K27me3 or/and H3K4me3 marks in the tissue series. (A) Heat maps showing expression values and H3K4me3 and H3K27me3 abundance for all Arabidopsis genes in all four tissues of the developmental series. Genes are ordered by the average H3K4me3 signal over the gene (transcription start site (TSS) to transcription stop) at t0. Expression data is displayed as an average of three biological replicates, histone mark data is derived from one replicate. We saw the same tendencies in
A
C
B
Figure 2.Genome-wide H3K27me3 and H3K4me3 distribution over loci and quantitative changes in H3K27me3 or/and H3K4me3 marks in the tissue series. (A) Heat maps showing expression values and H3K4me3 and H3K27me3 abundance for all Arabidopsis genes in all four tissues of the developmental series. Genes are ordered by the average H3K4me3 signal over the gene (transcription start site (TSS) to transcription stop) at t0. Expression data is displayed as an average of three biological replicates, histone mark data is derived from one replicate. We saw the same tendencies in the other replicate; (B) Genome browser view of H3K27me3 and H3K4me3 distribution on the SEP1 and SEP2 loci in ap1cal 35S::AP1-GR at t0, t2 and in fully expanded inflorescences. Pictures are generated from one replicate; (C) Numbers of significantly differentially marked genes (DMG) for H3K27me3 and H3K4me3. FPKM: fragments per kilobase of exon per million fragments mapped.
Epigenomes 2017, 1, 8 7 of 32
2.3. H3K27me3 and H3K4me3 Levels are Highly Dynamic over the Time Series, in Accordance with Tissue Functionality
The examples of histone mark distribution over two important floral organ identity gene loci (SEP1 and SEP2) for t0, t2 and I (Figure2B) indicate the presence of quantitative changes during flower morphogenesis. Particularly for H3K27me3, these changes are subtle but span a wide range of the marked region.
Genome-wide determination of differentially marked genes (DMGs) for the L-t0, L-I, t0-t2, t0-I and t2-I comparisons revealed that thousands of genes display quantitative change in H3K27me3 and H3K4me3 marks (Figure2C, Table S4). In the case of very different tissue types (L-t0 or L-I), more than 60% or 45% of the corresponding target genes, show changes in H3K27me3 or H3K4me3 respectively. Noticeably, the vast majority of genes showing an elevation of any of the two marks from L to t0 shows a reduction of the same mark from t0 or t2 to I, and vice versa (Table S4, Figure S7), indicating that these changes are meristem specific.
For several hundred genes we detected changes in both antagonistic marks in opposite directions (H3K27me3 elevated and H3K4me3 reduced or vice-versa), while only few genes (none for the t0-t2 comparison) changed in the same direction for both marks (Table S4).
Our quantitative analysis allowed to specifically identify genes with marks changing in the two first days of flower initiation, from t0 to t2 (early flower morphogenesis). Among these, 13 DMGs change in both marks towards activation (H3K27me3 reduced, H3K4me3 elevated) and 15 towards repression (H3K27me3 elevated, H3K4me3 reduced) (Table2). These changes relate to coordinated activation or repression of key genes for flower development (AppendixA.5).
A GO analysis further revealed that the functions of the H3K27me3 and H3K4me3 DMGs in the series correlate with the functionality of the tissues at the analysed time-points (AppendixA.6). 2.4. DMGs Largely Overlap with DEGs and Histone Mark Changes Are Stronger among DEGs
To evaluate if changes in repressive or active histone marks correlate with changes in expression of the corresponding loci, we determined the fractions of differentially up- and down-regulated genes that display changes in histone mark abundance (Figure3).
For most comparisons, including all for H3K4me3, expression changes occur more frequently in the expected direction (up-regulation for elevated H3K4me3 and reduced H3K27me3 and vice-versa). This is especially true when comparing t0 to t2. In all cases, the number of DEG in the expected direction is significantly higher among DMGs than for all targets (based on a hypergeometric distribution with probability cut-off of 0.01). With the exception of the L to I comparison, DMGs in both marks display a higher percentage of DEGs compared to DMGs in one mark. These findings are significant for all cases in the expected direction with the exception of t0-t2 in the activation direction (based on a hyper-geometric distribution with probability cut-off of 0.01), indicating that combined changes in both marks are more prone to coincide with changes in expression.
Since transcription is initiated by the assembly of the pre-initiation complex (PIC) near the TSS of a gene, histone marks might primarily change at this region to allow activation or repression of transcription. We thus analysed the marks average distribution along the locus for genes displaying changes during induction of flower development (DMG from t0 to t2 or I) (Figure4). The t0-t2 and t0-I differences are clearly visible among the DMGs and occur rather uniformly over the covered regions than locally, except for a stronger change at the peak close to the TSS for H3K4me3 in the t0-t2 activation comparison. Changes in H3K4me3 are stronger when DEG subsets are considered, while for H3K27me3 this is only true for the t0-I activated genes and the t0-t2 repressed genes.
Epigenomes 2017, 1, 8 8 of 32
Epigenomes 2017, 2, 1 8 of 33
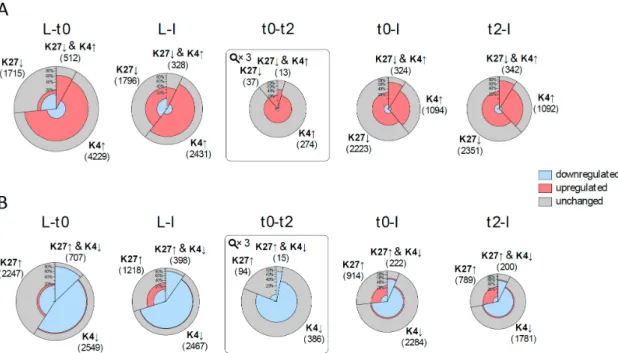
Figure 3. Correlation of changes in histone marks and expression changes prior to and during flower development. For each comparison between tissues/time points, two pies are drawn: (A) one
for changes in histone marks which are expected to be correlated with activation (elevation (↑) of H3K4me3, reduction (↓) of H3K27me3); and (B) one for repression. The size of the pie circle represents the number of genes (for t0‐t2 the size is zoomed three times) and is partitioned into three sectors, which sizes correspond to the number of genes changing in H3K4me3 (K4), H3K27me3 (K27) or both. Each sector is coloured according to the number of differentially expressed genes (DEGs) (from inside to outside: down‐regulated genes (blue), up‐regulated genes (red) and genes with no significant change in expression (grey).
Figure 3. Correlation of changes in histone marks and expression changes prior to and during flower development.For each comparison between tissues/time points, two pies are drawn: (A) one for changes in histone marks which are expected to be correlated with activation (elevation (↑) of H3K4me3, reduction (↓) of H3K27me3); and (B) one for repression. The size of the pie circle represents the number of genes (for t0-t2 the size is zoomed three times) and is partitioned into three sectors, which sizes correspond to the number of genes changing in H3K4me3 (K4), H3K27me3 (K27) or both. Each sector is coloured according to the number of differentially expressed genes (DEGs) (from inside to outside: down-regulated genes (blue), up-regulated genes (red) and genes with no significant change in expression (grey).
Epigenomes 2017, 2, 1 9 of 33
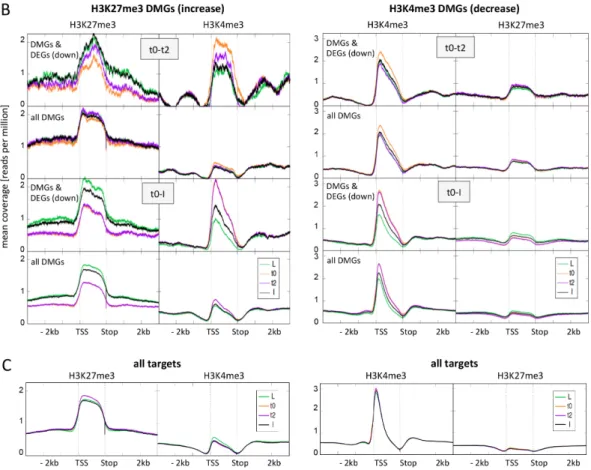
Figure 4. Average distribution of H3K27me3 and H3K4me3 over differentially marked genes (DMGs) during flower morphogenesis and at all target genes. (A) Average distribution of H3K27me3 and H3K4me3 over H3K27me3 DMGs (left panel) and H3K4me3 DMGs (right panel) changing in activation direction (reduced H3K27me3, elevated H3K4me3). For both early (t0‐t2) and later (t0‐I) DMGs we first depicted the distribution for those DMGs that are also DEGs (up‐regulated) and below the distribution for all DMGs at this time point; (B) Average distribution of H3K27me3 and H3K4me3 over H3K27me3 DMGs (left panel) and H3K4me3 DMGs (right panel) changing in repression direction (elevated H3K27me3, reduced H3K4me3). For both early (t0‐t2) and later (t0‐I) DMGs we first depicted the distribution for those DMGs that are also DEGs (down‐regulated) and below the distribution for all DMGs at this time point; (C) Average distribution of H3K27me3 and H3K4me3 over all H3K27me3 target genes (left panel) and all H3K4me3 target genes (right panel). Genes are scaled to the same length (1500 bins), only the second replicate is displayed here. We saw the same tendencies in the first replicate.
Epigenomes 2017, 1, 8 9 of 32
Epigenomes 2017, 2, 1 9 of 33
Figure 4. Average distribution of H3K27me3 and H3K4me3 over differentially marked genes (DMGs) during flower morphogenesis and at all target genes. (A) Average distribution of H3K27me3 and H3K4me3 over H3K27me3 DMGs (left panel) and H3K4me3 DMGs (right panel) changing in activation direction (reduced H3K27me3, elevated H3K4me3). For both early (t0‐t2) and later (t0‐I) DMGs we first depicted the distribution for those DMGs that are also DEGs (up‐regulated) and below the distribution for all DMGs at this time point; (B) Average distribution of H3K27me3 and H3K4me3 over H3K27me3 DMGs (left panel) and H3K4me3 DMGs (right panel) changing in repression direction (elevated H3K27me3, reduced H3K4me3). For both early (t0‐t2) and later (t0‐I) DMGs we first depicted the distribution for those DMGs that are also DEGs (down‐regulated) and below the distribution for all DMGs at this time point; (C) Average distribution of H3K27me3 and H3K4me3 over all H3K27me3 target genes (left panel) and all H3K4me3 target genes (right panel). Genes are scaled to the same length (1500 bins), only the second replicate is displayed here. We saw the same tendencies in the first replicate.
Figure 4.Average distribution of H3K27me3 and H3K4me3 over differentially marked genes (DMGs) during flower morphogenesis and at all target genes. (A) Average distribution of H3K27me3 and H3K4me3 over H3K27me3 DMGs (left panel) and H3K4me3 DMGs (right panel) changing in activation direction (reduced H3K27me3, elevated H3K4me3). For both early (t0-t2) and later (t0-I) DMGs we first depicted the distribution for those DMGs that are also DEGs (up-regulated) and below the distribution for all DMGs at this time point; (B) Average distribution of H3K27me3 and H3K4me3 over H3K27me3 DMGs (left panel) and H3K4me3 DMGs (right panel) changing in repression direction (elevated H3K27me3, reduced H3K4me3). For both early (t0-t2) and later (t0-I) DMGs we first depicted the distribution for those DMGs that are also DEGs (down-regulated) and below the distribution for all DMGs at this time point; (C) Average distribution of H3K27me3 and H3K4me3 over all H3K27me3 target genes (left panel) and all H3K4me3 target genes (right panel). Genes are scaled to the same length (1500 bins), only the second replicate is displayed here. We saw the same tendencies in the first replicate.
Notably, DMGs in one mark (regardless if H3K27me3 or H3K4me3) show a higher abundance of the other mark compared to all target genes, and especially DMGs changing in expression. This indicates that these DMGs are in a transition state. For H3K27me3 DMGs genes, a change in H3K4me3 abundance is visible in the opposite direction for all comparisons, and this change is stronger for genes changing in expression. This is in accordance with our observation that genes changing in both marks more frequently display changes in expression than genes changing in one mark.
Taken together, our analysis of DMGs and DEGs established a relation between H3K27me3/ H3K4me3 dynamics and changes in expression during flower development. Furthermore, it shows that during early stages of flower morphogenesis, H3K4me3 dynamics affects more genes and is in general more strongly correlated with expression changes than H3K27me3 dynamics.
Epigenomes 2017, 1, 8 10 of 32
2.5. Expression Changes during Early Flower Morphogenesis Quantitatively Correlate with Changes in H3K4me3 While Changes in H3K27me3 Mostly Occur after Prolonged Expression Changes
Next, we aimed to test for a quantitative correlation between histone mark changes and expression changes. For this, we mainly focused our analysis on the genes changing during early flower morphogenesis (t0 to t2) as these constitute the most homogenous tissue samples, and because genes changing in this time frame are highly dynamic and comprise many important developmental regulators. A clear correlation was observed between H3K4me3 changes and expression changes: mark changes are of higher intensity, of wider spread, and greater towards the TSS for genes with stronger expression changes (Figure5A).
Epigenomes 2017, 2, 1 11 of 33
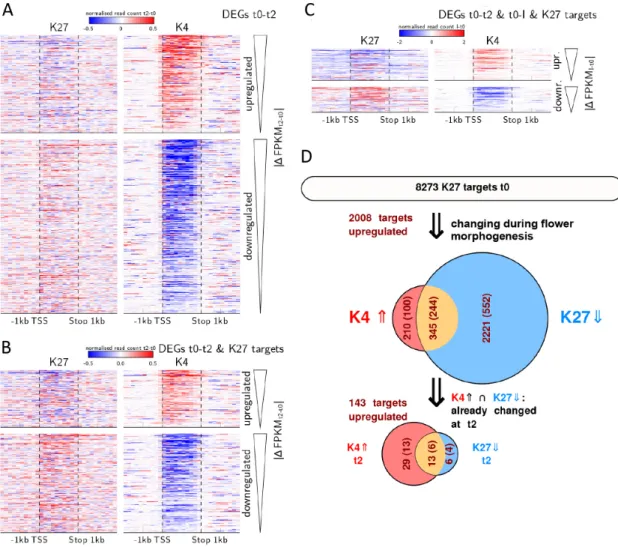
Figure 5. Quantitative changes in H3K4me3 correlate with gene expression dynamics and are
prevalent during early flower morphogenesis. (A–C) Heat maps displaying the average change in histone mark abundance (in reads per million) calculated as the difference between the earlier and the later compared time point in 200 bp windows/10% bins over the gene (i.e., t2 minus t0 or I minus t0). Each line in the heat map represents a DEG, genes are sorted by their difference in expression value (t2 minus t0 or I minus t0) starting with the strongest up‐ or down regulated gene, respectively; (D) Flow chart of histone marks and expression changes during activation of H3K27me3 targets in the process of flower morphogenesis. Only genes marked with repressive H3K27me3 marks at t0 are considered. The upper Venn‐diagram shows all genes changing during flower morphogenesis (that is genes that change either from t0 to t2, t0 to I or both) with fraction of those genes changes in expression (dark red numbers in ()), in H3K27me3 (blue fraction), in H3K4me3 (red fraction) or both (orange). The lower Venn‐diagram shows all genes that change in both marks (345 genes) which already show activation related changes in marks and expression from t0 to t2. 2.6. Early Activation of PcG Target Genes is Mainly Accomponied by H3K4me3 Changes Many regulators of flower development are known to be H3K27me3 targets and regulated by antagonising trxG and PcG factors [8, 31]. Therefore, we were interested to see whether changes in genes that will eventually significantly loose H3K27me3 and gain H3K4me3 are also characterised by H3K4me3 dynamics during early flower morphogenesis. We analysed DMGs that are targets of H3K27me3 at t0 in more detail (Figure 5D). Of these 8273 H3K27me3 target genes, 2776 become differentially methylated in one of the marks or both during flower morphogenesis i.e., from t0 to t2 and/or from t0 to I. The majority of them show only reduction in H3K27me3 (2221 genes), while 210
Figure 5.Quantitative changes in H3K4me3 correlate with gene expression dynamics and are prevalent during early flower morphogenesis. (A–C) Heat maps displaying the average change in histone mark abundance (in reads per million) calculated as the difference between the earlier and the later compared time point in 200 bp windows/10% bins over the gene (i.e., t2 minus t0 or I minus t0). Each line in the heat map represents a DEG, genes are sorted by their difference in expression value (t2 minus t0 or I minus t0) starting with the strongest up- or down regulated gene, respectively; (D) Flow chart of histone marks and expression changes during activation of H3K27me3 targets in the process of flower morphogenesis. Only genes marked with repressive H3K27me3 marks at t0 are considered. The upper Venn-diagram shows all genes changing during flower morphogenesis (that is genes that change either from t0 to t2, t0 to I or both) with fraction of those genes changes in expression (dark red numbers in ()), in H3K27me3 (blue fraction), in H3K4me3 (red fraction) or both (orange). The lower Venn-diagram shows all genes that change in both marks (345 genes) which already show activation related changes in marks and expression from t0 to t2.
Epigenomes 2017, 1, 8 11 of 32
As H3K4me3 changes are on average slightly stronger at the TSS, we further considered all DEGs that change early but remain DEGs in the same direction for the t0 to I comparison, thus allowing to follow activation at early and later stages. For those genes, we analysed the average distribution of changes from t0 to t2 and from t2 to I, over their locus (Figure S8). A clear shift from the TSS towards further downstream region is visible from early to late changes for up-regulated genes, indicating that H3K4me3 changes occur mainly at the TSS during early activation but then spread more into the locus. For down-regulation, the opposite effect is observed but less pronounced.
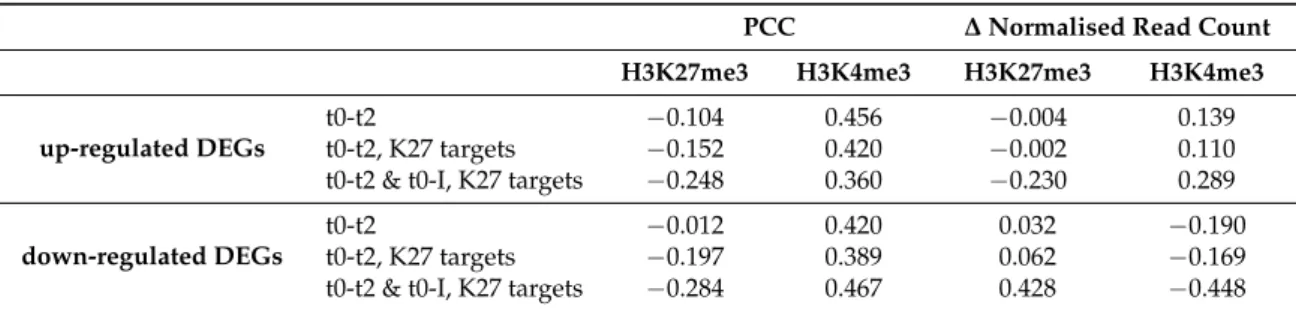
For H3K27me3, very little correlation between expression changes and mark changes is observed for all DEGs from t0 to t2. This could be due to only some of the DEGs being H3K27me3 targets, while H3K4me3 marks target more genes. Therefore, we considered only those among the early DEGs that are H3K27me3 targets (147 of 251 up-regulated DEGs and 255 of 448 down-regulated DEGs). We again, could observe only a slight or no preference for changes in the expected direction for down-regulated and up-regulated DEGs, respectively. Furthermore, the correlation with the intensity in expression change rank is also much lower than for H3K4me3 (Figure 5B, Table 3). Only when considering H3K27me3 target genes that had been up- or down-regulated for a longer time (i.e., DEGs which expression changed early but remained in the same direction for the t0 to I comparison, 80 up-regulated DEGs and 65 down-regulated DEGs), we could observe a clear prevalence of changes in the expected direction (Figure5C, Table3). Especially for activated genes of this category, the H3K27me3 signal changes over the whole locus including the promoter region for most genes and the change is more pronounced for genes with higher expression changes. This indicates that changes in H3K27me3 rather occur after prolonged changes in expression and is in accordance with a low number of H3K27me3 DMGs during early flower morphogenesis. However, there are some changes in H3K27me3 already observed for the t0 to t2 comparison (e.g., the MADS developmental regulators SEP1-3). We hypothesised that these genes might be very early activated/repressed genes. Indeed, we found that most DEGs with high average H3K27me3 change in the expected direction displayed already an increase/decrease in expression during the first day of flower development as determined by Wellmer et al. [26] (Figure S9).
Taken together, during flower morphogenesis, we observe that H3K4me3 dynamics are strongly predictive of expression changes, while H3K27me3 changes are rather predicted by already on-going or recently happened expression changes (AppendixA.7).
2.6. Early Activation of PcG Target Genes is Mainly Accomponied by H3K4me3 Changes
Many regulators of flower development are known to be H3K27me3 targets and regulated by antagonising trxG and PcG factors [8,31]. Therefore, we were interested to see whether changes in genes that will eventually significantly loose H3K27me3 and gain H3K4me3 are also characterised by H3K4me3 dynamics during early flower morphogenesis. We analysed DMGs that are targets of H3K27me3 at t0 in more detail (Figure5D). Of these 8273 H3K27me3 target genes, 2776 become differentially methylated in one of the marks or both during flower morphogenesis i.e., from t0 to t2 and/or from t0 to I. The majority of them show only reduction in H3K27me3 (2221 genes), while 210 show only elevation in H3K4me3. The 345 genes that show a change in both marks are suitable to address the question of which mark is changed first. We thus further considered the sub-population of these 345 genes, which show changes in marks during early activation, i.e., from t0 to t2 (48 genes). Among these, the proportions of changes in marks are inverted compared to all genes changing during flower morphogenesis: 6 genes change only in H3K27me3, 13 change in both marks (corresponding to the 13 genes discussed above and mentioned in Table2) and the majority (29 genes) changes only in H3K4me3. This again indicates that during initiation of flower development (t0-t2) genes carrying H3K27me3 can display an increase in H3K4me3 without significantly changing in their H3K27me3 level within the observed tissue. Such effects have been shown also for stress-induced transcription at single gene level [32].
Epigenomes 2017, 1, 8 12 of 32
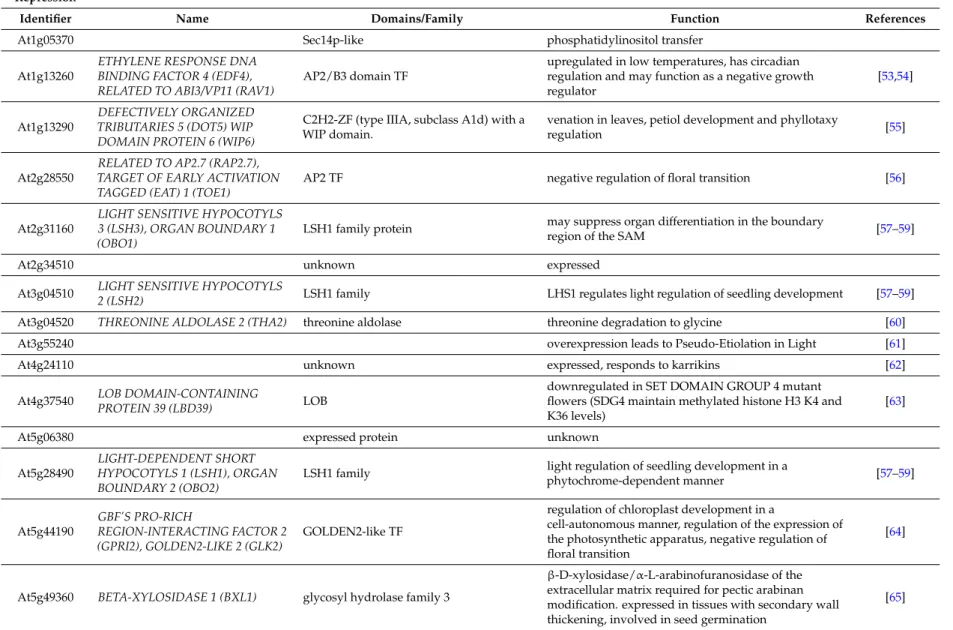
Table 2.Function of differentially marked genes (DMGs) where marks change towards activation or repression.
Activation
Identifier Name Domains/Family Function References
At1g30840 PURINE PERMEASE 4 (PUP4) Member of a family of proteins related to
PUP1, a purine transporter putative purine transporter [33]
At1g45145
LOCUS OF INSENSITIVITY TO VICTORIN 1 (LIV1),
THIOREDOXIN H-TYPE 5 (TRX-H5)
cytosolic thioredoxin response to biotic and abiotic stimuli [34–37]
At1g47610 Transducin/WD40 repeat-like superfamily protein
unknown, known to be upregulated upon induction of
AG function after 3 days [38]
At1g75490 DEHYDRATION-RESPONSIVE ELEMENT
BINDING (DREB) A-2 ERF/AP2 TF family DREB2A and DREB2B involved in drought response [39,40]
At1g80110 PHLOEM PROTEIN 2-B11
(PP2-B11) putative carbohydrate binding [41]
At3g02310 SEPALLATA 2 (SEP2) MADS TF floral organ identity specification [42,43] At4g32990 Transducin/WD40 repeat-like superfamily
At4g34230 CINNAMYL ALCOHOL
DEHYDROGENASE 5 (CAD5) catalytically active cinnamyl alcohol dehydrogenase [44] At4g36930 SPATULA (SPT) bHLH TF carpel development and seed dormancy regulation [45,46]
LACCASE 10 (LAC10) putative laccase [47]
At5g10510 AINTEGUMENTA-LIKE 6 (AIL6),
PLETHORA 3 (PLT3) AP2 domain TF
proliferation and differentiation in flowers, root stem cell identity, promote PIN1 expression and modulate local auxin production in phyllotaxis of the apex
[48,49]
At5g15800 SEPALLATA 1 (SEP1) MADS TF floral organ identity specification [42,43] At5g61850 LEAFY (LFY) floral meristem identity control [50–52]
Epigenomes 2017, 1, 8 13 of 32
Table 2. Cont.
Repression
Identifier Name Domains/Family Function References
At1g05370 Sec14p-like phosphatidylinositol transfer At1g13260
ETHYLENE RESPONSE DNA BINDING FACTOR 4 (EDF4), RELATED TO ABI3/VP11 (RAV1)
AP2/B3 domain TF
upregulated in low temperatures, has circadian regulation and may function as a negative growth regulator
[53,54]
At1g13290
DEFECTIVELY ORGANIZED TRIBUTARIES 5 (DOT5) WIP DOMAIN PROTEIN 6 (WIP6)
C2H2-ZF (type IIIA, subclass A1d) with a WIP domain.
venation in leaves, petiol development and phyllotaxy
regulation [55]
At2g28550
RELATED TO AP2.7 (RAP2.7), TARGET OF EARLY ACTIVATION TAGGED (EAT) 1 (TOE1)
AP2 TF negative regulation of floral transition [56]
At2g31160
LIGHT SENSITIVE HYPOCOTYLS 3 (LSH3), ORGAN BOUNDARY 1 (OBO1)
LSH1 family protein may suppress organ differentiation in the boundary
region of the SAM [57–59]
At2g34510 unknown expressed
At3g04510 LIGHT SENSITIVE HYPOCOTYLS
2 (LSH2) LSH1 family LHS1 regulates light regulation of seedling development [57–59] At3g04520 THREONINE ALDOLASE 2 (THA2) threonine aldolase threonine degradation to glycine [60] At3g55240 overexpression leads to Pseudo-Etiolation in Light [61]
At4g24110 unknown expressed, responds to karrikins [62]
At4g37540 LOB DOMAIN-CONTAINING
PROTEIN 39 (LBD39) LOB
downregulated in SET DOMAIN GROUP 4 mutant flowers (SDG4 maintain methylated histone H3 K4 and K36 levels)
[63]
At5g06380 expressed protein unknown
At5g28490
LIGHT-DEPENDENT SHORT HYPOCOTYLS 1 (LSH1), ORGAN BOUNDARY 2 (OBO2)
LSH1 family light regulation of seedling development in a
phytochrome-dependent manner [57–59] At5g44190 GBF’S PRO-RICH REGION-INTERACTING FACTOR 2 (GPRI2), GOLDEN2-LIKE 2 (GLK2) GOLDEN2-like TF
regulation of chloroplast development in a
cell-autonomous manner, regulation of the expression of the photosynthetic apparatus, negative regulation of floral transition
[64]
At5g49360 BETA-XYLOSIDASE 1 (BXL1) glycosyl hydrolase family 3
β-D-xylosidase/α-L-arabinofuranosidase of the extracellular matrix required for pectic arabinan modification. expressed in tissues with secondary wall thickening, involved in seed germination
Epigenomes 2017, 1, 8 14 of 32
Table 3. Overall correlation between quantitative changes in histone mark abundance with rank of gene expression changes in the three gene sets described in Figure4A–C. DEGs were ranked according to their change in expression and the Pearson product-moment correlation coefficient (PCC) between this rank and the change in histone mark abundance was calculated. Only average changes over the gene body were taken into account. To provide a measure for the overall changes in histone marks among DEGs, average changes in normalised read counts over gene bodies for all the DEGs in the same categories were calculated (∆ normalised read count).
PCC ∆ Normalised Read Count
H3K27me3 H3K4me3 H3K27me3 H3K4me3
up-regulated DEGs
t0-t2 −0.104 0.456 −0.004 0.139
t0-t2, K27 targets −0.152 0.420 −0.002 0.110 t0-t2 & t0-I, K27 targets −0.248 0.360 −0.230 0.289
down-regulated DEGs
t0-t2 −0.012 0.420 0.032 −0.190
t0-t2, K27 targets −0.197 0.389 0.062 −0.169 t0-t2 & t0-I, K27 targets −0.284 0.467 0.428 −0.448
2.7. Relative Dynamics of Histone Marks, MADS TF Binding and Chromatin Opening during Early Stages of Gene Activation
Since flower morphogenesis is mainly regulated by activation of ABC(D)E genes, and especially MADS domain TFs, we were interested in the correlation between MADS binding to chromatin [29] and histone mark changes (this study). We therefore analysed which fractions of t0-t2 DMGs in our data set are targets of the MADS TFs SEP3 and AP1 in the floral induction system as determined by Pajoro et al. at two, four and eight days (t2, t4, t8) after induction [29] (Figure6, Figure S11A). At t2, slightly more than 20% of genes with reduced H3K27me3 or elevated H3K4me3 are targeted by the MADS TFs, while almost 40% of the genes changing in both marks are. At t4, the percentage of genes being MADS targets raises to around 60% for those changing in a single mark and to more than 90% for those changing in both marks (12 of 13 genes are MADS targets at t4). Towards t8 only minute changes occur in this distribution. These percentages of DMGs bound by the MADS TFs are higher than that observed for all H3K27me3 or H3K4me3 target genes: only 6.7% of H3K27me3 (8.9% for H3K4me3) target genes are MADS targets at t2, increasing to 23.4% (33% H3K4me) at t4 and 26.9% (35.7% H3K4me3) at t8.
As MADS TFs were proposed to assist in opening chromatin, we analysed if the genes changing in histone marks from t0 to t2 would also change in their chromatin conformation as determined in Pajoro et al. [29] by assessing DNase I hypersensitivity (DHS, Figure6, Figure S11B). Interestingly, about 40% or 60% of those DMGs are already located in DNase I hypersensitive (accessible) regions at t0. This is quite unchanged in t2 and the percentage of genes in open regions only increases slightly towards t4 and more towards t8. MADS binding seems to mainly affect other, still closed genes at t2, while a larger overlap between MADS binding and DHS is observed at t4 and even more at t8 (Figure6).
This dataset comparison indicates that the majority of genes changing in H3K27me3 and H3K4me3 histone marks during early steps of flower morphogenesis are targets of the floral organ identity regulators SEP3 and AP1, and that binding of these MADS TFs occurs at the same time as histone mark changes or slightly later. Furthermore, it appears that opening of previously closed chromatin may occur after histone mark changes and MADS binding (Figure6).
Epigenomes 2017, 1, 8 15 of 32
Epigenomes 2017, 2, 1 16 of 33
Figure 6. Correlation of genome‐wide changes in histone marks from t0 to t2, binding of MADS TFs
and DNaseI hypersensitivity during early flower development. Fractions of DMGs for H3K27me3, H3K4me3 and both marks from t0 to t2 (K27 down: H3K27me3 reduced t0‐t2, K4 up: H3K4me3 elevated t0‐t2, both: H3K27me3 reduced and H3K4me3 elevated t0‐t2) that are bound by MADS TFs (AP1 and/or SEP3) and/or overlap with DNase I hypersensitive sites (DHS) during early flower development. TF binding at three time points after dex‐induction was considered: t2, t4 and t8, while DHS was additionally considered at t0 [29]. “none” identifies genes that were not DHS nor MADS target. 3. Discussion 3.1. Chromatin Marks are Highly Dynamic in Association with Tissue Fate during Flower Morphogenesis Several mutants in PcG and trxG components display defects in initiation of flowering and in floral architecture [3]. Moreover, almost all floral organ identity genes and many flowering time regulators are targeted by H3K27me3, and detailed studies at single gene level (e.g., FT and
FLOWERING LOCUS C) have shown that activation of these genes is accompanied by histone mark
dynamics. These facts led to the assumption that PcG‐associated H3K27me3 and trxG‐associated H3K4me3 dynamics operate at the onset of flowering and flower development, affecting a wide range of target genes. However, the extent of the chromatin marks remodelling remained unknown. Through the floral induction system we could generate a genome‐wide map of dynamics in histone mark abundance and correlate it with expression dynamics, during early steps of flower development. Our study demonstrates that histone marks change between vegetative and reproductive structures, and during flower initiation and morphogenesis affect a total of 14,826 genes (changed at least in one mark in one comparison, Tab S4) in A. thaliana. Several thousands of genes changed in histone marks from leaf towards inflorescence meristems and then changed in the opposite direction from inflorescence meristems towards fully expanded inflorescences. This indicates that histone marks antagonistically change in the different tissue types according to the underlying meristematic activities. These reverted patterns of histone mark changes throughout the time series thus likely reflect the chromatin features of differentiated versus meristem‐like tissues and highlight the continuous and iterative mode of plant development.
3.2. Integrative Analysis of Chromatin and Expression Datasets Provides Insights on the Mechanistic of Gene Activation, Revealing Unexpected Order of Events
Combination of the transcriptomics and chromatin dynamics datasets revealed that changes in histone marks are widely correlated with changes in expression in the anticipated direction. Especially, changes in both marks are more prone to coincide with expression changes.
Figure 6.Correlation of genome-wide changes in histone marks from t0 to t2, binding of MADS TFs and DNaseI hypersensitivity during early flower development. Fractions of DMGs for H3K27me3, H3K4me3 and both marks from t0 to t2 (K27 down: H3K27me3 reduced t0-t2, K4 up: H3K4me3 elevated t0-t2, both: H3K27me3 reduced and H3K4me3 elevated t0-t2) that are bound by MADS TFs (AP1 and/or SEP3) and/or overlap with DNase I hypersensitive sites (DHS) during early flower development. TF binding at three time points after dex-induction was considered: t2, t4 and t8, while DHS was additionally considered at t0 [29]. “none” identifies genes that were not DHS nor MADS target.
3. Discussion
3.1. Chromatin Marks are Highly Dynamic in Association with Tissue Fate during Flower Morphogenesis Several mutants in PcG and trxG components display defects in initiation of flowering and in floral architecture [3]. Moreover, almost all floral organ identity genes and many flowering time regulators are targeted by H3K27me3, and detailed studies at single gene level (e.g., FT and FLOWERING LOCUS C) have shown that activation of these genes is accompanied by histone mark dynamics. These facts led to the assumption that PcG-associated H3K27me3 and trxG-associated H3K4me3 dynamics operate at the onset of flowering and flower development, affecting a wide range of target genes. However, the extent of the chromatin marks remodelling remained unknown. Through the floral induction system we could generate a genome-wide map of dynamics in histone mark abundance and correlate it with expression dynamics, during early steps of flower development. Our study demonstrates that histone marks change between vegetative and reproductive structures, and during flower initiation and morphogenesis affect a total of 14,826 genes (changed at least in one mark in one comparison, Tab S4) in A. thaliana.
Several thousands of genes changed in histone marks from leaf towards inflorescence meristems and then changed in the opposite direction from inflorescence meristems towards fully expanded inflorescences. This indicates that histone marks antagonistically change in the different tissue types according to the underlying meristematic activities. These reverted patterns of histone mark changes throughout the time series thus likely reflect the chromatin features of differentiated versus meristem-like tissues and highlight the continuous and iterative mode of plant development. 3.2. Integrative Analysis of Chromatin and Expression Datasets Provides Insights on the Mechanistic of Gene Activation, Revealing Unexpected Order of Events
Combination of the transcriptomics and chromatin dynamics datasets revealed that changes in histone marks are widely correlated with changes in expression in the anticipated direction. Especially, changes in both marks are more prone to coincide with expression changes.
Epigenomes 2017, 1, 8 16 of 32
The temporal resolution brought by our dataset revealed that activation of a locus does rather not follow the canonically assumed order of events, with repressive marks being removed and active marks being added during transcriptional activation. Some studies had challenged this view in the past, at single gene level in plants. They report that transcription can take place while repressive marks are still present, and reduction in these marks was proposed to rather be a consequence of expression of the target gene [24,25,66]. Our genome-wide study shows that H3K4me3 is both quantitatively and temporally closely correlated with expression changes, while changes in H3K27me3 most likely require prior transcriptional changes to occur (Figure7). This is in line with the recent report in mouse that re-establishment of H3K4me3 occurs more rapidly than that of H3K27me3 during activation of the zygote genome [67].
Moreover, we found that during flower formation, activation of expression of PcG target genes is predominantly accompanied by changes in H3K4me3 while H3K27me3 marks remain at the loci, and only decline later during flower morphogenesis. This indicates that initiation of floral morphogenesis involves more activation than de-repression events at the chromatin.
Decrease in H3K27me3 would require either active demethylation or dilution of the mark over cell divisions. In a tissue that undergoes cell division, in order to maintain a H3K27 methylated state at a specific locus, new chromatids would need to be methylated at the same locus as their template, after each cell cycle. Oppositely, in absence of de novo methylation, the H3K27me3 mark would be diluted at every cell division. Thus, a cell division-dependent dilution of marks, rather than an active demethylation process could explain the temporal delay we observe in H3K27me3 decrease after gene activation.
Because flower development in the induced ap1cal AP1-GR system occurs at a similar speed as that of the wild type in our conditions (Figure S1 and [68]), one can expect a maximum of two to three cell divisions to occur during the t0-t2 transition, as reported by 4-D imaging and cell lineage analysis during early stages of A. thaliana flower development [69]. In this quite slow dividing context, dilution of the H3K27me3 mark may occur slowly, providing that de novo deposition by PcG is prevented.
A novel question thus arises on how PcG function is prevented, thus leading to H3K27me3 decrease over a longer period of activation. At least two molecular events could be involved, that were reported in previous studies. First, a cell-division dependent PcG eviction mechanism may take place, such as the one operated in the developing flower by the AG transcription factor at the KNU locus, [70]. Second, in mammalian cells, deposition of H3K27me3 by PcG proteins is hindered by the presence of H3K4me3 [71]. This should be the case in plants as well, deposition of H3K4me3 would hinder PcG proteins to access the respective histone and thus further lead to decrease in H3K27me3. Because H3K4me3 marks are required for active transcriptional elongation in plants [72], we propose a scenario along which, for gene activation at the flower meristem, H3K4me3 marks are deposited first, thus leading to active transcription and preventing de novo deposition of repressive H3K27me3 marks over cell divisions (Figure7).
Moreover, the fact that decrease in H3K27me3 may be a consequence of gene transcription could explain our observation that histone mark abundance changes over the complete gene body (even for a relatively short t0-t2 transition) and the fact that genes changing in expression show a stronger change in histone mark abundance, thus further supporting our model.
Interestingly, genes changing in one histone mark display higher abundance of the antagonistic mark at stages preceding the change. This could indicate that these genes are kept in an intermediate state to allow fast regulation during development and raises the question whether active and repressive marks co-exist at a locus in a same cell on the same chromosome, at the time of flower bud initiation. Such so-called bivalent loci were described in the specific case of animal embryonic stem cells [73] and more recently reported in plant studies using Arabidopsis seedlings [74,75]. However, thus far, we have not been able to confirm bivalent states in inflorescence meristems and early developing flowers from the ap1cal 35S::AP1-GR tissue, by re-ChIP experiments. Whether bivalency does not exist
Epigenomes 2017, 1, 8 17 of 32
or exist only very sporadically in a restricted number of cells of the flower meristem, will need to be further investigated in studies using technologies specifically designed for this purpose.
Finally, integrative analysis of histone marks, transcriptomics, profiling of MADS-domain proteins and chromatin accessibility, indicates that the majority of genes changing in H3K27me3 and H3K4me3 at early steps of flower morphogenesis are targets of the floral organ identity regulators SEP3 and AP1 and display local chromatin conformation change. Moreover, binding of the MADS-domain proteins occurs at the same time as histone mark changes or slightly later. This observation brings H3K4me3 and H3K27me3 dynamics at the forefront of molecular switches for gene expression, together with TFs that have been proposed to act as pioneer factors during flower development [29].
Epigenomes 2017, 2, 1 18 of 33
will need to be further investigated in studies using technologies specifically designed for this purpose.
Finally, integrative analysis of histone marks, transcriptomics, profiling of MADS‐domain proteins and chromatin accessibility, indicates that the majority of genes changing in H3K27me3 and H3K4me3 at early steps of flower morphogenesis are targets of the floral organ identity regulators SEP3 and AP1 and display local chromatin conformation change. Moreover, binding of the MADS‐ domain proteins occurs at the same time as histone mark changes or slightly later. This observation brings H3K4me3 and H3K27me3 dynamics at the forefront of molecular switches for gene expression, together with TFs that have been proposed to act as pioneer factors during flower development [29].
Figure 7. Model for gene activation during flower morphogenesis, showing changes in H3K4me3 and H3K27me3 chromatin marks, pioneer transcription factor binding (PTFB) and DNA accessibility (DHS). The dotted vertical grey lines mark the TSS (left) and the Stop (right) positions. The majority of genes changing in H3K27me3 and H3K4me3 during early steps of flower morphogenesis are targets of the SEP3 and AP1 pioneer transcription factors. PTBF occurs at the same time as histone mark changes or slightly later at these genes, while opening of previously closed chromatin occurs rather after histone mark changes and PTFB. H3K4me3 deposition displays temporal correlation with expression changes while H3K27me3 reduction occurs later. 4. Materials and Methods 4.1. Plant Material and Growth Conditions All employed lines were in Landsberg erecta (Ler) accession. AP1 and CAL double mutants (ap1‐1 cal‐1) [76] and 35S::AP1:GR ap1‐1 cal‐1 [26] were described previously. After 2–3 days of stratification at 4 °C, plants were germinated on Murashige and Skoog medium (Sigma‐Aldrich, Lyon, France ) supplemented with 0.3% sucrose in growth cabinets (Percival, Percival Scientific Incorporated, provided by CLF Plant Climatics, Emersacker, Germany) in a controlled environment in long days (LD) of 16 h light at 18 °C and 8 h darkness at 16 °C. At about ten days after germination, plants were transferred to a 1:1 mixture of soil/vermiculite.
4.2. Dexamethasone Treatment and Harvesting of Plant Material
The ap1cal 35S::AP1‐GR system employs double mutants of the floral meristem identity genes AP1 and CAL. In ap1cal plants, inflorescence‐meristem‐like tissue over‐proliferates while flower organogenesis does not proceed. A 35S::AP1‐GR construct, for induction of flower development upon
Figure 7.Model for gene activation during flower morphogenesis, showing changes in H3K4me3 and H3K27me3 chromatin marks, pioneer transcription factor binding (PTFB) and DNA accessibility (DHS). The dotted vertical grey lines mark the TSS (left) and the Stop (right) positions. The majority of genes changing in H3K27me3 and H3K4me3 during early steps of flower morphogenesis are targets of the SEP3 and AP1 pioneer transcription factors. PTBF occurs at the same time as histone mark changes or slightly later at these genes, while opening of previously closed chromatin occurs rather after histone mark changes and PTFB. H3K4me3 deposition displays temporal correlation with expression changes while H3K27me3 reduction occurs later.
4. Materials and Methods
4.1. Plant Material and Growth Conditions
All employed lines were in Landsberg erecta (Ler) accession. AP1 and CAL double mutants (ap1-1 cal-1) [76] and 35S::AP1:GR ap1-1 cal-1 [26] were described previously.
After 2–3 days of stratification at 4◦C, plants were germinated on Murashige and Skoog medium (Sigma-Aldrich, Lyon, France ) supplemented with 0.3% sucrose in growth cabinets (Percival, Percival Scientific Incorporated, provided by CLF Plant Climatics, Emersacker, Germany) in a controlled environment in long days (LD) of 16 h light at 18◦C and 8 h darkness at 16◦C. At about ten days after germination, plants were transferred to a 1:1 mixture of soil/vermiculite.
4.2. Dexamethasone Treatment and Harvesting of Plant Material
The ap1cal 35S::AP1-GR system employs double mutants of the floral meristem identity genes AP1 and CAL. In ap1cal plants, inflorescence-meristem-like tissue over-proliferates while flower
Epigenomes 2017, 1, 8 18 of 32
organogenesis does not proceed. A 35S::AP1-GR construct, for induction of flower development upon dexamethasone treatment, allows harvesting uniform tissue for synchronized floral stages, in sufficient amounts for ChIP [27–29]. To induce AP1 translocation to the nucleus, primary inflorescences of ap1cal 35S::AP1:GR plants were treated with induction solution (10 µM dexamethasone, 0.015% Silwet) by pipetting the solution directly onto the cauliflower structures. This process was repeated once after 30 min.
For harvesting of ap1cal and ap1cal 35S::AP1:GR samples, only the cauliflower structures of the main inflorescence were harvested. Leaf and pedicel tissue contamination was minimized by dissection. Samples were collected from untreated ap1cal (ac) and ap1cal 35S::AP1:GR (t0) tissue and ap1cal 35S::AP1:GR tissue 2 days after induction (t2). For inflorescence samples (I), whole main inflorescences of wild type plants were harvested. Flowers older than stage 12 were removed. For leaf (L) samples, rosette leaves of the same wild type plants were harvested. About 15 plants were harvested for one ChIP sample resulting in around 0.2–0.3 g of material for cauliflower and inflorescence tissues and 1–1.3 g for leaf tissue. For RNA samples, a fraction of 0.05–0.06 g for cauliflower and inflorescence tissues and 0.25 g for leaf tissue was taken from the sampling event. Replicates for biological sampling were grown independently (at different times) and harvested from the same groups of plants for ChIP-seq (two replicates) and RNA-seq (three replicates).
4.3. Scanning Electron Microscopy
For scanning electron microscopy [77], untreated inflorescence-like meristems of ~4 week old ap1cal or ap1cal 35S:AP1-GR plants were harvested, as were 5 d-post dexamethasone-treated ap1cal 35S:AP1-GR inflorescence-like meristems, and fixed using 1% glutaraldehyde in 0.025 M sodium phosphate buffer. Samples were then washed three times with 0.025 M sodium phosphate and further dehydrated in gradually concentrated alcohol solutions. The material was then critical point dried in liquid carbon dioxide, mounted on stubs and coated with platinum. Imaging was performed using a Hitachi 5500 scanning electron microscope (Hitachi Ltd., Tokyo, Japan).
4.4. Chromatin Immunoprecipitation
Formaldehyde cross-linking and extraction of nuclei was performed as described in [78] with the following modifications: infiltration time was prolonged (6 min and 24 min), filtration of the extract after grinding was performed through 75 µm and 50 µm nylon meshes and sonication was done for 13×30 s on, 1 min off, position H (this longer sonication was only performed for biological replicate 2). Immunoprecipitation reactions were set up as described in [78] except that 15 µg of cauliflower and 10 µg of wild type chromatin was used and the chromatin was incubated with 5 µL of the antibody alone for 5 h prior to addition of Protein A Agarose beads without salmon sperm DNA (Millipore, Molsheim, France).
Antibodies used were anti-H3K27me3 (07-449, Millipore) and anti-H3K4me3 (17-614, Millipore). Specificity of each lot used was checked via dot-Blot (Figure S1H(I)) using peptides containing mono-, di and tri-methylated versions of the respective residue (Abcam, ab1780-1782, ab1340, ab1768 and ab1742) according to recommendations provided by the manufacturer.
Washing of the ChIP reaction was performed using binding/wash buffer as described in [78] but for four times 10 min at 4◦C and once 10 min at room temperature (RT).
Elution and reverse cross-linking was performed as described in [79] except that the elution was done by vortex mixing for 1 min at RT and input samples (1/3 of the chromatin used for one ChIP sample) were brought to the same volume by adding elution buffer and Tris pH9 in the same ratio as to the ChIP samples.
Reverse cross-linked samples were purified using the MinElute Reaction Cleanup Kit (Qiagen, Hilden, Germany) and DNA was eluted in 30 µL Elution buffer.
For biological replicate 2, three technical replicates of ChIP on the same nuclear extract were performed and pooled on one MinElute column.