Publisher’s version / Version de l'éditeur:
Vous avez des questions? Nous pouvons vous aider. Pour communiquer directement avec un auteur, consultez la
première page de la revue dans laquelle son article a été publié afin de trouver ses coordonnées. Si vous n’arrivez pas à les repérer, communiquez avec nous à PublicationsArchive-ArchivesPublications@nrc-cnrc.gc.ca.
Questions? Contact the NRC Publications Archive team at
PublicationsArchive-ArchivesPublications@nrc-cnrc.gc.ca. If you wish to email the authors directly, please see the first page of the publication for their contact information.
https://publications-cnrc.canada.ca/fra/droits
L’accès à ce site Web et l’utilisation de son contenu sont assujettis aux conditions présentées dans le site LISEZ CES CONDITIONS ATTENTIVEMENT AVANT D’UTILISER CE SITE WEB.
Internal Report (National Research Council of Canada. Institute for Research in
Construction), 2001-10-01
READ THESE TERMS AND CONDITIONS CAREFULLY BEFORE USING THIS WEBSITE. https://nrc-publications.canada.ca/eng/copyright
NRC Publications Archive Record / Notice des Archives des publications du CNRC :
https://nrc-publications.canada.ca/eng/view/object/?id=245d3e26-4ee6-4b22-a38b-119dfc3960f4 https://publications-cnrc.canada.ca/fra/voir/objet/?id=245d3e26-4ee6-4b22-a38b-119dfc3960f4
NRC Publications Archive
Archives des publications du CNRC
For the publisher’s version, please access the DOI link below./ Pour consulter la version de l’éditeur, utilisez le lien DOI ci-dessous.
https://doi.org/10.4224/20378630
Access and use of this website and the material on it are subject to the Terms and Conditions set forth at
Thermal properties of wood, gypsum and insulation at elevated
temperatures
Thermal Properties of Wood, Gypsum and Insulation at Elevated Temperatures
Bénichou, N.; Sultan, M.A.; MacCallum, C.; Hum, J.
IR-710
NRC-CNRC
______________________________________________________________________
THERMAL PROPERTIES OF WOOD, GYPSUM, AND INSULATION AT ELEVATED TEMPERATURES
Prepared by
Noureddine Bénichou, Mohamed A. Sultan, Catherine MacCallum, and Joe Hum
October 2001
Fire Risk Management Program Institute for Research in Construction National Research Council of Canada
THERMAL PROPERTIES OF WOOD, GYPSUM, AND INSULATION AT ELEVATED TEMPERATURES
by
Noureddine Bénichou, Mohamed A. Sultan, Catherine MacCallum and Joe Hum
EXECUTIVE SUMMARY
To develop accurate fire resistance models, it is important to know the thermal properties of building materials. This report presents the results of measurements of thermal properties at elevated temperatures of construction materials commonly used to build lightweight wood-framed assemblies. The thermal property tests were performed by the National Research Council of Canada between 1990 and 2000. Tabulated values and graphs are given for thermal conductivity, specific heat, mass loss and thermal expansion/contraction of the materials (wood, gypsum and insulation) as a function of temperature. In addition, the effects of temperature on the thermal conductivity, specific heat, mass loss and thermal expansion/contraction of the materials are discussed. Finally, in addition to providing a resource of information, this report also identifies the additional thermal property tests required to complete the matrix of information.
THERMAL PROPERTIES OF WOOD, GYPSUM, AND INSULATION AT ELEVATED TEMPERATURES
by
Noureddine Bénichou, Mohamed A. Sultan, Catherine MacCallum and Joe Hum
TABLE OF CONTENTS
EXECUTIVE SUMMARY ...I LIST OF FIGURES... IV LIST OF TABLES ... V
1 INTRODUCTION ...1
1.1 GENERAL BACKGROUND...1
1.2 ASSESSMENT OF FIRE RESISTANCE OF WOOD-FRAMED ASSEMBLIES...1
1.3 FIRE RESISTANCE MODELS...2
1.4 NRC/WOOD INDUSTRY PARTNERSHIP – FIRE RESISTANCE MODEL DEVELOPMENT..2
1.5 NEED FOR MATERIAL PROPERTIES...3
1.6 OBJECTIVE OF THE REPORT...3
1.7 DOCUMENT OUTLINE...3
2 TEST DATA ON THERMAL PROPERTIES AT ELEVATED TEMPERATURES ...4
2.1 GENERAL AND PRESENTATION OF DATA...4
2.2 DESCRIPTION OF MATERIALS TESTED...4
2.3 TEST SPECIMENS, TEST METHODS AND INSTRUMENTS...6
2.3.1 Thermal conductivity ...6
2.3.2 Apparent specific heat ...6
2.3.3 Mass loss...6
2.3.4 Thermal expansion/contraction...7
3 DISCUSSION OF TEST RESULTS...7
3.1 THERMAL CONDUCTIVITY...7
3.1.1 Thermal conductivity of wood ...7
3.1.2 Thermal conductivity of gypsum wallboard ...8
3.1.3 Thermal conductivity of insulation...9
3.2 APPARENT SPECIFIC HEAT...10
3.2.1 Specific heat of gypsum wallboard ...10
3.2.2 Specific heat of insulation ...11
3.3 MASS LOSS...13
3.3.1 Mass loss of gypsum wallboard ...13
3.3.2 Mass loss of insulation...14
3.4 THERMAL EXPANSION/CONTRACTION...15
3.4.1 Thermal contraction of gypsum wallboard ...15
4 SUMMARY ...16
NOMENCLATURE ...18 REFERENCES ...18 APPENDIX A ...A-1 A.1. Thermal Conductivity of Wood ... A-1 A.2. Thermal Conductivity of Gypsum ... A-1 A.3. Thermal Conductivity of Insulation ... A-2 A.4. Specific Heat of Gypsum... A-2 A.5. Specific Heat of Insulation... A-6 A.6. Mass Loss of Gypsum... A-9 A.7. Mass Loss of Insulation... A-9 A.8. Thermal Expansion/Contraction of Gypsum ... A-10
LIST OF FIGURES
FIGURE 1. THERMAL CONDUCTIVITY OF WOOD...8
FIGURE 2. THERMAL CONDUCTIVITY OF GYPSUM WALLBOARD...9
FIGURE 3. THERMAL CONDUCTIVITY OF INSULATION...10
FIGURE 4. SPECIFIC HEAT OF GYPSUM WALLBOARD...11
FIGURE 5. SPECIFIC HEAT OF INSULATION...12
FIGURE 6. SPECIFIC HEAT OF INSULATION (PRE-HEATED)...13
FIGURE 7. MASS LOSS OF GYPSUM WALLBOARD...14
FIGURE 8. MASS LOSS OF INSULATION...15
LIST OF TABLES
THERMAL PROPERTIES OF WOOD, GYPSUM, AND INSULATION AT ELEVATED TEMPERATURES
by
Noureddine Bénichou, Mohamed A. Sultan, Catherine MacCallum and Joe Hum
1 INTRODUCTION 1.1 General Background
During the past decade, many countries in the world, including Canada, have been planning or have moved towards performance/objective-based codes. In a performance-based environment, the designer identifies a set of performance fire safety objectives and then satisfies these against established design criteria. This performance-based approach allows for flexibility in design that may lead to lower construction costs without lowering the level of safety.
The current challenge facing performance-based designs is the difficulty in evaluating whether or not compliance with the pre-set requirements has been achieved. Thus, the success of performance-based codes can be facilitated by the availability of design tools, usually in the form of models, which can predict the fire safety performance of a building and its elements.
This move will also benefit the fire specialists since they will have at their disposal fire resistance methods that can be used without resorting to fire resistance testing.
1.2 Assessment of Fire Resistance of Wood-Framed Assemblies
In North America, lightweight wood-framed assemblies are commonly used in the construction of walls and floors of compartments of multi-occupancy residential buildings for their light weight and low construction costs. To minimize the costly consequences of fire in these residential buildings, wall and floor assemblies must be designed to adequately withstand fire exposure so that the fire is contained within the compartment of fire origin for a duration of time. This duration, called fire resistance, will help in: a) maintaining building integrity, b) reducing fire spread from one fire compartment to another, and c) providing for the safe egress of building occupants and emergency responders.
The fire resistance can be determined using test methods. In fire resistance testing, the current practice in North America is to subject a fire barrier to a fire test conducted in accordance with procedures outlined in standards, namely CAN/ULC-S101-M891 (Underwriters' Laboratories of Canada) and ASTM E1192 (American Society for Testing and Materials). These tests are used to obtain the time to failure based on fire resistance criteria. These criteria can be manifested in three ways:
• Thermal failure defined as an average temperature rise of 140°C or a local maximum of 180°C on the unexposed face above the ambient temperature;
• Integrity failure defined as flames or hot gases penetrating through the components; or
• Stability failure defined as the loss of load-bearing capacity of structural members. The fire resistance for specific load-bearing and non-load-bearing wall and floor assemblies can also be determined using reference to ready-to-use tables or design procedures such as the component additive method found in Appendices A and D, respectively, of the National Building Code of Canada3 (NBCC). Finally, the fire resistance can be evaluated using validated numerical models, which have become available with the advent of performance-based codes. Fire resistance modelling will be discussed in the following section.
1.3 Fire Resistance Models
Fire resistance test methods have been used for many years and will continue to be used for years to come. However, these methods have drawbacks, including high cost and time requirements, limitations of the specimen geometry and loading, effect of restraint and reproducibility. As an alternative, calculation methods can be very useful in predicting the fire resistance behaviour. In addition, calculation techniques are becoming more popular and may well serve the needs of performance-based codes, especially where exposures differing from that in the standard test must be considered.
1.4 NRC/Wood Industry Partnership – Fire Resistance Model Development
For many years, the National Research Council of Canada (NRC) has been developing fire resistance models. Currently, research studies are in progress at NRC, in partnership with the Canadian wood industry, Forintek Canada Corp., to study the behaviour of lightweight wood-framed assemblies at elevated temperatures. The aim is to develop a numerical model for predicting the fire resistance of lightweight wood-framed assemblies exposed to standard and real fires. This model will be used to develop fire resistance design equations for wood-framed assemblies and guidelines for the use of lightweight wood-framed assemblies for possible incorporation in codes and standards as well as for incorporation in NRC’s risk assessment tools.
Fire resistance of wood-frame walls is determined by the thermal and structural performance of the wall when exposed to fires. The fire resistance model, being developed, consists of two sub-models for predicting the thermal and structural response of wood-stud walls. The thermal response sub-model estimates the temperature distribution in the wall, the extent of char in wood, as well as the time to thermal failure of the assembly. The structural sub-model calculates the wood stud’s deflection and the time to structural failure of the assembly. The two sub-models are physically independent, but the structural sub-model uses the temperature distribution and the extent of char predicted by the thermal sub-model as input.
1.5 Need for Material Properties
In order to predict the fire resistance of a load-bearing assembly, the temperatures inside the assembly must be determined, as they are critical in assessing the structural behaviour of the assembly. For such calculations, knowledge of the thermal properties, at elevated temperatures, of the materials that comprise the assembly, i.e., wood, lining and insulation, is required. The thermal properties include thermal conductivity, specific heat, mass loss and thermal expansion/contraction. Although the literature provides some data for various components of wood-framed assemblies, it has been shown that the information available to describe these properties is often inconsistent and varies extremely.4 Thus, the process of selecting a set of accurate thermo-physical properties is difficult.
1.6 Objective of the Report
To aid the development of fire resistance models, NRC has carried out a number of tests on thermal properties at elevated temperatures of construction materials commonly used to build lightweight wood-framed assemblies. This report presents the data from these tests that were conducted at the National Research Council of Canada in the past decade. The outcome of this study will serve to combine the existing information into a single source directly accessible to researchers and will increase the database of material properties found in the literature. The test results, in table forms and graphs, are given as a function of temperature for thermal conductivity, specific heat, mass loss and thermal expansion/contraction for wood, gypsum and insulation. In addition, the effects of temperature on the thermal conductivity, specific heat, mass loss and thermal expansion/contraction of these materials are discussed. The report also identifies the additional thermal property tests required to complete the matrix of information.
1.7 Document Outline
This document comprises a set of sections that give insight into the determination of fire resistance and thermal properties at elevated temperatures of components of wood-framed assemblies. Included are the following sections:
Section 1: An introduction describing a general background, the fire resistance assessment of wood-framed assemblies, fire resistance modelling, NRC/wood industry partnership, need for material properties and the objective of the report.
Section 2: Experimental data on thermal properties at elevated temperatures. Section 3: A discussion of the thermal properties test results.
Section 4: Summary of the study findings.
Section 5: A look at the current and future research. Appendix A Raw data of the measured thermal properties.
2 TEST DATA ON THERMAL PROPERTIES AT ELEVATED TEMPERATURES 2.1 General and Presentation of Data
The Fire Risk Management Program (FRMP) at the Institute for Research in Construction (IRC), NRC, has been engaged in applied materials research for many years. Some of the information has been published in the past.5 However, the accumulated information on thermal properties of components of wood-framed assemblies at elevated temperatures conducted in the 90s has not been published and there is a need to release it for the benefit of the researchers, industry, and the general public. The thermal properties measured included the thermal conductivity, specific heat, thermal expansion/contraction, and the mass loss of wood, gypsum, and insulation at elevated temperatures. The measurements were carried out using commercially available instruments. For the materials tested, the following information will be presented in detail:
• Graph showing the dependence of the thermal conductivity, k, on temperature T. The thermal conductivity, expressed in W/m°C, is defined as the proportionality constant between the rate of heat transfer and the product of temperature gradient across the solid and the area through which the heat is transferred.
• Calorimeter graph, showing the variation of the specific heat, cp, with the
temperature T. The specific heat, expressed in J/g°C, of a material is the amount of heat required to raise the temperature of one unit mass of a material 1°C. The specific heat of a material is usually temperature dependent. If, in addition, the material becomes unstable, i.e., undergoes a “reaction”, which can be decomposition or transition, etc., the heat necessary to raise the temperature of the material is affected by the reaction heat contribution, which results in a peak in the specific heat versus temperature curve.
• Thermogravimetric graph, depicting the relation between the change in mass M/Mo,
expressed in %, and temperature T (where Mo is the mass of the material at room
temperature and M is that at a temperature T).
• Dilatometric graph, depicting the relation between the change in expansion or contraction ∆l/lo, expressed in %, and temperature T (where lo is a linear
measurement of the material and ∆l is the change in that dimension due to heating). The last three graphs represent information obtained by heating techniques. The four graphs can be used to calculate the temperature dependence with thermal conductivity, specific heat, the mass loss, and thermal expansion/contraction. The experiments and test specimens are explained in detail in the following subsection.
2.2 Description of Materials Tested
In this report, the thermal properties, at elevated temperatures, of wood, gypsum and insulation were measured. A brief description of these materials is listed in the table below. The available information on material identification (common name, density, composition, manufacturer, and any other pertinent miscellaneous information) is provided, along with a list of which properties were tested. The materials are listed in the order in which they appear in the section showing the figures.
Table 1. Description of materials tested Type of
Product
Name of Material Property Tested Figure No.
Wood 5/8 plywood Thermal Conductivity 1
Wood 2 x 4 Spruce 1 Thermal Conductivity 1
Wood 2 x 4 Spruce 2 Thermal Conductivity 1
Wood 2 x 4 Spruce 3 Thermal Conductivity 1
Wood 2 x 4 Spruce 4 Thermal Conductivity 1
Gypsum Regular Gypsum Thermal Conductivity 2
Gypsum FR Gypsum Thermal Conductivity 2
Gypsum Plaster Board Westroc Gypsum Type Regular Heavy
Thermal Conductivity 2 Gypsum CGC Gypsum Type Regular Light Thermal Conductivity 2 Gypsum CGC Gypsum type X (Firecode C) Thermal Conductivity 2 Gypsum CGC Gypsum type X (Firecode C) Thermal Conductivity 2 Insulation Southport Board Products - Mill Board Thermal Conductivity 3 Insulation CGC Roxul Insulation Thermal Conductivity 3 Insulation Roxul Insulation – Flexibatt Thermal Conductivity 3 Insulation Flexibatt - Glass Fiber Insulation Thermal Conductivity 3
Gypsum Regular Gypsum Specific Heat 4
Gypsum FR Gypsum Specific Heat 4
Gypsum Plaster Board Westroc Heavy Specific Heat 4
Gypsum Gypsum Type X 15.9 (1) Specific Heat 4
Gypsum Gypsum Type X 15.9 (2) Specific Heat 4
Gypsum Gypsum Type X 15.9 (3) Specific Heat 4
Gypsum Gypsum Type X 12.5 (1) Specific Heat 4
Gypsum Gypsum Type X 12.5 (2) Specific Heat 4
Insulation Southport Board Products - Mill Board Specific Heat 5
Insulation Rock Insulation Specific Heat 5
Insulation Mineral Wool 1 Specific Heat 5
Insulation Mineral Wool 2 Specific Heat 5
Insulation Glass fibre Specific Heat 5
Insulation Southport Board Products - Mill Board (preheated)
Specific Heat 6 Insulation Mineral Wool 1 (pre-heated) Specific Heat 6 Insulation Mineral Wool 2 (preheated Specific Heat 6 Insulation Mineral Wool 3 (pre-heated) Specific Heat 6
Gypsum Regular Gypsum Mass Loss 7
Gypsum FR Gypsum Mass Loss 7
Gypsum Plaster Board Westroc Heavy Mass Loss 7
Gypsum CGC Gypsum Type X 12.5 mm Mass Loss 7
Insulation Rock fibre - Roxul Insulation Mass Loss 8
Insulation Fiber Glass Insulation Mass Loss 8
Gypsum Regular Gypsum Expansion 9
Gypsum FR Gypsum Expansion 9
2.3 Test Specimens, Test Methods and Instruments
The test specimens for the determination of the thermal conductivity and the thermal expansion were prepared by cutting the material to appropriate sizes. Specimens for the determination of the specific heat were obtained by grinding a portion of the materials. The determination of the mass loss was obtained by cutting the material to specific sizes in some cases and by grinding the materials in other cases. To gather the data presented in this report, the following methods and instruments were used.
2.3.1 Thermal conductivity
The presence of moisture may have a significant and unpredictable effect on the thermal conductivity of the material at any temperature below 100°C, and may in addition complicate the interpretation of the calorimetric, thermogravimetric, and dilatometric curves. It is imperative to conduct all thermal property tests on specimens brought into a moistureless “reference condition” prior to the tests. Therefore, all materials were dried in an oven at 40°C for 24 hours before testing. The thermal conductivity of the materials was measured using a TC-31 Thermal Conductivity Meter made by Kyoto Electronics. This meter employs steady-state methods to determine thermal conductivity. The measurements were made in the temperature range between 20°C and 1100°C.
2.3.2 Apparent specific heat
The apparent specific heat was obtained employing differential scanning calorimetry. Test specimens weighing in most cases between 10 and 30 mg were conditioned at 40°C for 24 hours to drive off free moisture. The specimens were placed in a nitrogen atmosphere, and in static air in one case, and tested using a DuPont Differential Scanning Calorimeter (DSC) for temperatures up to 700°C. The DSC measurements were carried out with mainly a heating rate of 5°C/min. Heating rates of 2, 10, and 20°C/min were also used to compare the change of rate on the specific heat. The specific heat was measured up to 700°C.
For materials that do undergo reactions, the specific heat was measured carrying out two runs, one with powdered sapphire (Al2O3) as the calibration material and one with
the sample. A stepwise heating program (namely, a period of constant material temperature followed by a period of temperature rise, which is followed again by a period of constant material temperature, etc.) through the temperature range from 400°C to 700°C, was used during the measurements.
2.3.3 Mass loss
All materials were dried and conditioned under vacuum at 40°C for 24 hours before testing to drive off free moisture. The change in mass with temperature was determined using thermogravimetric analysis. When grinding, the test specimens weighed in most cases between 10 to 40 mg were placed in a nitrogen atmosphere and tested by means of a DuPont 951 Thermogravimetric Analyzer (TGA) at a heating rate of 5 or 20°C/min. The test specimens cut in sections weighed between 20 to 50 g and were heated in an
electric oven to determine their mass loss. The temperature range was from 20°C to 1000°C.
2.3.4 Thermal expansion/contraction
A Theta Dilatory Apparatus with a computer-controlled program was used to measure thermal expansion. The curves showing thermal expansion versus temperature were produced in the range from 20°C to 1000°C. The specimens tested were 30 to 40 mm long and 10x10 to 13 by 13 mm in cross-section. The rate of heating was 10°C/ min in static air from room temperature to 1000°C. One specimen had a mass of 12.45 mg and was tested at a heating rate of 5°C/ min.
3 DISCUSSION OF TEST RESULTS
In the following paragraphs, a brief discussion of trends in the data obtained in the thermal property tests is presented. The thermal properties are also discussed and compared to each other to show the influence of the type of material. For more specific information, the appropriate figures should be consulted. In addition, the raw data is included in tabular form in Appendix A.
3.1 Thermal Conductivity
Thermal conductivity is very sensitive to the microstructure of the material. It is strongly influenced by such factors as mineral composition, degree of crystallinity, impurities in the crystal structure, average grain size, grain orientation, and porosity. For this reason, materials referred to by the same generic name, such as gypsum products, may exhibit differences in their thermal conductivity. Most building materials can be regarded as mixtures of crystalline and amorphous formations. If a material is highly crystalline in structure, its thermal conductivity is relatively high at room temperature, but gradually decreases at increasing temperatures. If, on the other hand, it is predominantly amorphous, its thermal conductivity is low at room temperature and increases slightly with an increase in temperature.
During testing, a weight is placed on the test specimen to hold it in place. At high temperatures, the weight may crush the specimen, thus preventing the development of fissures and the resultant heat transfer through them by both convection and radiation. Consequently, the thermal conductivity determined for high temperatures may be low. Results of the thermal conductivity measurements are presented in Figures 1 to 3.
3.1.1 Thermal conductivity of wood
Figure 1 shows the thermal conductivity of wood for a number of test specimens. For plywood 5/8, the thermal conductivity is almost constant between 40°C and 150°C, then sharply increases linearly from 150°C to about 300°C, after which there is a linear decrease until 525°C. For spruce 1 to 4, the thermal conductivity is linear between 40°C and 125°C, but does not show a consistent trend. For temperatures ranging from 125°C
to about 200°C, the thermal conductivity starts increasing almost linearly, then decreases linearly between 200°C and 250°C, to finally increase after about 250°C for the test specimens that were continued for testing after charring. While the trend is similar for all tested specimens, the thermal conductivity data values vary in a band from a minimum of about 0.05 W/m-K to a maximum of approximately 0.19 W/m-K. A mean curve can be extracted by following the minimum and maximum thermal conductivity values for each specimen. The difference in thermal conductivity values can be attributed to differences in species (spruce versus plywood), grain orientation, and wood density, which can alter the heat propagation in the specimens. The moisture content in the test specimen and the repeatability of the testing method can also affect the values of the thermal conductivity.
0.00 0.05 0.10 0.15 0.20 0.25 0 50 100 150 200 250 300 350 400 450 500 550 Temperature (°C) The rm a l C o ndu c tiv it y ( W /m °C ) Plyw ood 5/8 Spruce 2x4 (1) Spruce 2x4 (2) Spruce 2x4 (3) Spruce 2x4 (4)
Figure 1. Thermal conductivity of wood
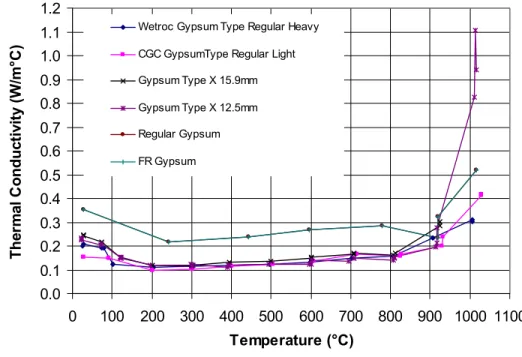
3.1.2 Thermal conductivity of gypsum wallboard
The thermal conductivity of gypsum wallboard is shown in Figure 2 as a function of temperature. The thermal conductivity, for all test specimens, decreases almost linearly up to a temperature of 200°C, then shows a slight increase from 200°C to about 800°C, and finally a sharp increase especially after a temperature of 900°C. The thermal conductivity of Regular gypsum and FR gypsum is higher than that of the other materials in the temperature range of 40°C to 900°C. This can be attributed to the higher crystallinity of Regular gypsum and FR gypsum as compared to other materials. The higher the crystallinity, the more the thermal conductivity and its rate decrease with temperature. This can also be due to more cracks and propagation in Regular gypsum and FR gypsum, which increases the rate of heat transfer in the specimen. The variation is in part also due to the fact that chemical formulation of the gypsum core varies from product to product. From the graph, the trend of the thermal conductivity of
gypsum wallboard can be best approximated by three regions (lines): a linear decrease up to 200°C, a constant value between 200°C and 800°C, and a sharp increase after 800°C. 0.0 0.1 0.2 0.3 0.4 0.5 0.6 0.7 0.8 0.9 1.0 1.1 1.2 0 100 200 300 400 500 600 700 800 900 1000 1100 Temperature (°C) Th e rm a l C o n duc ti v it y ( W /m °C )
Wetroc Gypsum Type Regular Heavy
CGC GypsumType Regular Light
Gypsum Type X 15.9mm
Gypsum Type X 12.5mm
Regular Gypsum
FR Gypsum
Figure 2. Thermal conductivity of gypsum wallboard
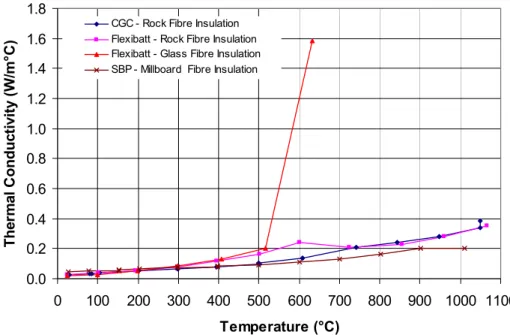
3.1.3 Thermal conductivity of insulation
Figure 3 shows the thermal conductivity of Roxul, millboard and glass fibre insulation as a function of temperature. The Figure indicates that for Roxul and millboard insulation, there is a gradual increase in the thermal conductivity as the temperature rises. A straight line or a gradual exponential curve can be fitted to the thermal conductivity data for the temperature range considered (up to 1100°C). On the other hand, the thermal conductivity of glass fibre insulation increases similarly to Roxul and millboard insulation from 0.022 W/m-K at 24°C to 0.204 W/m-K at 515°C. However, beyond 515°C, the glass fibre thermal conductivity increases very rapidly to 1.587W/mK at 632°C. This increase is due to the insulation being consumed (melting), thus, allowing the heat to go through it very easily. The thermal conductivity of glass fibre insulation can be approximated by an exponential function. The variation of the thermal conductivity in Roxul and millboard insulation is due to change in the chemical composition of fibre from one product to another.
0.0 0.2 0.4 0.6 0.8 1.0 1.2 1.4 1.6 1.8 0 100 200 300 400 500 600 700 800 900 1000 1100 Temperature (°C) The rm a l C onduc ti v it y ( W /m °C )
CGC - Rock Fibre Insulation Flexibatt - Rock Fibre Insulation Flexibatt - Glass Fibre Insulation SBP - Millboard Fibre Insulation
Figure 3. Thermal conductivity of insulation
3.2 Apparent Specific Heat
Materials that undergo exothermic reaction may yield negative values for the specific heat in certain temperature intervals. A negative value for specific heat indicates that at the applied rate of heating, the rate of evolution of reaction exceeds the rate of absorption of sensible heat by the material. If the heat is not very high, an adequate raise in the heating rate can prevent obtaining negative values for the specific heat.
3.2.1 Specific heat of gypsum wallboard
The results of the specific heat of different (test specimens) gypsum wallboards are shown in Figure 4, as a function of temperature. The curves were determined using the initial mass of the samples. For all the gypsum wallboards, the specific heat shows a peak (except Gypsum Type X 15.9 mm (1), which was tested in static air and which reveals two consecutive peaks) at different temperatures, depending on the rate of heating. The peak in the apparent specific heat is an indication of the large quantity of heat absorbed in the calcination of gypsum and subsequent evaporation of water (dehydration of gypsum wallboard). The area under the peak gives the energy required to drive out the water from gypsum wallboards. Heating rates of 2, 5, 10 and 20°C/min were used in the DSC measurements. Heating rates of 2°C/min and 20°C/min were used to compare the effect of the rate of heating on the specific heat. It should be noted that in general, an increase in the rate of heating results in a shift of the peaks (nominal reaction temperature) towards higher temperatures and in a sharpening of the peaks. Therefore, for the wallboards tested at a heating rate of 2°C/min, the peak is at a temperature of approximately 100°C. While, for those tested at a heating rate of
20°C/min, the peak temperature is at about 140°C. The results also show that the specific heat peak values increase with decreasing heating rate. In addition, the difference in specific heat peak values for the same rate of heating can be attributed to the difference in the gypsum wallboard composition. The specific heat can be approximated by linear fits as a function of temperature. Further, for the temperature range outside the dehydration region (peak region), the specific heat of the gypsum wallboards does not vary too much (almost constant) and ranges between 0.6 and 1.0 J/g°C. Furthermore, the negative value for the specific heat is an indication that at the applied rate of heating, the rate of evolution of reaction exceeds the rate of absorption of sensible heat by the material. Increasing the rate of heating to higher values can prevent the occurrence of negative values.
-5 0 5 10 15 20 25 30 35 0 100 200 300 400 500 600 700 800 Temperature (°C) S p e c if ic H e a t ( J /g° C )
Westrock Gypsum Type Regular Heavy Gypsum Type X 15.9mm (1) Gypsum Type X 15.9mm (2) Gypsum Type X 15.9 mm (3) Gypsum Type X 12.5 mm (1) Gypsum Type X 12.5mm (2) Regular Gypsum FR Gypsum
Figure 4. Specific heat of gypsum wallboard
3.2.2 Specific heat of insulation
Figures 5 and 6 show the specific heat of insulation versus temperature for a number of insulation materials. The measurements of the specific heat were conducted at a heating rate of 5°C/min. Figure 5 illustrates the curves for new insulation and Figure 6 depicts the specific heat for reheated insulation. The reason for the pre-heat of the insulation is to eliminate any heat contribution that is produced by the new insulation during the heating process. In all the new insulation tested, there is a gradual increase in the specific heat up to a temperature ranging between 300 and 350°C. This is followed by a rapid decrease from roughly 330°C to 470°C, then by a rapid increase to 600°C, and finally a slight variation after 600°C. In the temperature range of 330°C to 600°C, there is formation of peaks, which is an indication of the amount of energy required to raise the temperature of materials. For the pre-heated insulation, there is a slow rise in specific heat between 40°C and 350°C. From 350°C to 650°C, there is a
gradual decrease, and then a sharp increase from 650°C to 690°C. As shown in the figures, when the material is pre-heated, the peaks are less pronounced and they occur at later temperatures between 600 and 700°C. This is due to that fact the insulation was reheated and, consequently, does not generate a lot of heat that will contribute to raising the temperatures to high levels. For both rock fibre and glass fibre, the specific heat does not show any peak value, which may be due to the early stop of the measurements. In these insulation types, the specific heat increases with temperature and reaches a maximum of approximately 0.8971 J/g/°C at roughly 260°C for glass fibre and 1.401 J/g°C at about 410°C for rock fibre. The specific heat decreases for glass fibre after 260°C and reaches a value of 0.8764 J/g/°C at 350°C. In addition, the reproducibility of the calorimetric curves at 5°C/min was investigated by using two insulation samples (mineral wool 1, 2 and 3) weighing approximately between 26 and 31 mg. The reproducibility was found to be reasonable but there is some deterioration at high temperatures, especially at the peak value and after 600°C. Finally, overall, there is some agreement in the trend and the difference in the specific heat data values may be attributed to the difference in the insulation composition. All of the specific heat curves can be approximated by linear or polynomial fits as a function of temperature.
-1.0 -0.5 0.0 0.5 1.0 1.5 2.0 0 100 200 300 400 500 600 700 800 Temperature (°C) S p e c if ic H e a t ( J /g° C )
Rock Fibre Insulation Mineral Wool (1) Mineral Wool (2) Glass Fibre Insulation SBP - Millboard Fibre Insulation
0.0 0.2 0.4 0.6 0.8 1.0 1.2 1.4 0 100 200 300 400 500 600 700 800 Temperature (°C) S p eci fi c H eat ( J/ g °C ) Mineral Wool (1) Mineral Wool (2) Mineral Wool (3)
SBP - Millboard Fibre Insulation
Figure 6. Specific heat of insulation (pre-heated)
3.3 Mass Loss
As in the case of specific heat, an increase in the rate of heating usually shifts the reaction temperature to a higher level and narrows the temperature interval of the reaction in the thermogravimetric curves. Figures 7 and 8 show the results of the mass loss measurements.
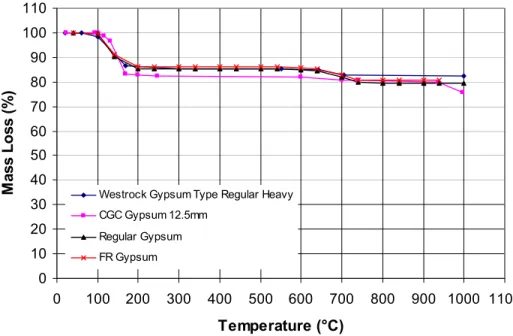
3.3.1 Mass loss of gypsum wallboard
The test results from the TGA analysis are summarized in Figure 7 for all the gypsum wallboards tested. The mass loss remains almost unchanged up to 100°C. Between 100 and 160°C, the mass loss of the different boards decreases between 15% and 17% as moisture is driven off. These results are reasonable as gypsum with no additives contains about 21% by mass of water. Between about 160°C and 650°C, the mass loss remains fairly constant, then it decreases, and again changes very little between 740°C and 1000°C. This trend can be approximated by a linear fit. In addition, as stated earlier, with a lower heating rate employed, this mass loss would have occurred at lower temperatures.
0 10 20 30 40 50 60 70 80 90 100 110 0 100 200 300 400 500 600 700 800 900 1000 1100 Temperature (°C) M ass L o ss ( % )
Westrock Gypsum Type Regular Heavy CGC Gypsum 12.5mm
Regular Gypsum FR Gypsum
Figure 7. Mass loss of gypsum wallboard
3.3.2 Mass loss of insulation
Figure 8 shows the test results of the mass ratio for insulation versus temperature. The mass loss of rock fibre insulation increases gradually from 0% (100% mass remaining) at 25°C to 6% (94% mass remaining) at 1000°C. The mass loss of the glass fibre insulation increases almost linearly with temperature from 0% (100% mass remaining) at 36°C to 6% (94% mass remaining) at 310°C. After this point, it remains constant until it melts. As indicated on the figure, the insulation density ratio is different for different test specimens due to their chemical composition and their melting point. The fast mass loss and substantial decrease in density for glass fibre insulation is caused by the dissociation and decomposition of components in the insulation in the early temperatures. Based on the very limited data, the mass loss versus temperature graphs can be approximated by linear fit curves.
0.90 0.92 0.94 0.96 0.98 1.00 1.02 0 100 200 300 400 500 600 700 800 900 1000 1100 Temperature (°C) M ass L o ss
Rock Fibre insulation
Glass Fibre Insulation
Figure 8. Mass loss of insulation
3.4 Thermal Expansion/Contraction
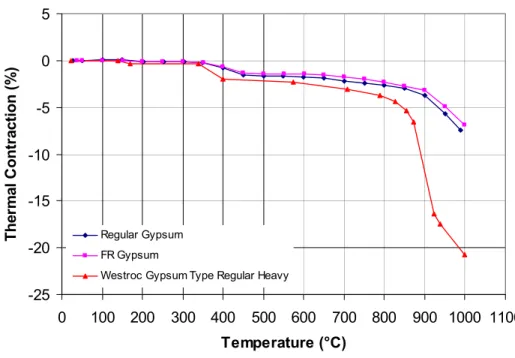
3.4.1 Thermal contraction of gypsum wallboard
The variation of thermal expansion and contraction with temperature for the gypsum wallboards tested is depicted in Figure 9. Both regular gypsum and FR gypsum exhibit almost the same behaviour with FR gypsum showing less contraction. They shrink very slowly up to 350°C, then between 350°C and 450°C, the contraction is more rapid, and it slows down again up to 900°C. From 900°C to 1000°C, the contraction is very rapid. On the other hand, the Westrock Heavy gypsum board experiences more contraction than regular and FR gypsum wallboards throughout the temperature range between 30 and 1000°C. Although, for all types of gypsum wallboards tested, the impact of contraction on the density of the gypsum is not great (see Figure 7), the contraction at high temperatures has a profound influence on the heat transfer in wood-framed wall and floor assemblies. The contraction is responsible for the development of cracks and fissures in the board, as well as for the opening up of the joints between boards in full-scale test specimens, the occurrence of which may lead to the premature failure of wood-framed wall and floor assemblies. The differences in the values of the thermal contraction of the gypsum wallboards can be attributed to the change in chemical composition from one test specimen to another, which affects the temperature at which the dissociation of components in each material. The differences may also be due to the time and duration of dehydration for each specimen. In addition, the temperature dependence of the thermal expansion and contraction of gypsum wallboards can be approximated by linear fits.
-25 -20 -15 -10 -5 0 5 0 100 200 300 400 500 600 700 800 900 1000 1100 Temperature (°C) The rm a l C ont ra c tion (% ) Regular Gypsum FR Gypsum
Westroc Gypsum Type Regular Heavy
Figure 9. Thermal contraction of gypsum wallboard
4 SUMMARY
Traditionally, the fire resistance of load-bearing members has been determined by testing methods, which have drawbacks, including high cost and time requirements, limitations of the specimen geometry and loading, effect of restraint and reproducibility. Hence, they should be conducted mainly to validate the outcome of a fire resistance method, to assist in developing new methods, or to permit studies of the effects of variables on the performance of materials. In recent years, the use of analytical and numerical methods for predicting the fire resistance of load-bearing structural members has been gaining acceptance. These calculation methods are becoming more popular and may well serve the needs of performance-based codes, under which any type of exposure could be considered. However, in order to develop calculation methods and facilitate their use, the building material properties at elevated temperatures are required and must be available.
For wood-framed assemblies, these material properties are affected by temperature, moisture content, density, and grain orientation. Thermal properties, at elevated temperatures, are important for defining the heat transfer behaviour of, as well as the temperature distribution inside wood-framed assemblies. This definition is also essential to an accurate assessment of the structural behaviour. The thermal properties include thermal conductivity, specific heat, mass loss and thermal expansion or contraction. Many researchers have reported values for these thermo-physical properties of the different components of the assembly, i.e., wood, lining and insulation, either based on experimental tests or on best fitting from numerical analysis. The literature has shown that the information available to describe these properties is limited, and when it does exist, it is often inconsistent and scattered.4
To verify the models for fire resistance behaviour of wood-framed assemblies, NRC has carried out a number of tests on thermal properties of components of lightweight wood-framed assemblies, the results of which are described in this report. The data presented in this study can be used as input into existing computer programs to determine the behaviour of wood-framed load-bearing assemblies at elevated temperatures.
Based on the experimental data presented, the following points can be summarized: • The thermal conductivity of wood, gypsum wallboard and insulation shows a general
trend as a function of temperature.
• The thermal conductivity of glass fibre is generally higher than that of rock fibre and millboard fibre especially after 500°C.
• The specific heat of gypsum wallboard exhibits a peak value, as an indication of the considerable amount of heat needed to dehydrate the water in the gypsum. Hence, the gypsum wallboard plays a major part of fire resistant wood-frame assemblies, as it retards the failure of the assembly until, at least, the drying process of the gypsum is complete. The temperature at which the peak occurs depends on the rate of heating.
• The specific heat of insulation also exhibits a peak value, which is less pronounced when the insulation is pre-heated.
• The mass loss of gypsum wallboard occurs most in the temperature range between 100 and 160°C. The maximum mass loss observed was 24.5% at 1000°C.
• The mass loss of glass fibre is significant before reaching a temperature of 300°C. On the other hand, the mass loss in rock fibre and millboard fibre is spread over the temperature range of interest (1000°C).
• The thermal contraction of gypsum wallboard is gradual up to about 800°C, after which the contraction becomes more significant.
• In all the tests conducted, the chemical composition of the specimen had an effect on the thermal property tested.
Finally, it should be noted that some of the materials were not tested for some thermal properties. In the next phase of testing, the matrix of thermal properties of different components of wood-framed assemblies will be completed.
5 CURRENT AND FURTHER RESEARCH
At present, studies are in progress, within the collaborative effort between NRC and the Canadian wood industry, to complete the matrix of data for thermal properties at elevated temperatures and to develop mechanical properties for wood and gypsum at elevated temperatures. The data on thermal and mechanical properties will be used to develop thermal and mechanical relationships, as a function of temperature, for wood, lining material and insulation material. These relationships can be used as an input to numerical computer models, which can be used to predict the behaviour of structural lightweight wood-framed assemblies at high temperatures. The development of computer models is in progress at NRC, for the calculation of fire resistance of lightweight wood-framed wall and floor assemblies. Along with this, full-scale tests on wood-framed walls and floors are being carried out to verify the computer models. These computer models will be used to conduct detailed parametric studies to determine the influence of various parameters, such as wood strength, load intensity and stud/joist spacing on the fire resistance of lightweight wood-framed assemblies. Results from the
parametric studies will be used to develop simplified design equations and guidelines for predicting the fire resistance of lightweight wood-framed assemblies.
Acknowledgements
The research presented in this report is part of a partnership between the National Research Council of Canada and the Canadian wood industry (Forintek Canada Corp.). The authors would like to acknowledge the efforts of the technical staff at the Institute for Research in Construction for conducting the tests on the thermal properties.
NOMENCLATURE
ρ = density
cp = specific heat
k = thermal conductivity
l = length of sample at temperature T lo = original length of sample
M = mass of sample at temperature T Mo = original mass of sample
T = temperature
REFERENCES
1. CAN/ULC-S101-M89, Standard Methods of Fire Endurance Tests of Building Construction and Materials, Underwriters' Laboratories of Canada, Scarborough, Canada, 1989.
2. ASTM E119, Standard Methods of Fire Tests of Building Construction and Materials, American Society for Testing and Materials, Philadelphia, USA, 1995. 3. National Building Code of Canada, Canadian Commission on Building and Fire
Codes, Institute for Research in Construction, National Research Council of Canada, Ottawa, Canada, 1995.
4. Benichou, N. and Sultan, M.A., “Fire Resistance of Lightweight Wood-Framed Assemblies: State-of-the-Art Report,” IRC Internal Report No. 776, National Research Council of Canada, Ottawa, Canada, 1999.
5. Harmathy, T.Z., “Properties of Building Materials at Elevated Temperatures,” DBR Paper No. 1080, Division of Building Research, National Research Council of Canada, Ottawa, Canada, 1983.
APPENDIX A
A.1. Thermal Conductivity of Wood
5/8 plywood 2x4 Spruce (1) 2x4 Spruce (2) 2x4 Spruce (3) 2 x 4 Spruce (4) °C W/m°C °C W/m°C °C W/m°C °C W/m°C °C W/m°C 24 0.106 24 0.130 21 0.078 21 0.100 29 0.086 60 0.116 52 0.134 75 0.081 78 0.115 93 0.074 103 0.116 100 0.140 100 0.085 127 0.101 150 0.109 146 0.115 147 0.150 120 0.094 153 0.102 216 0.113 205 0.135 200 0.155 147 0.099 175 0.103 260 0.048 309 0.202 250 0.081 174 0.101 200 0.100 300 burned 522 0.173 200 0.101 232 0.089 231 0.091 340 0.112 263 0.058 364 0.121 323 0.122 450 0.192 462 0.188
A.2. Thermal Conductivity of Gypsum Regular Gypsum FR Gypsum Gypsum regular heavy Gypsum regular light Gypsum X 15.9mm Gypsum X 12.5mm °C W/m° C °C W/m° C °C W/m° C °C W/m° C °C W/m° C °C W/m° C 28 0.355 28 0.355 25 0.200 27 0.153 27 0.246 22 0.230 242 0.217 242 0.217 27 0.207 27 0.153 27 0.244 22 0.232 444 0.240 444 0.240 73 0.191 92 0.149 75 0.218 22 0.227 596 0.267 596 0.267 79 0.191 91 0.147 75 0.218 71 0.205 780 0.285 780 0.285 103 0.123 202 0.096 121 0.149 73 0.209 918 0.232 918 0.232 103 0.123 202 0.096 121 0.149 119 0.155 918 0.323 918 0.323 204 0.110 300 0.101 200 0.118 121 0.148 1016 0.518 1016 0.518 204 0.110 300 0.102 200 0.119 121 0.152 299 0.117 399 0.113 302 0.120 197 0.118 299 0.117 399 0.113 301 0.121 301 0.115 398 0.120 504 0.124 394 0.131 302 0.119 398 0.120 505 0.123 394 0.131 299 0.122 497 0.124 601 0.124 498 0.137 298 0.122 497 0.124 607 0.136 498 0.137 390 0.110 598 0.134 713 0.168 602 0.151 393 0.121 598 0.134 716 0.167 602 0.152 394 0.121 703 0.150 825 0.159 708 0.168 495 0.122 703 0.151 827 0.165 708 0.170 596 0.125 807 0.158 929 0.202 808 0.160 601 0.125 807 0.158 932 0.238 813 0.172 602 0.140 907 0.236 1028 0.412 924 0.283 696 0.137 907 0.236 1028 0.416 925 0.303 707 0.147 1005 0.310 707 0.147
1005 0.304 808 0.141 810 0.147 810 0.152 915 0.195 916 0.212 917 0.275 1012 0.825 1014 1.106 1015 0.942
A.3. Thermal Conductivity of Insulation
Roxul insulation CGC Roxul insulation Glass fiber insulation Millboard - Southport Board Products °C W/m°C °C W/m°C °C W/m°C °C W/m°C 28 0.028 25 0.026 24 0.022 26 0.046 28 0.028 101 0.036 100 0.029 26 0.045 84 0.034 194 0.054 198 0.051 78 0.049 80 0.034 297 0.076 299 0.082 78 0.050 105 0.036 396 0.119 407 0.131 152 0.055 105 0.036 501 0.166 515 0.204 153 0.058 201 0.051 602 0.242 632 1.587 consumed 203 0.067 201 0.051 724 0.207 203 0.066 299 0.065 856 0.229 299 0.078 298 0.065 959 0.278 299 0.075 396 0.080 1066 0.352 397 0.081 396 0.080 1066 0.352 397 0.082 501 0.100 498 0.094 500 0.102 499 0.094 608 0.135 600 0.111 609 0.134 600 0.114 742 0.207 701 0.132 741 0.209 701 0.132 843 0.240 802 0.165 843 0.239 802 0.165 948 0.282 902 0.199 948 0.279 902 0.199 1050 0.339 1011 0.199 1050 0.383 1011 0.199
A.4. Specific Heat of Gypsum
Regular Gypsum FR Gypsum Westrock heavy °C J/g°C °C J/g°C °C J/g°C
50 0.951 50 0.884 40 1.2935 100 3.911 100 4.362 50 1.3692 150 0.933 150 0.823 60 1.7170
200 0.422 200 0.396 70 2.3425 250 0.274 250 0.216 80 3.4381 300 0.030 300 0.031 90 5.2944 350 -0.602 350 -0.543 100 9.1783 400 -0.302 400 -0.249 110 13.779 450 -0.297 450 -0.237 120 16.841 500 -0.367 500 -0.298 130 3.5305 550 -0.275 550 -0.243 140 1.1630 600 0.007 600 -0.013 150 0.8965 160 0.8028 170 0.7501 180 0.7174 190 0.6813 200 0.6442 210 0.6128 220 0.5837 230 0.5505 240 0.5176 250 0.4790 260 0.4503 270 0.4348 280 0.4204 290 0.3946 300 0.3432 310 0.2574 320 0.1207 330 -0.0681 340 -0.2823 350 -0.3408 360 -0.2868 370 -0.2246 380 -0.1502 390 -0.0963 400 -0.0670 410 -0.0464 420 -0.0343 440 -0.0215 450 -0.0086 460 0.0068 470 0.0117 480 0.0018 490 -0.0388 500 -0.0810 510 -0.0475 520 -0.0502 530 -0.0810 540 -0.1126 550 -0.1296 560 -0.0954 570 -0.0045 580 0.0456
590 0.1257 600 0.2309 610 0.3585 620 0.4607 630 0.5225 640 0.5359 650 0.5218 660 0.2840 670 -0.0278 680 -0.1654 690 -0.2145
Type X 12.5 (1) Type X 12.5 (2) Type X 15.9 (1) Type X 15.9 (2) Type X 15.9 (3) °C J/g°C °C J/g°C °C J/g°C °C J/g°C °C J/g°C 42 0.8942 42 1.3309 42 0.8480 42 0.948 42 1.2017 44 0.9048 44 1.1918 44 0.8609 44 0.9601 44 1.0969 46 0.9268 46 1.1246 46 0.8601 46 0.9861 46 1.0508 48 0.9481 48 1.086 48 0.8747 48 1.0092 48 1.0264 50 0.9788 50 1.0583 50 0.9280 50 1.0405 50 1.0095 52 0.9942 52 1.0144 52 0.9437 52 1.0736 52 0.9731 54 0.2788 54 0.9995 54 0.9190 54 1.0618 54 0.9622 56 1.0501 56 1.0068 56 0.9501 56 1.1445 56 0.9727 58 1.3040 58 1.0238 58 0.9663 58 1.3997 58 0.9924 60 1.5484 60 1.0476 60 0.9782 60 1.6151 60 1.0176 62 1.7049 62 1.0752 62 0.9807 62 1.6770 62 1.0453 64 1.6418 64 1.1087 64 0.9924 64 1.3970 64 1.0783 66 1.3821 66 1.1518 66 0.9972 66 1.2898 66 1.1199 68 1.4865 68 1.2032 68 1.0055 68 1.3752 68 1.1682 70 1.7367 70 1.2578 70 1.0231 70 1.5825 70 1.2182 72 2.1346 72 1.3129 72 1.0295 72 1.9011 72 1.2668 74 2.7560 74 1.3651 74 1.0447 74 2.4108 74 1.3120 76 3.5232 76 1.4022 76 1.0759 76 3.0659 76 1.3381 78 4.4841 78 1.4264 78 1.0892 78 3.8935 78 1.3456 80 5.6056 80 1.4430 80 1.1078 80 4.8659 80 1.3347 82 6.8596 82 1.4460 82 1.1297 82 5.9617 82 1.3061 84 8.3185 84 1.4384 84 1.1608 84 7.2383 84 1.2849 86 9.7813 86 1.4487 86 1.1843 86 8.5337 86 1.2890 88 11.390 88 1.5005 88 1.2179 88 10.008 88 1.3287 90 13.046 90 1.6013 90 1.2780 90 11.679 90 1.4058 92 14.652 92 1.7505 92 1.3453 92 13.542 92 1.5220 94 16.688 94 1.9441 94 1.4846 94 16.138 94 1.6737 96 19.275 96 2.1799 96 1.7755 96 19.446 96 1.8602 98 22.253 98 2.4611 98 2.3411 98 23.229 98 2.0846 100 24.323 100 2.7965 100 3.2449 100 25.752 100 2.3602 102 25.049 102 3.1746 102 4.5958 102 28.747 102 2.6731 104 23.274 104 3.5974 104 6.3307 104 29.264 104 3.0264 106 18.398 106 4.0514 106 8.4800 106 26.669 106 3.4212 108 8.9021 108 4.5302 108 11.102 108 18.996 108 3.8529 110 2.7905 110 5.0197 110 14.586 110 7.2780 110 4.3194 112 1.4954 112 5.5291 112 19.135 112 2.2613 112 4.8146
114 1.1200 114 6.0561 114 23.794 114 1.4051 114 5.3364 116 1.0024 116 6.6149 116 26.864 116 1.1589 116 5.8839 118 0.9588 118 7.2111 118 26.553 118 1.0705 118 6.4690 120 0.9326 120 7.8632 120 21.847 120 1.0275 120 7.1072 122 0.9153 122 8.5963 122 13.676 122 1.0088 122 7.8291 124 0.9012 124 9.4066 124 6.1558 124 0.9948 124 8.6373 126 0.8933 126 10.277 126 11.824 126 0.9830 126 9.5151 128 0.8887 128 11.175 128 13.724 128 0.9854 128 10.413 130 0.8868 130 12.042 130 14.322 130 0.9835 130 11.271 132 0.8757 132 12.841 132 12.893 132 0.9824 132 12.099 134 0.8779 134 13.391 134 5.7791 134 0.9867 134 12.871 136 0.8747 136 13.668 136 2.6578 136 0.9864 136 13.551 138 0.8718 138 13.784 138 1.9243 138 0.9788 138 14.000 140 0.8689 140 13.798 140 1.6152 140 0.9797 140 14.231 142 0.8735 142 13.585 142 1.4449 142 0.9798 142 14.267 144 0.8700 144 13.058 144 1.3417 144 0.9817 144 14.016 146 0.8688 146 12.120 146 1.2692 146 0.9792 146 13.546 148 0.8706 148 10.926 148 1.2267 148 0.9802 148 12.815 150 0.8709 150 9.4823 150 1.1976 150 0.9808 150 11.786 152 0.8712 152 7.8080 152 1.1731 152 0.9798 152 10.566 154 0.8775 154 5.9424 154 1.1684 154 0.9852 154 9.1333 156 0.8791 156 4.1131 156 1.1561 156 0.9879 156 7.2802 158 0.8828 158 2.7787 158 1.1563 158 0.9863 158 5.1598 160 0.8824 160 2.0228 160 1.1470 160 0.9857 160 3.3584 162 0.8827 162 1.6153 162 1.1399 162 0.9920 162 2.2780 164 0.8881 164 1.3820 164 1.1464 164 1.0011 164 1.7109 166 0.8866 166 1.2409 166 1.1462 166 1.0017 166 1.4032 168 0.8907 168 1.1511 168 1.1462 168 1.0032 168 1.2276 170 0.8964 170 1.0916 170 1.1470 170 1.0061 170 1.1207 172 0.8984 172 1.0525 172 1.1396 172 1.0096 172 1.0525 174 0.9069 174 1.0261 174 1.1434 174 1.0155 174 1.0077 176 0.9174 176 0.9957 176 1.1682 176 1.0329 176 0.9657 178 0.9178 178 0.9605 178 1.1705 178 1.0359 178 0.9215 180 0.9320 180 0.9293 180 1.1806 180 1.0488 180 0.8839 182 0.9403 182 0.9006 182 1.1852 182 1.0571 182 0.8510 184 0.9451 184 0.8754 184 1.1854 184 1.0587 184 0.8212 186 0.9573 186 0.8516 186 1.2006 186 1.0731 186 0.7943 188 0.9620 188 0.8291 188 1.1933 188 1.0765 188 0.7695 190 0.9727 190 0.8079 190 1.2053 190 1.0882 190 0.7457 192 0.9776 192 0.7868 192 1.2096 192 1.0923 192 0.7230 194 0.9929 194 0.7697 194 1.2253 194 1.1096 194 0.7064 196 1.0105 196 0.7627 196 1.2432 196 1.1221 196 0.6999 198 1.0088 198 0.7850 198 1.2371 198 1.1186 198 0.7264 200 1.0146 200 0.8174 200 1.2785 200 1.1250 200 0.7565
A.5. Specific Heat of Insulation
Rock insulation Mineral Wool 1 Mineral Wool 2 Millboard Southport Board Products Glass fibre °C J/g°C °C J/g°C °C J/g°C °C J/g°C °C J/g°C 40 1.062 40 0.6317 40 0.7559 40 0.7291 40 0.7580 50 1.082 50 0.6811 50 0.7736 50 0.7775 50 0.7745 60 1.099 60 0.6916 60 0.7720 60 0.7569 60 0.7895 70 1.116 70 0.6942 70 0.7664 70 0.7295 70 0.8016 80 1.132 80 0.6988 80 0.7597 80 0.7115 80 0.8087 90 1.145 90 0.7021 90 0.7569 90 0.6968 90 0.8211 100 1.156 100 0.7077 100 0.7526 100 0.6854 100 0.8318 110 1.169 110 0.7295 110 0.7529 110 0.6512 110 0.8456 120 1.182 120 0.7430 120 0.7528 120 0.6866 120 0.8388 130 1.193 130 0.7801 130 0.7918 130 0.6973 130 0.8451 140 1.204 140 0.7545 140 0.7493 140 0.6989 140 0.8499 150 1.216 150 0.7719 150 0.7492 150 0.7058 150 0.8513 160 1.227 160 0.7798 160 0.7529 160 0.7164 160 0.8578 170 1.237 170 0.8071 170 0.7587 170 0.7232 170 0.8618 180 1.252 180 0.8222 180 0.7628 180 0.7262 180 0.8647 190 1.265 190 0.8388 190 0.7670 190 0.7332 190 0.8735 200 1.275 200 0.8590 200 0.7735 200 0.7394 200 0.8798 210 1.285 210 0.8724 210 0.7788 210 0.7434 210 0.8816 220 1.291 220 0.8825 220 0.7843 220 0.7438 220 0.8817 230 1.302 230 0.8958 230 0.7949 230 0.7483 230 0.8868 240 1.315 240 0.9011 240 0.7968 240 0.7468 240 0.8922 250 1.315 250 0.9010 250 0.7881 250 0.7452 250 0.8949 260 1.326 260 0.8840 260 0.7733 260 0.7449 260 0.8971 270 1.330 270 0.8647 270 0.7511 270 0.7519 270 0.8918 280 1.336 280 0.8397 280 0.7210 280 0.7642 280 0.8912 290 1.342 290 0.8123 290 0.6941 290 0.8012 290 0.8876 300 1.343 300 0.7808 300 0.6681 300 0.8393 300 0.8884 310 1.347 310 0.7423 310 0.6384 310 0.7792 310 0.8872 320 1.352 320 0.6979 320 0.6094 320 0.6700 320 0.8887 330 1.354 330 0.6434 330 0.5659 330 0.6117 330 0.8939 340 1.357 340 0.5655 340 0.5084 340 0.5301 340 0.8839 350 1.359 350 0.4744 350 0.4233 350 0.4612 350 0.8764 360 1.363 360 0.3790 360 0.3231 360 0.4178 370 1.370 370 0.2882 370 0.2170 370 0.3661 380 1.380 380 0.2040 380 0.1284 380 0.3202 390 1.387 390 0.1357 390 0.0407 390 0.2876 400 1.392 400 0.0817 400 -0.0453 400 0.2681 410 1.401 410 0.0308 410 -0.1339 410 0.2598 420 -0.0349 410 -0.1339 420 0.2635 430 -0.1161 430 -0.3277 420 0.2635 440 -0.2224 440 -0.4523 440 0.2824 450 -0.3284 450 -0.5762 450 0.3020 460 -0.4035 460 -0.693 460 0.3238 470 -0.4552 470 -0.7653 470 0.3396
480 -0.4294 480 -0.7048 480 0.3491 490 -0.4064 490 -0.5237 490 0.3583 500 -0.4175 500 -0.4625 500 0.3676 510 -0.3916 510 -0.4626 510 0.3664 520 -0.2815 520 -0.2698 520 0.3689 530 -0.1395 530 -0.0824 530 0.3665 540 -0.0509 540 -0.0592 540 0.3586 550 -0.0182 550 -0.0321 550 0.3484 560 0.0325 560 0.1302 560 0.3431 570 0.1937 570 0.2559 570 0.3242 580 0.4415 580 0.3385 580 0.3108 590 0.5703 590 0.3666 590 0.2933 600 0.6816 600 0.3663 600 0.2739 610 0.7007 610 0.3568 610 0.2553 620 0.6779 620 0.3502 620 0.2447 630 0.6443 630 0.3433 630 0.2652 640 0.6223 640 0.3447 640 0.2806 650 0.6111 650 0.3409 650 0.2810 660 0.6161 660 0.3485 660 0.2854 670 0.6388 670 0.3690 670 0.2791 680 0.7081 680 0.4247 680 0.2546 690 0.7555 690 0.4894 Mineral Wool 1 Preheated Mineral Wool 2 Preheated Mineral Wool 3 Preheated Millboard Preheated Southport Board Products °C J/g°C °C J/g°C °C J/g°C °C J/g°C 40 0.6759 40 1.2056 40 0.6921 40 0.6705 50 0.6786 50 1.1799 50 0.7009 50 0.6712 60 0.6852 60 1.1538 60 0.7109 60 0.6726 70 0.6930 70 1.1334 70 0.7195 70 0.6766 80 0.7017 80 1.1156 80 0.7303 80 0.6812 90 0.7052 90 1.0879 90 0.7359 90 0.6848 100 0.7085 100 1.0588 100 0.7421 100 0.6868 110 0.7135 110 1.0352 110 0.7487 110 0.6897 120 0.7277 120 1.0106 120 0.644 120 0.6966 130 0.7592 130 0.9855 130 0.7946 130 0.7358 140 0.7276 140 0.9620 140 0.7664 140 0.7062 150 0.7334 150 0.9382 150 0.7723 150 0.7140 160 0.7372 160 0.9115 160 0.7810 160 0.7224 170 0.7430 170 0.8865 170 0.7831 170 0.7279 180 0.7429 180 0.8639 180 0.7849 180 0.7266 190 0.7430 190 0.8395 190 0.7886 190 0.7284 200 0.7448 200 0.8076 200 0.7943 200 0.7313 210 0.7468 210 0.7832 210 0.7965 210 0.7316 220 0.7482 220 0.7680 220 0.7987 220 0.7327 230 0.7596 230 0.7578 230 0.8055 230 0.7364 240 0.7618 240 0.7395 240 0.8066 240 0.7374 250 0.7600 250 0.7111 250 0.8081 250 0.7322 260 0.7618 260 0.6881 260 0.8095 260 0.7287
270 0.7624 270 0.6766 270 0.8172 270 0.7332 280 0.7620 280 0.6636 280 0.8208 280 0.7362 290 0.7661 290 0.6442 290 0.8256 290 0.7431 300 0.7683 300 0.6273 300 0.8318 300 0.7538 310 0.7753 310 0.6022 310 0.8382 310 0.7642 320 0.7860 320 0.5787 320 0.8507 320 0.7793 330 0.7919 330 0.5618 330 0.8587 330 0.7887 340 0.7958 340 0.5463 340 0.8626 340 0.7906 350 0.8007 350 0.5380 350 0.8623 350 0.7900 360 0.8022 360 0.5180 360 0.8617 360 0.7891 370 0.7958 370 0.4961 370 0.8635 370 0.7925 380 0.7891 380 0.4854 380 0.8586 380 0.7888 390 0.7814 390 0.4782 390 0.8532 390 0.7828 400 0.7699 400 0.4750 400 0.8427 400 0.7767 410 0.7574 410 0.4569 410 0.8372 410 0.7712 420 0.7537 420 0.4407 420 0.8276 420 0.7613 430 0.7400 430 0.4349 420 0.8276 420 0.7613 440 0.7477 440 0.4262 440 0.8118 440 0.7350 450 0.7147 450 0.4176 450 0.8021 450 0.7212 460 0.6973 460 0.4224 460 0.7856 460 0.7125 470 0.6804 470 0.4303 470 0.7683 470 0.6962 480 0.6608 480 0.4253 480 0.7521 480 0.6859 490 0.6513 490 0.4101 490 0.7337 490 0.6769 500 0.6296 500 0.4048 500 0.7155 500 0.6641 510 0.6115 510 0.4018 510 0.6896 510 0.6481 520 0.5971 520 0.3962 520 0.6670 520 0.6331 530 0.5821 530 0.3739 530 0.6447 530 0.6215 540 0.5626 540 0.3481 540 0.6207 540 0.6072 550 0.5387 550 0.3367 550 0.5974 550 0.5874 560 0.5237 560 0.3489 560 0.5806 560 0.5733 570 0.5075 570 0.3610 570 0.5536 570 0.5561 580 0.5119 580 0.3484 580 0.5310 580 0.5366 590 0.5314 590 0.3347 590 0.5178 590 0.5206 600 0.5278 600 0.3378 600 0.4994 600 0.4949 610 0.5164 610 0.3537 610 0.4725 610 0.4719 620 0.5046 620 0.3478 620 0.4392 620 0.4476 630 0.4905 630 0.3587 630 0.4200 630 0.4361 640 0.4870 640 0.3461 640 0.4018 640 0.4407 650 0.4823 650 0.3199 650 0.3796 650 0.4735 660 0.4912 660 0.2978 660 0.3735 660 0.4986 670 0.5302 670 0.2457 670 0.3837 670 0.4823 680 0.5903 680 0.2107 680 0.4495 680 0.4559 690 0.676 690 0.1906
A.6. Mass Loss of Gypsum
Regular Gypsum FR Gypsum Westrock heavy Gypsum X 12.5 mm °C M/Mo (%) °C M/Mo (%) °C M/Mo (%) °C M/Mo (%) 40 100.1 40 100.1 20 100.0 23.00 100.0 100 99.5 100 99.5 62 100.0 92.00 100.0 140 90.5 140 91.1 100 98.28 100.0 99.80 200 85.5 200 86.3 169 86.62 115.4 98.75 240 85.4 240 86.3 300 85.30 130.8 96.70 300 85.4 300 86.3 550 85.18 169.2 83.04 340 85.4 340 86.3 642 84.95 200.0 82.61 400 85.3 400 86.3 704 82.62 247.1 82.46 440 85.4 440 86.3 1000 82.54 600.0 82.17 500 85.4 500 86.3 700.0 80.65 540 85.4 540 86.2 740.7 80.64 600 85.1 600 85.9 937.0 80.00 640 84.6 640 85.5 995.7 75.55 700 82.0 700 83.0 740 79.8 740 80.8 800 79.6 800 80.8 840 79.6 840 80.8 900 79.6 900 80.9 940 79.6 940 80.9 1000 79.4
A.7. Mass Loss of Insulation
Roxul insulation Fiber glass insulation °C M (g) M/Mo (%) °C M (g) M/Mo (%) 25 46.7 1 36 13.3 1 100 46.6 0.9979 104 13.0 0.9774 194 46.0 0.9850 203 12.8 0.9624 311 45.9 0.9829 310 12.5 0.9398 400 45.7 0.9786 410 12.5 0.9398 543 45.6 0.9764 516 12.5 0.9398 600 45.4 0.9722 595 melted melted 720 45.3 0.9700 810 45.3 0.9700 924 44.7 0.9572 1000 43.9 0.9400
A.8. Thermal Expansion/Contraction of Gypsum
Regular Gypsum FR Gypsum Plasterboard Westrock °C ∆L/Lo (%) °C ∆L/Lo (%) °C ∆L/Lo (%) 27 0.000 38 0.002 23 0.000 50 0.010 51 -0.022 139 0.000 100 0.089 101 -0.038 169 -0.313 150 0.053 151 -0.069 338 -0.313 202 -0.121 200 -0.148 400 -2.031 253 -0.098 250 -0.145 573 -2.343 303 -0.133 301 -0.156 707 -3.125 350 -0.229 351 -0.217 788 -3.750 400 -0.765 400 -0.685 827 -4.375 450 -1.556 451 -1.322 855 -5.313 500 -1.667 500 -1.390 873 -6.563 549 -1.695 550 -1.394 923 -16.406 600 -1.768 601 -1.425 938 -17.500 650 -1.924 650 -1.521 999 -20.740 700 -2.169 700 -1.740 750 -2.401 750 -2.018 800 -2.644 800 -2.311 850 -2.978 850 -2.766 900 -3.729 900 -3.213 950 -5.710 950 -4.940 989 -7.3999 1000 -6.853