HAL Id: inserm-00094845
https://www.hal.inserm.fr/inserm-00094845
Submitted on 15 Sep 2006
HAL is a multi-disciplinary open access
archive for the deposit and dissemination of
sci-entific research documents, whether they are
pub-lished or not. The documents may come from
teaching and research institutions in France or
abroad, or from public or private research centers.
L’archive ouverte pluridisciplinaire HAL, est
destinée au dépôt et à la diffusion de documents
scientifiques de niveau recherche, publiés ou non,
émanant des établissements d’enseignement et de
recherche français ou étrangers, des laboratoires
publics ou privés.
poor-prognosis breast carcinoma.
Ivan Bièche, Sengül Tozlu, Igor Girault, Rosette Lidereau
To cite this version:
Ivan Bièche, Sengül Tozlu, Igor Girault, Rosette Lidereau. Identification of a three-gene expression
signature of poor-prognosis breast carcinoma.. Molecular cancer [electronic resource], 2004, 3, pp.37.
�10.1186/1476-4598-3-37�. �inserm-00094845�
BioMedCentral
Molecular Cancer
Open Access
Research
Identification of a three-gene expression signature of
poor-prognosis breast carcinoma
Ivan Bièche*
1,2, Sengül Tozlu
1, Igor Girault
1and Rosette Lidereau
1Address: 1Laboratoire d'Oncogénétique – INSERM E0017, Centre René Huguenin, St-Cloud, France and 2Laboratoire de Génétique Moléculaire – UPRES EA 3618, Faculté des Sciences Pharmaceutiques et Biologiques, Université René Descartes – Paris V, Paris, France
Email: Ivan Bièche* - i.bieche@stcloud-huguenin.org; Sengül Tozlu - oncogenetique@stcloud-huguenin.org; Igor Girault - i.girault@stcloud-huguenin.org; Rosette Lidereau - r.lidereau@stcloud-huguenin.org
* Corresponding author
Breast cancerGene expression profilingReal-time RT-PCR quantificationPrognostic value
Abstract
Background: The clinical course of breast cancer is difficult to predict on the basis of established
clinical and pathological prognostic criteria. Given the genetic complexity of breast carcinomas, it is not surprising that correlations with individual genetic abnormalities have also been disappointing. The use of gene expression profiles could result in more accurate and objective prognostication.
Results: To this end, we used real-time quantitative RT-PCR assays to quantify the mRNA
expression of a large panel (n = 47) of genes previously identified as candidate prognostic molecular markers in a series of 100 ERα-positive breast tumor samples from patients with known long-term follow-up. We identified a three-gene expression signature (BRCA2, DNMT3B and CCNE1) as an independent prognostic marker (P = 0.007 by univariate analysis; P = 0.006 by multivariate analysis). This "poor prognosis" signature was then tested on an independent panel of ERα-positive breast tumors from a well-defined cohort of 104 postmenopausal breast cancer patients treated with primary surgery followed by adjuvant tamoxifen alone: although this "poor prognosis" signature was associated with shorter relapse-free survival in univariate analysis (P = 0.029), it did not persist as an independent prognostic factor in multivariate analysis (P = 0.27).
Conclusion: Our results confirm the value of gene expression signatures in predicting the
outcome of breast cancer.
Background
Breast carcinoma is the most common female cancer and is showing an alarming year-on-year increase. Most patients do not die as a result of the primary tumor but from metastatic invasion. The mean 5-year relapse-free survival rate is about 60% overall, but differs significantly
between patients with forms that rapidly metastasize and those with less aggressive forms.
Current clinical, pathological and biological parameters,
i.e. age, menopausal status, lymph-node status, macro-scopic tumor size, histological grade and estrogen recep-tor status, fail to accurately predict clinical behavior. Published: 20 December 2004
Molecular Cancer 2004, 3:37 doi:10.1186/1476-4598-3-37
Received: 17 June 2004 Accepted: 20 December 2004 This article is available from: http://www.molecular-cancer.com/content/3/1/37
© 2004 Bièche et al; licensee BioMed Central Ltd.
This is an Open Access article distributed under the terms of the Creative Commons Attribution License (http://creativecommons.org/licenses/by/2.0), which permits unrestricted use, distribution, and reproduction in any medium, provided the original work is properly cited.
Breast cancer initiation and progression is a process involving multiple molecular alterations, many of which are reflected by changes in gene expression in malignant cells. Many clinical studies have attempted to identify cor-relations between altered expression of individual genes and breast cancer outcome, but often with contradictory results. Examples of such genes include ERBB2, CCDN1,
MYC, UPA and PAI1 [1-3]. It is thus likely that these genes have limited predictive power when considered in isola-tion, but that their clinical relevance may be increased when several genes are considered together.
The recent development of effective tools for monitoring gene expression on a large scale is providing new insights into the involvement of gene networks and regulatory pathways in various tumor processes [4]. It has also led to the discovery of new diagnostic and prognostic indicators, and to the identification of new molecular targets for drug development [5]. These tools include cDNA microarrays, which can be used to explore the expression of thousands of genes at a time, and real-time RT-PCR assays for more accurate and quantitative studies of the expression of a smaller number of selected candidate genes.
In this study, we used real-time quantitative RT-PCR assays to quantify the mRNA expression of 47 candidate prognostic molecular markers in a series of 100 ER α-pos-itive breast tumor samples. We identified a three-gene expression signature (BRCA2, DNMT3B and CCNE1) associated with poor clinical outcome. We then tested this "poor prognosis" signature on an independent panel of ERα-positive breast tumor samples from a well-defined cohort of 104 postmenopausal breast cancer patients treated with primary surgery followed by adjuvant tamoxifen alone with known long-term follow-up.
Materials and Methods
Patients and samples
We analyzed samples from two series of women with pri-mary unilateral ERα-positive breast carcinoma. ERα-posi-tive status was determined at both the protein level by the Dextran-coated charcoal method until 1988 and enzy-matic immuno-assay thereafter, and at the mRNA level by real-time quantitative RT-PCR assay [6].
The first series consisted of 100 women whose breast tumors were excised at Centre René Huguenin from 1977 to 1987. The patients (mean age 58.1 years, range 34–91) were pre- or post-menopausal (37 and 63 patients, respec-tively). Sixty patients received adjuvant therapy, consist-ing of chemotherapy alone in 14 cases, hormone therapy alone in 15 cases, and both treatments in 31 cases. The standard prognostic factors are presented in Table 1. The median follow-up was 9.3 years (range 1.4–16.2 years). Thirty-seven patients relapsed within 10 years after
sur-gery. The first relapse events consisted of local and/or regional recurrences in 11 patients, metastases in 22 patients, and both events in four patients.
The second series consisted of 104 post-menopausal women whose breast tumors were excised at Centre René Huguenin from 1980 to 1994. The patients (mean age 70.9 years, range 54–86) all received post-operative adju-vant hormone therapy consisting of tamoxifen (20 mg daily for 3–5 years) and no other treatment. The standard prognostic factors are reported in Table 2. The median fol-low-up was 5.9 years (range 1.4–18.1 years). Thirty-one patients relapsed within 10 years after surgery. The first relapse events consisted of local and/or regional recur-rences in five patients, metastases in 24 patients, and both events in two patients.
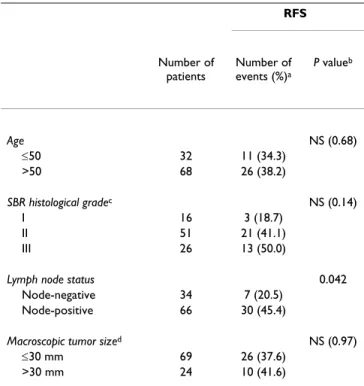
Complete clinical, histological and biological informa-tion was available for the two series of breast cancer patients; no radiotherapy or chemotherapy was given before surgery, and full follow-up took place at Centre René Huguenin. The histological type of the tumor and the number of positive axillary nodes were established at the time of surgery. The malignancy of infiltrating Table 1: Characteristics of the first series of 100 ERα-positive breast tumor patients, and relation to RFS
RFS Number of patients Number of events (%)a P valueb Age NS (0.68) ≤50 32 11 (34.3) >50 68 26 (38.2) SBR histological gradec NS (0.14) I 16 3 (18.7) II 51 21 (41.1) III 26 13 (50.0)
Lymph node status 0.042 Node-negative 34 7 (20.5)
Node-positive 66 30 (45.4)
Macroscopic tumor sized NS (0.97)
≤30 mm 69 26 (37.6)
>30 mm 24 10 (41.6)
a: First relapses (local and/or regional recurrences, and/or metastases). b: Log-rank test. NS, not significant.
c: Scarff Bloom Richardson classification. Information available for 93
patients.
Molecular Cancer 2004, 3:37 http://www.molecular-cancer.com/content/3/1/37
carcinomas was scored according to Scarff Bloom and Richardson's (SBR) histoprognostic system.
Both series of tumor samples were placed in liquid nitro-gen until total RNA extraction immediately following surgery.
Real-time RT-PCR
(1) Theoretical basis
Quantitative values are obtained from the cycle number (Ct value) at which the increase in fluorescent signal asso-ciated with an exponential growth of PCR products starts to be detected by the laser detector of the ABI Prism 7700 Sequence Detection System (Perkin-Elmer Applied Bio-systems, Foster City, CA) using the PE Biosystems analysis software according to the manufacturer's manuals. The precise amount of total RNA added to each reaction (based on optical density) and its quality (i.e. lack of extensive degradation) are both difficult to assess. We therefore also quantified transcripts of the gene TBP (Gen-bank accession NM_003194) encoding for the TATA box-binding protein (a component of the DNA-box-binding pro-tein complex TFIID) as an endogeneous RNA control, and normalized each sample on the basis of its TBP content.
Results, expressed as N-fold differences in target gene expression relative to the TBP gene, termed "Ntarget", were determined by the formula: Ntarget = 2∆Ct sample, where ∆Ct value of the sample was determined by sub-tracting the average Ct value of the target gene from the average Ct value of the TBP gene.
The Ntarget values of the samples were subsequently nor-malized such that the Ntarget value of the tumor sample which contained the smallest amount of target gene mRNA in each tumor series would equal a value of 1.
(2) Primers and probes
Primers and probes for TBP and the 47 target genes were chosen with the assistance of the computer programs Oligo 5.0 (National Biosciences, Plymouth, MN). We conducted searches in dbEST, htgs and nr databases to confirm the total gene specificity of the nucleotide sequences chosen for the primers and probes, and the absence of single nucleotide polymorphisms. In particu-lar, the primer pairs were selected to be unique when com-pared with the sequences of the closely related family member genes or of corresponding retropseudogenes. To avoid amplification of contaminating genomic DNA, one of the two primers or the probe was placed at the junction between two exons. Agarose gel electrophoresis allowed us to verify the specificity of PCR amplicons. The list of the 47 target genes tested in this study is indicated in Table 3.
(3) RNA extraction
Total RNA was extracted from frozen tumor samples by using the acid-phenol guanidinium method. The quality of the RNA samples was determined by electrophoresis through agarose gels and staining with ethidium bromide, and the 18S and 28S RNA bands were visualized under ultraviolet light.
(4) cDNA Synthesis
Reverse transcription of total RNA was done in a final
vol-ume of 20 µL containing 1X RT buffer (500 µM each
dNTP, 3 mM MgCl2, 75 mM KCl, 50 mM Tris-HCl pH 8.3), 20 units of RNasin RNase inhibitor (Promega, Mad-ison, WI), 10 mM DDT, 100 units of Superscript II RNase H- reverse transcriptase (Invitrogen, Cergy Pontoise, France), 3 µM random hexamers (Pharmacia, Uppsala, Sweden) and 1 µg of total RNA. The samples were incu-bated at 20°C for 10 min and 42°C for 30 min, and reverse transcriptase was inactivated by heating at 99°C for 5 min and cooling at 5°C for 5 min.
(5) PCR amplification
All PCR reactions were performed using a ABI Prism 7700 Sequence Detection System (Perkin-Elmer Applied Bio-systems). PCR was performed using either the TaqMan®
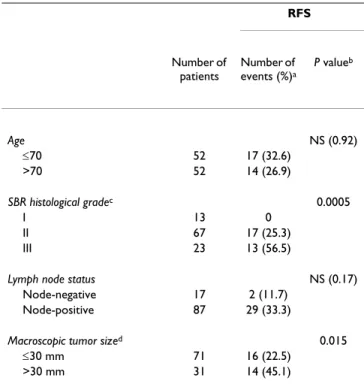
PCR Core Reagents kit or the SYBR® Green PCR Core Table 2: Characteristics of the second series of 104 ERα-positive
postmenopausal breast tumor patients, and relation to RFS
RFS Number of patients Number of events (%)a P valueb Age NS (0.92) ≤70 52 17 (32.6) >70 52 14 (26.9) SBR histological gradec 0.0005 I 13 0 II 67 17 (25.3) III 23 13 (56.5)
Lymph node status NS (0.17) Node-negative 17 2 (11.7)
Node-positive 87 29 (33.3)
Macroscopic tumor sized 0.015
≤30 mm 71 16 (22.5)
>30 mm 31 14 (45.1)
a: First relapses (local and/or regional recurrences, and/or metastases) b: Log-rank test. NS, not significant.
c: Scarff Bloom Richardson classification. Information available for 103
patients.
Reagents kit (Perkin-Elmer Applied Biosystems). The ther-mal cycling conditions comprised an initial denaturation step at 95°C for 10 min and 50 cycles at 95°C for 15 s and 65°C for 1 min.
Statistical Analysis
The distributions of the gene mRNA levels were character-ized by their median values and ranges. Relationships between mRNA levels of the different target genes and Table 3: List of the 47 target genes selected
Genesa Genbank accession number Chromosomal location Description
AR NM_000044 Xq11.2-q12 Androgen receptor
AREG NM_001657 4q13-q21 Amphiregulin
ARHC/RhoC NM_175744 1p13.1 Ras homolog gene family, member C BCL2 NM_000633 18q21.3 B-cell CLL/lymphoma 2
BRCA1 NM_007294 17q21 Breast cancer 1, early onset BRCA2 NM_000059 13q12.3 Breast cancer 2, early onset
CAV1 NM_001753 7q31.1 Caveolin 1
CCND1 NM_053056 11q13 Cyclin D1 CCNE1 NM_001238 19q12 Cyclin E1
CD44 NM_000610 11p13 CD44 antigen
CDH1 NM_004360 16q22.1 Cadherin 1 (E-cadherin)
CGA NM_000735 6q12-q21 Glycoprotein hormones, alpha polypeptide CGB NM_000737 19q13.32 Chorionic gonadotropin, beta polypeptide CP/Ceruloplasmin NM_000096 3q23-q25 Ceruloplasmin
CXCL12 NM_000609 10q11.1 Chemokine (C-X-C motif) ligand 12 CXCR4 NM_003467 2q21 Chemokine (C-X-C motif) receptor 4 DNMT3B NM_006892 20q11.2 DNA (cytosine-5-)-methyltransferase 3 beta EGFR/ERBB1 NM_005228 7p12 Epidermal growth factor receptor
ERBB2 NM_004448 17q21.1 ErbB2
ERBB3 NM_001982 12q13 ErbB3
ERBB4 NM_005235 2q33.3-q34 ErbB4
ESR1/ERα NM_000125 6q25.1 Estrogen receptor 1 (alpha) ESR2/ERβ NM_001437 14q Estrogen receptor 2 (beta) ETV4/PEA3/E1AF NM_001986 17q21 Ets variant gene 4 HAS2 NM-005328 8q24.12 Hyaluronan synthase 2
HMMR/RHAMM NM_012484 5q33.2-qter Hyaluronan-mediated mobility receptor KRT19 NM_002276 17q21.2 Keratin 19
MKI67 NM_002417 10q25-qter Antigen identified by monoclonal antibody Ki-67 MYC NM_002467 8q24.12-q24.13 c-myc oncogene
p14/ARF NM_058195 9p21 Alternative reading frame p14 (p14ARF)
p15/CDKN2B NM_004936 9p21 Cyclin-dependent kinase inhibitor 2B (p15 CDK inhibitor) p16/CDKN2A NM_000077 9p21 Cyclin-dependent kinase inhibitor 2A (p16 CDK inhibitor) PGR/PR NM_000926 11q22-q23 Progesterone receptor
PLAU/UPA NM_002658 10q24 Plasminogen activator, urokinase PTGS2/COX2 NM_000963 1q25.2-q25.3 Prostaglandin-endoperoxide synthase 2 PTTG1/Securin NM_004219 5q35.1 Pituitary tumor-transforming 1
RB1 NM_000321 13q14.2 Retinoblastoma 1
SERPINB2/PAI2 NM_002575 18q21.3 Plasminogen activator inhibitor type 2 SERPINB5/Maspin NM_002639 18q21.3 Maspin
SERPINE1/PAI1 NM_000602 7q21.3-q22 Plasminogen activator inhibitor type 1 SPP1/Osteopontin NM_000582 4q21-q25 Secreted phosphoprotein 1
SRC NM_005417 20q12-q13 c-src oncogene
TERT NM_003219 5p15.33 Telomerase reverse transcriptase TFF1/pS2 NM_003225 21q22.3 Trefoil factor 1
TIAM1 NM_003253 21q22.11 T-cell lymphoma invasion and metastasis 1 TOP2A NM_001067 17q21-q22 Topoisomerase (DNA) II alpha 170 kDa XLKD1/LYVE-1 NM_006691 11p15 Extracellular link domain containing 1
Molecular Cancer 2004, 3:37 http://www.molecular-cancer.com/content/3/1/37
comparison between the target gene mRNA levels and the clinical parameters were estimated using nonparametric tests: the Mann-Whitney U test (link between 1 qualitative
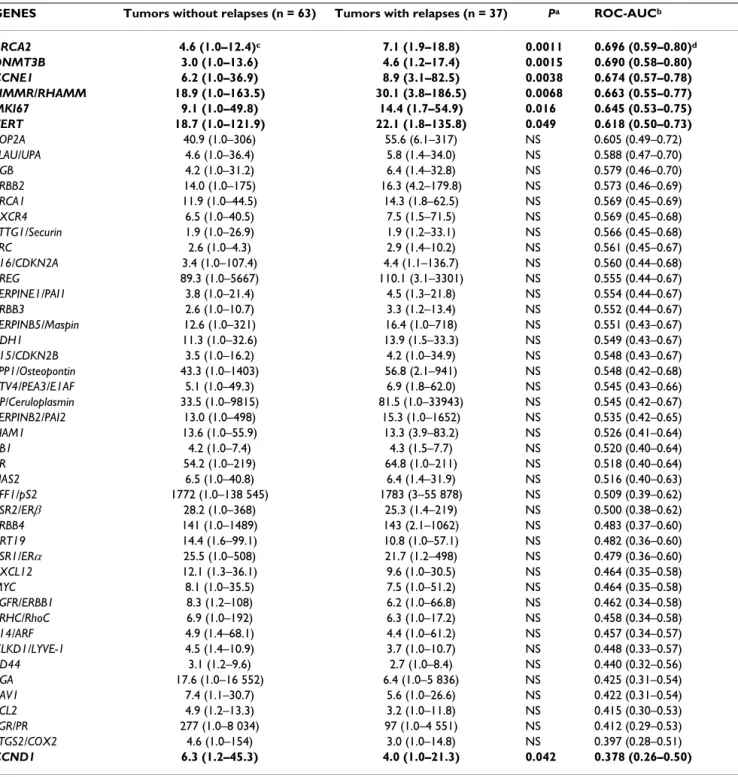
parameter and 1 quantitative parameter) and the Spear-man rank correlation test (link between 2 quantitative parameters). Differences between the two populations Table 4: Relationships between the prognostic (+/- relapses) and the mRNA levels of the 47 selected genes in 100 ERα-positive breast tumors
GENES Tumors without relapses (n = 63) Tumors with relapses (n = 37) Pa ROC-AUCb
BRCA2 4.6 (1.0–12.4)c 7.1 (1.9–18.8) 0.0011 0.696 (0.59–0.80)d DNMT3B 3.0 (1.0–13.6) 4.6 (1.2–17.4) 0.0015 0.690 (0.58–0.80) CCNE1 6.2 (1.0–36.9) 8.9 (3.1–82.5) 0.0038 0.674 (0.57–0.78) HMMR/RHAMM 18.9 (1.0–163.5) 30.1 (3.8–186.5) 0.0068 0.663 (0.55–0.77) MKI67 9.1 (1.0–49.8) 14.4 (1.7–54.9) 0.016 0.645 (0.53–0.75) TERT 18.7 (1.0–121.9) 22.1 (1.8–135.8) 0.049 0.618 (0.50–0.73) TOP2A 40.9 (1.0–306) 55.6 (6.1–317) NS 0.605 (0.49–0.72) PLAU/UPA 4.6 (1.0–36.4) 5.8 (1.4–34.0) NS 0.588 (0.47–0.70) CGB 4.2 (1.0–31.2) 6.4 (1.4–32.8) NS 0.579 (0.46–0.70) ERBB2 14.0 (1.0–175) 16.3 (4.2–179.8) NS 0.573 (0.46–0.69) BRCA1 11.9 (1.0–44.5) 14.3 (1.8–62.5) NS 0.569 (0.45–0.69) CXCR4 6.5 (1.0–40.5) 7.5 (1.5–71.5) NS 0.569 (0.45–0.68) PTTG1/Securin 1.9 (1.0–26.9) 1.9 (1.2–33.1) NS 0.566 (0.45–0.68) SRC 2.6 (1.0–4.3) 2.9 (1.4–10.2) NS 0.561 (0.45–0.67) p16/CDKN2A 3.4 (1.0–107.4) 4.4 (1.1–136.7) NS 0.560 (0.44–0.68) AREG 89.3 (1.0–5667) 110.1 (3.1–3301) NS 0.555 (0.44–0.67) SERPINE1/PAI1 3.8 (1.0–21.4) 4.5 (1.3–21.8) NS 0.554 (0.44–0.67) ERBB3 2.6 (1.0–10.7) 3.3 (1.2–13.4) NS 0.552 (0.44–0.67) SERPINB5/Maspin 12.6 (1.0–321) 16.4 (1.0–718) NS 0.551 (0.43–0.67) CDH1 11.3 (1.0–32.6) 13.9 (1.5–33.3) NS 0.549 (0.43–0.67) p15/CDKN2B 3.5 (1.0–16.2) 4.2 (1.0–34.9) NS 0.548 (0.43–0.67) SPP1/Osteopontin 43.3 (1.0–1403) 56.8 (2.1–941) NS 0.548 (0.42–0.68) ETV4/PEA3/E1AF 5.1 (1.0–49.3) 6.9 (1.8–62.0) NS 0.545 (0.43–0.66) CP/Ceruloplasmin 33.5 (1.0–9815) 81.5 (1.0–33943) NS 0.545 (0.42–0.67) SERPINB2/PAI2 13.0 (1.0–498) 15.3 (1.0–1652) NS 0.535 (0.42–0.65) TIAM1 13.6 (1.0–55.9) 13.3 (3.9–83.2) NS 0.526 (0.41–0.64) RB1 4.2 (1.0–7.4) 4.3 (1.5–7.7) NS 0.520 (0.40–0.64) AR 54.2 (1.0–219) 64.8 (1.0–211) NS 0.518 (0.40–0.64) HAS2 6.5 (1.0–40.8) 6.4 (1.4–31.9) NS 0.516 (0.40–0.63) TFF1/pS2 1772 (1.0–138 545) 1783 (3–55 878) NS 0.509 (0.39–0.62) ESR2/ERβ 28.2 (1.0–368) 25.3 (1.4–219) NS 0.500 (0.38–0.62) ERBB4 141 (1.0–1489) 143 (2.1–1062) NS 0.483 (0.37–0.60) KRT19 14.4 (1.6–99.1) 10.8 (1.0–57.1) NS 0.482 (0.36–0.60) ESR1/ERα 25.5 (1.0–508) 21.7 (1.2–498) NS 0.479 (0.36–0.60) CXCL12 12.1 (1.3–36.1) 9.6 (1.0–30.5) NS 0.464 (0.35–0.58) MYC 8.1 (1.0–35.5) 7.5 (1.0–51.2) NS 0.464 (0.35–0.58) EGFR/ERBB1 8.3 (1.2–108) 6.2 (1.0–66.8) NS 0.462 (0.34–0.58) ARHC/RhoC 6.9 (1.0–192) 6.3 (1.0–17.2) NS 0.458 (0.34–0.58) p14/ARF 4.9 (1.4–68.1) 4.4 (1.0–61.2) NS 0.457 (0.34–0.57) XLKD1/LYVE-1 4.5 (1.4–10.9) 3.7 (1.0–10.7) NS 0.448 (0.33–0.57) CD44 3.1 (1.2–9.6) 2.7 (1.0–8.4) NS 0.440 (0.32–0.56) CGA 17.6 (1.0–16 552) 6.4 (1.0–5 836) NS 0.425 (0.31–0.54) CAV1 7.4 (1.1–30.7) 5.6 (1.0–26.6) NS 0.422 (0.31–0.54) BCL2 4.9 (1.2–13.3) 3.2 (1.0–11.8) NS 0.415 (0.30–0.53) PGR/PR 277 (1.0–8 034) 97 (1.0–4 551) NS 0.412 (0.29–0.53) PTGS2/COX2 4.6 (1.0–154) 3.0 (1.0–14.8) NS 0.397 (0.28–0.51) CCND1 6.3 (1.2–45.3) 4.0 (1.0–21.3) 0.042 0.378 (0.26–0.50)
a:P value, Mann-Whitney U test ; NS, not significant
b:ROC (Receiver Operating Characteristics) – AUC (Area Under Curve) analysis c:Median (range) of gene mRNA levels
were judged significant at confidence levels greater than 95% (p < 0.05).
To visualize the efficacy of a molecular marker to discrim-inate two populations (in the absence of an arbitrary cut-off value), we summarized the data in a ROC (receiver operating characteristic) curve [7]. This curve plots the sensibility (true positives) on the Y axis against 1 – the specificity (false positives) on the X axis, considering each value as a possible cutoff value. The AUC (area under curves) was calculated as a single measure for the discrim-inate efficacy of a molecular marker. When a molecular marker has no discriminative value, the ROC curve will lie close to the diagonal and the AUC is close to 0.5. When a test has strong discriminative value, the ROC curve will move up to the upper left-hand corner (or to the lower right-hand corner) and the AUC will be close to 1.0 (or 0). Hierarchical clustering was performed using the GenA-NOVA software [8].
Relapse-free survival (RFS) was determined as the interval between diagnosis and detection of the first relapse (local and/or regional recurrences, and/or metastases).
Survival distributions were estimated by the Kaplan-Meier method [9], and the significance of differences between survival rates was ascertained using the log-rank test [10]. Cox's proportional hazards regression model [11] was used to assess prognostic significance.
Results
mRNA expression of 47 genes in 100 ERα-positive breast
tumors
The results for the 47 genes are summarized in table 4, with medians and ranges of mRNA levels in patients who relapsed (n = 37) and those who did not (n = 63). Seven genes showed significantly different expression according to relapse status (P < 0.05), namely BRCA2,
DNMT3B, CCNE1, HMMR/RHAMM, MKI67, TERT and
CCND1. The prognostic performance of these 7 genes was also assessed using ROC-AUC analysis. BRCA2 emerged as the most discriminatory marker of relapse status (ROC-AUC, 0.696). The mRNA expression of this gene, as well as DNMT3B, CCNE1, HMMR/RHAMM, MKI67 and TERT, was higher in patients who relapsed than in patients who did not relapse, while only CCND1 mRNA expression was lower in patients who relapsed.
On hierarchically clustering the tumor samples according to the expression of the three most discriminatory genes
i.e. the genes with the highest ROC-AUC values (BRCA2,
DNMT3B and CCNE1, ROC-AUC: 0.696, 0.690 and 0.674, respectively), the patient population fell into two
subgroups (65 and 35 subjects, respectively) with signifi-cantly different relapse-free survival curves (log-rank test, P = 0.007; Figure 1A) (5-year RFS rate 66.9% ± 8.1 versus 83.9% ± 4.6; 10-year RFS rate 41.0% ± 8.7 versus 67.0% ± 6.6).
The prognostic value of a two-gene expression signature based on only BRCA2 and DNMT3B was lower than that of the three-gene expression signature. The addition of
HMMR/RHAMM and/or MKI67 to the three-gene signa-ture provided no additional prognostic value.
Using a Cox proportional hazards model, we also assessed the prognostic value, for RFS, of parameters that were sig-nificant or near-sigsig-nificant (P < 0.2) in univariate analysis,
i.e. SBR grade, lymph-node status (Table 1) and the three-gene expression signature (Figure 1A). Only the prognos-Relationship between RFS and the three-gene expression sig-nature in the initial series of 100 ERα-positive breast tumor samples (A) and in an independent series of 104 ERα-positive postmenopausal breast tumor samples (B)
Figure 1
Relationship between RFS and the three-gene expression sig-nature in the initial series of 100 ERα-positive breast tumor samples (A) and in an independent series of 104 ERα-positive postmenopausal breast tumor samples (B).
25 50 75 100 0 0 30 60 90 120
P=0.007
(n=65) Relapse-f ree su rvival (%)A
25 50 75 100 0 0 30 60 90 120P=0.029
Relapse-f ree su rvival (%)B
(n=35) Time (months) (n=74) (n=30) Figure 1Molecular Cancer 2004, 3:37 http://www.molecular-cancer.com/content/3/1/37
tic significance of the three-gene expression signature per-sisted [P = 0.006; regression coefficient = 0.86; relative risk (95% confidence interval) = 2.37 (1.27–4.43)]. The prog-nostic significance of these three parameters for RFS, cal-culated in terms of the relative risk, did not change after adjustment for age and macroscopic tumor size (data not shown).
Validation of the three-gene expression signature in an
independent series of 104 ERα-positive postmenopausal
breast tumor samples
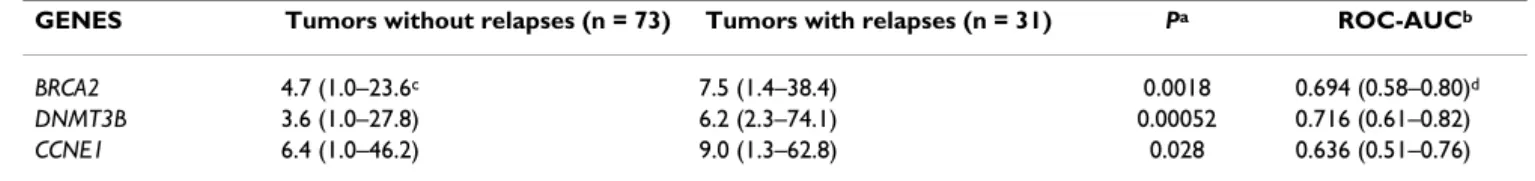
The results for each of the three genes are summarized in table 5, with medians and ranges of mRNA levels in the 31 patients who relapsed and the 73 patients who did not relapse, as well as ROC-AUC values. As in the initial tumor series, BRCA2, DNMT3B and CCNE1 mRNA levels were significantly higher in patients who relapsed than in those who did not relapse.
On hierarchical clustering of the samples, the three-gene expression signature dichotomized the 104 patients into two subgroups (n = 30 and n = 74, respectively) of similar sizes to those of the initial patient population (n = 35 and n = 65, respectively).
The "poor prognosis" signature was again associated with shorter relapse-free survival in this independent tumor series (log-rank test, P = 0.029; Figure 1B) (5-year RFS 59.2% ± 9.1 versus 80.7% ± 4.8; 10-year RFS 51.2% ± 9.50 versus 70.4% ± 6.5).
Multivariate analysis based on a Cox proportional hazards model showed that, among the parameters that were sig-nificant or near-sigsig-nificant (P < 0.2) in univariate analysis,
i.e. SBR grade, lymph-node status, macroscopic tumor size (Table 2) and the three-gene expression signature (Figure 1B), only SBR grade was an independent predictor of RFS (P = 0.00023); the three-gene expression signature only showed a trend towards significance (P = 0.27).
Discussion
We used real-time quantitative RT-PCR assays to quantify the mRNA expression of 47 genes previously identified as candidate prognostic molecular markers in 100 ER α-pos-itive breast tumor samples. We identified a three-gene expression signature (BRCA2, DNMT3B and CCNE1) with independent prognostic significance in breast cancer (P = 0.007 by univariate analysis; P = 0.006 by multivariate analysis). This "poor prognosis" signature was then tested on an independent set of 104 ERα-positive breast tumors from a well-defined cohort of postmenopausal breast can-cer patients treated with primary surgery followed by adjuvant tamoxifen alone. It was found to be significant in univariate analysis (P = 0.029), but not in multivariate analysis (P = 0.27). We have previously published individ-ual data for 18 of these 47 genes, namely ERBB1-4 [12];
MYC [13]; TERT [14]; CCND1 [15]; CGB, CGA, ERα, ERβ,
PR, PS2 [16]; AR [17]; DNMT3B [18], PAI1, PAI2 and UPA [19], obtained using the same real-time RT-PCR method but in a heterogeneous series of 130 ERα-positive and ERα-negative breast tumors.
Large-scale real-time quantitative RT-PCR is a promising complement and/or alternative to cDNA microarrays for molecular tumor profiling. CDNA microarrays have been used to identify gene expression profiles associated with poor outcome in breast cancer [20-26], but discrepancies have been reported. For example, only 2 of 456 genes identified by Sorlie et al. [21] was among the 70 genes identified by van de Vijver et al. [24].
These discrepancies may be due to the clinical, histologi-cal and ethnic heterogeneity of breast cancer, but also to the fact that breast tumors consist of many different cell types – not just tumoral epithelial cells, but also addi-tional epithelial cell types, stromal cells, endothelial cells, adipose cells, and infiltrating lymphocytes. Real-time RT-PCR requires smaller starting amounts of total RNA (about 1–2 ng per target gene) than do cDNA microarrays, Table 5: Relationships between the prognostic (+/- relapses) and the mRNA levels of BRCA2, DNMT3B and CCNE1 in 104 ERα-positive postmenopausal breast tumors
GENES Tumors without relapses (n = 73) Tumors with relapses (n = 31) Pa ROC-AUCb
BRCA2 4.7 (1.0–23.6c 7.5 (1.4–38.4) 0.0018 0.694 (0.58–0.80)d
DNMT3B 3.6 (1.0–27.8) 6.2 (2.3–74.1) 0.00052 0.716 (0.61–0.82) CCNE1 6.4 (1.0–46.2) 9.0 (1.3–62.8) 0.028 0.636 (0.51–0.76)
a:P value, Mann-Whitney U test.
b:ROC (Receiver Operating Characteristics) – AUC (Area Under Curve) analysis c:Median (range) of gene mRNA levels
making it more suitable for analyzing small tumor ples, cytopuncture specimens and microdissected sam-ples. Real-time RT-PCR also has a linear dynamic range of at least four orders of magnitude, meaning that samples do not need to contain equal starting amounts of RNA. Real-time RT-PCR is also more suitable than cDNA micro-arrays for analyzing weak variations in gene expression and weakly expressed genes (e.g. TERT as in the present study), and for distinguishing among closely related family member genes or alternatively spliced specific tran-scripts (e.g. the gene cluster p14/ARF, p16/CDKN2A and
p15/CDKN2B as in the present study). Finally, real-time quantitative RT-PCR assay is a reference in terms of its per-formance, accuracy, sensitivity and throughput for nucleic acid quantification, and is more appropriate for routine use in clinical laboratories, being simple, rapid and yield-ing good inter-laboratory agreement and statistical confi-dence values.
In this study, we chose to include well known genes involved in breast carcinogenesis reported in the literature and representing a broad range of cellular functions, such as cell cycle control, cell-cell interactions, signal transduc-tion pathways, apoptosis and angiogenesis (Table 3). Many important genes were not studied, but our results nevertheless demonstrate the usefulness of real time RT-PCR by identifying a potentially useful gene expression signature with prognostic significance.
The comparison of median target gene mRNA levels between patients who did and did not relapse provided two interesting results: (a) ERBB2 mRNA levels were very similar between the two subgroups, with ROC-AUC values close to 0.5 (ROC-AUC, 0.573), confirming that the ERBB2 mRNA expression level is not a major prognos-tic factor in breast cancer; (b) ESR1/ERα mRNA levels were not different between the two subgroups (ROC-AUC, 0.530), suggesting that the ESR1/ERα mRNA expres-sion level in ERα-positive tumors is not predictive of outcome.
The three-gene expression signature predictive of subse-quent relapse status comprised genes involved in cell cycle control (CCNE1), DNA methylation (DNMT3B) and DNA damage repair (BRCA2). This gene expression signa-ture is an interesting candidate for routine clinical use, especially as the three genes encode well-characterized proteins for which specific antibodies are already com-mercially available. Furthermore, the three protein prod-ucts are amenable to pharmacological control.
CCNE1 codes for cyclin E, a protein involved in regulating the early G1 to late G1 phase "restriction point traversal", an irreversible commitment to undergo one cell division [27]. We found that high CCNE1 mRNA levels were
associated with poor outcome, confirming published data suggesting that cyclin E upregulation may be a major prognostic marker in breast cancer [28-31].
BRCA2 codes for a ubiquitously expressed tumor suppres-sor protein involved in processes fundamental to all cells, including DNA repair, DNA recombination and cell cycle checkpoint control [32]. We found that high BRCA2 mRNA levels were associated with poor outcome and cor-related positively and strongly with cell proliferation. By hierarchical clustering analysis of the 47 genes, we identi-fied BRCA2 as the leading gene in a cluster of proliferation genes also including TERT, BRCA1, HMMR/RHAMM and
MKI67 (data not shown). We also observed a strong pos-itive link between BRCA2 and MKI67, which encodes the proliferation-related Ki-67 antigen (Spearman rank corre-lation test: r=+0.670, P < 10-7). The observed strong
asso-ciations between BRCA2, HMMR/RHAMM and MKI67 mRNA expression explain why four- and five-gene expres-sion signatures, comprising HMMR/RHAMM alone or together with MKI67, showed no additional prognostic value relative to the three-gene signature.
Our results for BRCA2 expression ex vivo are in keeping with reports from several authors [33,34] showing that
BRCA2 mRNA expression is upregulated in rapidly prolif-erating cells in vitro. Our results are also in agreement with those of Egawa et al. [35] showing that high BRCA2 expression carries a poor prognosis in breast cancer. This link between BRCA2 overexpression and poor outcome should be taken into account when evaluating future
BRCA2-based therapeutic approaches to breast cancer. Finally, DNMT3B, the third gene in our expression signa-ture, codes for one of the three functional DNA methyl-transferases (DNMT1, DNMT3A and DNMT3B) that catalyze the transfer of methyl groups to the 5-position of cytosine (DNA methylation). We previously showed that, among the three DNA methyltransferases (DNMT1,
DNMT3A and DNMT3B), only DNMT3B overexpression is associated with poor outcome in breast cancer [18].
DNMT3B (like DNMT3A) is known to be a de novo meth-ylator of CpG sites. Abnormal DNA methylation is thought to be a major early event in the development of tumors characterized by widespread genome hypomethyl-ation leading to chromosome instability and localized DNA hypermethylation; the latter may be important in tumorigenesis by silencing tumor suppressor genes [36].
Conclusions
In conclusion, by studying the expression of 47 genes pre-viously identified as candidate prognostic markers in breast cancer, we identified a three-gene expression signa-ture (BRCA2, DNMT3B and CCNE1) with prognostic
sig-Molecular Cancer 2004, 3:37 http://www.molecular-cancer.com/content/3/1/37
nificance. The practical value of this signature remains to be validated in large prospective randomized studies.
Abbreviations
ERα, estrogen receptor alpha; RT-PCR, reverse tran-scriptase-polymerase chain reaction.
Authors' contributions
Real-time RT-PCR have been carried out by ST and IG. IB and RL interpreted the result, performed bioinformatics and statistical analyses.
Acknowledgements
We thank the staff of Centre René Huguenin for assistance in specimen col-lection and patient care. We also thank Dr. Kamel Hacène (Département de Stastistiques Médicales, Centre René Huguenin, 92211 St-Cloud, France) for helpful contributions.
This work was supported by the Comité des Hauts-de-Seine de la Ligue
Nationale Contre le Cancer.
References
1. Lerebours F, Lidereau R: Molecular alterations in sporadic
breast cancer. Crit Rev Oncol Hematol 2002, 44:121-141.
2. Esteva FJ, Hortobagyi GN: Prognostic molecular markers in
early breast cancer. Breast Cancer Res 2004, 6:109-118.
3. Janicke F, Prechtl A, Thomssen C, Harbeck N, Meisner C, Untch M, Sweep CG, Selbmann HK, Graeff H, Schmitt M, German N0 Study Group: Randomized adjuvant chemotherapy trial in high-risk,
lymph node-negative breast cancer patients identified by urokinase-type plasminogen activator and plasminogen acti-vator inhibitor type 1. J Natl Cancer Inst 2001, 93:913-920.
4. DeRisi J, Penland L, Brown PO, Bittner ML, Meltzer PS, Ray M, Chen Y, Su YA, Trent JM: Use of a cDNA microarray to analyse gene
expression patterns in human cancer. Nat Genet 1996, 14:457-460.
5. Guo QM: DNA microarray and cancer. Curr Opin Oncol 2003,
15:36-43.
6. Bieche I, Parfait B, Laurendeau I, Girault I, Vidaud M, Lidereau R:
Quantification of estrogen receptor alpha and beta expres-sion in sporadic breast cancer. Oncogene 2001, 20:8109-8115.
7. Hanley JA, McNeil BJ: The meaning and use of the area under a
receiver operating characteristic (ROC) curve. Radiology 1982, 143:29-36.
8. Didier G, Brezellec P, Remy E, Henaut A: GeneANOVA – gene
expression analysis of variance. Bioinformatics 2002, 18:490-491.
9. Kaplan EL, Meier P: Nonparametric estimation of incomplete
observations. J Am Stat Assoc 1958, 53:457-481.
10. Peto R, Pike MC, Armitage P, Breslow NE, Cox DR, Howard SV, Man-tel N, McPherson K, Peto J, Smith PG: Design and analysis of
ran-domized clinical trials requiring prolonged observation of each patient. II. analysis and examples. Br J Cancer 1977, 35:1-39.
11. Cox DR: Regression models and life tables. J R Stat Soc (B) 1972,
34:187-220.
12. Bieche I, Onody P, Tozlu S, Driouch K, Vidaud M, Lidereau R:
Prog-nostic value of ERBB family mRNA expression in breast carcinomas. Int J Cancer 2003, 106:758-765.
13. Bieche I, Laurendeau I, Tozlu S, Olivi M, Vidaud D, Lidereau R, Vidaud M: Quantitation of MYC gene expression in sporadic breast
tumors with a real-time reverse transcription-PCR assay. Cancer Res 1999, 59:2759-2765.
14. Bieche I, Nogues C, Paradis V, Olivi M, Bedossa P, Lidereau R, Vidaud M: Quantitation of hTERT gene expression in sporadic
breast tumors with a real-time reverse transcription-polymerase chain reaction assay. Clin Cancer Res 2000, 6:452-459.
15. Bieche I, Olivi M, Nogues C, Vidaud M, Lidereau R: Prognostic
value of CCND1 gene status in sporadic breast tumours, as
determined by real-time quantitative PCR assays. Br J Cancer
2002, 86:580-586.
16. Bieche I, Parfait B, Le DV, Olivi M, Rio MC, Lidereau R, Vidaud M:
Identification of CGA as a novel estrogen receptor-respon-sive gene in breast cancer: an outstanding candidate marker to predict the response to endocrine therapy. Cancer Res 2001, 61:1652-1658.
17. Bieche I, Parfait B, Tozlu S, Lidereau R, Vidaud M: Quantitation of
androgen receptor gene expression in sporadic breast tumors by real-time RT-PCR: evidence that MYC is an AR-regulated gene. Carcinogenesis 2001, 22:1521-1526.
18. Girault I, Tozlu S, Lidereau R, Bieche I: Expression analysis of
DNA methyltransferases 1, 3A, and 3B in sporadic breast carcinomas. Clin Cancer Res 2003, 9:4415-4422.
19. Spyratos F, Bouchet C, Tozlu S, Labroquere M, Vignaud S, Becette V, Lidereau R, Bieche I: Prognostic value of uPA, PAI-1 and PAI-2
mRNA expression in primary breast cancer. Anticancer Res
2002, 22:2997-3003.
20. Zajchowski DA, Bartholdi MF, Gong Y, Webster L, Liu HL, Munishkin A, Beauheim C, Harvey S, Ethier SP, Johnson PH: Identification of
gene expression profiles that predict the aggressive behavior of breast cancer cells. Cancer Res 2001, 61:5168-5178.
21. Sorlie T, Perou CM, Tibshirani R, Aas T, Geisler S, Johnsen H, Hastie T, Eisen MB, van de Rijn M, Jeffrey SS, Thorsen T, Quist H, Matese JC, Brown PO, Botstein D, Eystein Lonning P, Borresen-Dale AL: Gene
expression patterns of breast carcinomas distinguish tumor subclasses with clinical implications. Proc Natl Acad Sci U S A
2001, 98:10869-10874.
22. West M, Blanchette C, Dressman H, Huang E, Ishida S, Spang R, Zuzan H, Olson JA Jr, Marks JR, Nevins JR: Predicting the clinical status
of human breast cancer by using gene expression profiles. Proc Natl Acad Sci U S A 2001, 98:11462-11467.
23. Bertucci F, Nasser V, Granjeaud S, Eisinger F, Adelaide J, Tagett R, Loriod B, Giaconia A, Benziane A, Devilard E, Jacquemier J, Viens P, Nguyen C, Birnbaum D, Houlgatte R: Gene expression profiles of
poor-prognosis primary breast cancer correlate with survival. Hum Mol Genet 2002, 11:863-872.
24. van de Vijver MJ, He YD, van't Veer LJ, Dai H, Hart AA, Voskuil DW, Schreiber GJ, Peterse JL, Roberts C, Marton MJ, Parrish M, Atsma D, Witteveen A, Glas A, Delahaye L, van der Velde T, Bartelink H, Rodenhuis S, Rutgers ET, Friend SH, Bernards R: A
gene-expres-sion signature as a predictor of survival in breast cancer. N Engl J Med 2002, 347:1999-2009.
25. Huang E, Cheng SH, Dressman H, Pittman J, Tsou MH, Horng CF, Bild A, Iversen ES, Liao M, Chen CM, West M, Nevins JR, Huang AT:
Gene expression predictors of breast cancer outcomes. Lan-cet 2003, 361:1590-1596.
26. Jenssen TK, Kuo WP, Stokke T, Hovig E: Associations between
gene expressions in breast cancer and patient survival. Hum Genet 2002, 111:411-420.
27. Ho A, Dowdy SF: Regulation of G(1) cell-cycle progression by
oncogenes and tumor suppressor genes. Curr Opin Genet Dev
2002, 12:47-52.
28. Donnellan R, Kleinschmidt I, Chetty R: Cyclin E
immunoexpres-sion in breast ductal carcinoma: pathologic correlations and prognostic implications. Hum Pathol 2001, 32:89-94.
29. Loden M, Stighall M, Nielsen NH, Roos G, Emdin SO, Ostlund H, Landberg G: The cyclin D1 high and cyclin E high subgroups of
breast cancer: separate pathways in tumorogenesis based on pattern of genetic aberrations and inactivation of the pRb node. Oncogene 2002, 21:4680-4690.
30. Keyomarsi K, Tucker SL, Buchholz TA, Callister M, Ding Y, Horto-bagyi GN, Bedrosian I, Knickerbocker C, Toyofuku W, Lowe M, Her-liczek TW, Bacus SS: Cyclin E and survival in patients with
breast cancer. N Engl J Med 2002, 347:1566-1575.
31. Span PN, Tjan-Heijnen VC, Manders P, Beex LV, Sweep CG:
Cyclin-E is a strong predictor of endocrine therapy failure in human breast cancer. Oncogene 2003, 22:4898-4904.
32. Venkitaraman AR: Cancer susceptibility and the functions of
BRCA1 and BRCA2. Cell 2002, 108:171-182.
33. Rajan JV, Wang M, Marquis ST, Chodosh LA: Brca2 is coordinately
regulated with Brca1 during proliferation and differentiation in mammary epithelial cells. Proc Natl Acad Sci U S A 1996, 93:13078-13083.
Publish with BioMed Central and every scientist can read your work free of charge
"BioMed Central will be the most significant development for disseminating the results of biomedical researc h in our lifetime."
Sir Paul Nurse, Cancer Research UK Your research papers will be:
available free of charge to the entire biomedical community peer reviewed and published immediately upon acceptance cited in PubMed and archived on PubMed Central yours — you keep the copyright
Submit your manuscript here:
http://www.biomedcentral.com/info/publishing_adv.asp
BioMedcentral 34. Vaughn JP, Cirisano FD, Huper G, Berchuck A, Futreal PA, Marks JR,
Iglehart JD: Cell cycle control of BRCA2. Cancer Res 1996,
56:4590-4594.
35. Egawa C, Miyoshi Y, Taguchi T, Tamaki Y, Noguchi S: High BRCA2
mRNA expression predicts poor prognosis in breast cancer patients. Int J Cancer 2002, 98:879-882.
36. Jones PA, Baylin SB: The fundamental role of epigenetic events