HAL Id: hal-02350675
https://hal.archives-ouvertes.fr/hal-02350675
Submitted on 9 Dec 2019HAL is a multi-disciplinary open access archive for the deposit and dissemination of sci-entific research documents, whether they are pub-lished or not. The documents may come from teaching and research institutions in France or abroad, or from public or private research centers.
L’archive ouverte pluridisciplinaire HAL, est destinée au dépôt et à la diffusion de documents scientifiques de niveau recherche, publiés ou non, émanant des établissements d’enseignement et de recherche français ou étrangers, des laboratoires publics ou privés.
of Ambae (Aoba) volcano: a petrological investigation
Yves Moussallam, Estelle Rose-Koga, Kenneth Koga, Etienne Médard,
Philipson Bani, Jean-Luc Devidal, Dan Tari
To cite this version:
Yves Moussallam, Estelle Rose-Koga, Kenneth Koga, Etienne Médard, Philipson Bani, et al.. Fast as-cent rate during the 2017–2018 Plinian eruption of Ambae (Aoba) volcano: a petrological investigation. Contributions to Mineralogy and Petrology, Springer Verlag, 2019, 174 (11), pp.90. �10.1007/s00410-019-1625-z�. �hal-02350675�
Fast ascent rate during the 2017-2018 Plinian eruption of
1
Ambae (Aoba) volcano; a petrological investigation.
2 3
Yves Moussallam1,2*, Estelle F. Rose-Koga1*, Kenneth T. Koga1*, Etienne Médard1*,
4
Philipson Bani1, Jean-Luc Devidal1, Dan Tari3
5 6
1 Université Clermont Auvergne, CNRS, IRD, OPGC, Laboratoire Magmas et Volcans, F-63000 Clermont-7
Ferrand, France
8
2 Lamont-Doherty Earth Observatory, Columbia University, New York, USA
9
3 Vanuatu Meteorology and Geohazards Department (VMGD), Vanuatu
10
* These authors have contributed equally to this work 11
12
Corresponding author: Yves Moussallam; yves.moussallam@ird.fr 13
14
Keywords: volatile; melt inclusion; magma ascent; basaltic eruption; geo-speedometer
15 16
ABSTRACT
17
In September 2017, after more than a hundred years of quiescence, Ambae (Aoba), Vanuatu’s 18
largest volcano, entered a new phase of eruptive activity, triggering the evacuation of the 19
island’s 11,000 inhabitants resulting in the largest volcanic disaster in the country’s history. 20
Three subsequent eruptive phases in November 2017, March 2018 and July 2018 expelled 21
some of the largest tropospheric and stratospheric SO2 clouds observed in the last decade.
22
Here, we investigate the mechanisms and dynamics of this eruption. We use major elements, 23
trace elements, and volatiles in olivine and clinopyroxene hosted melt inclusions, 24
embayments, crystals and matrix glasses together with clinopyroxene geobarometry and 25
olivine, plagioclase and clinopyroxene geothermometry to reconstruct the physical and 26
chemical evolution of the magma as it ascends to the surface. Volatile elements in melt 27
inclusions and geobarometry data suggest that the magma originated from depth of ~ 14 km 28
before residing at shallow (~ 0.5 to 3 km) levels. Magma ascent to the surface was likely 29
facilitated by shallow phreatic eruptions that opened a pathway for magma to ascend. 30
Succeeding eruptive phases are characterised by increasingly primitive compositions with 31
evidence of small amounts of mixing having taken place. Mg-Fe exchange diffusion 32
modelling yields olivine residence times in the magma chamber ranging from a few days to a 33
year prior to eruption. Diffusion modelling of volatiles along embayments (melt channels) 34
from the first two phases of activity and microlite number density suggest rapid magma 35
ascent in the range of 15 to 270 km/h, 4 to 75 m/s (decompression rates of 0.1 to ~2 MPa/s) 36
corresponding to a short travel time between the top of the shallow reservoir and the surface 37
of less than two minutes. 38
39
INTRODUCTION
40
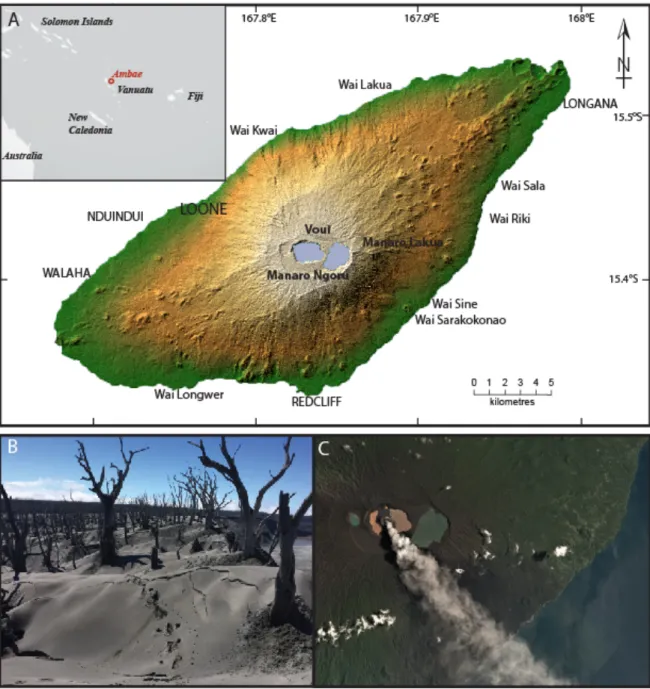
Ambae (also known as Aoba; 167°50′E, 15°23′S), is an island volcano located in the central 41
part of the Vanuatu archipelago. The volcano summit is located 3900 m above the sea floor 42
and 1496 m above sea level (Fig. 1). The emerged part of the edifice is 38 × 16 km and host a 43
pre- 2017 eruption population of about 11,000 inhabitants. Although part of a particularly 44
active volcanic arc, Ambae’s magmatic system has been very little studied compared to its 45
volcanic neighbour Ambrym (e.g., Firth et al. 2016; Allard et al. 2016; Sheehan and Barclay 46
2016). Yet the volcano’s magmatic activity together with the presence of large acid lakes at 47
the volcano’s summit, poses a particularly high risk to the island’s population due to the 48
potential for highly explosive phreato-magmatic eruptions and especially lahars. An 49
understanding of Ambae’s magmatic system is an essential first step towards a better 50
comprehension of its past and forecasting of its future activity. In this contribution, we aim to 51
draw such an understanding by studying deposits from the 2017-2018 eruption of Ambae, the 52
largest in recorded history. 53
54
Ambae is located in the central part of the Vanuatu arc, created by the north-eastward 55
subduction of the Australian plate underneath the Pacific plate (e.g., Daniel et al. 1989). This 56
central part of the arc is characterised by the collision of the D'Entrecasteaux ridge, a 100 km 57
wide Eocene–Oligocene island arc complex on the Australian subducting plate, with the fore-58
arc (e.g., Collot et al. 1985). Ambae is a shield volcano composed of a pile of primitive 59
basalts (Gorton 1977; Eggins 1993). At the summit is a 5 x 4 km caldera partially filled by 3 60
lakes one of which was considered among the world’s largest acid crater lakes (Voui lake) 61
(Bani et al. 2009a). According to local knowledge, the last significant eruption occurred 62
about 350 years ago, with lava flows reaching the sea near N’dui N’dui (Warden 1970). 63
Volcanic activity at Ambae in the last hundred years has been limited to fumarolic 64
manifestation (Wiart 1995; Bani et al. 2009b). However since the early 1990s Ambae 65
resumed eruptive activity within lake Voui, first with a phreatic eruption in 1995, followed by 66
a Surtseyan eruption in 2005 that formed a 500 m width and 50 m high islet in the centre of 67
the lake (Nemeth et al. 2006). This latter eruption has disrupted the equilibrium within lake 68
Voui leading to a spectacular colour change from blue to red in 2006 (Bani et al. 2009b). 69
70
On 6 September 2017, a new eruptive period started with series of strong explosions (heard 71
from neighbouring islands) that generated ash-laden plumes into the atmosphere. These first 72
eruptions were likely phreatic, judging by the absence of juvenile material in the ejected 73
products (Bani et al., in prep.), but injected large quantities (38,000 tons) of SO2 into the
74
atmosphere (OMI data, Bani et al., in prep.). On 22 September 2017, lava reached the surface 75
producing fire fountains, Strombolian eruptions and lava flows. In early October 2017 the 76
surficial activity had subsided, the period from 22 September to 6 October 2017 is referred to 77
here as phase 1 of activity. On 21 October 2017, a second phase of high-intensity eruptive 78
activity started. Intense ash fall and acid rains were reported on coastal villages. 39,000 tons 79
of SO2 were injected on the first two days of activity alone (OMPS data, Bani et al., in prep.).
80
By the end of November, the eruption intensity had subsided with ash and gas impacts 81
limited only to the top of the island. The period from 21 October to 7 December 2017 is 82
referred to here as phase 2 of activity. In mid-March 2018 a third intense eruptive phase 83
started producing ash falls and acid rains with even more destructive impacts on the 84
population and environment than during the prior phases. A night glow, presumably from fire 85
fountains, could be seen from Maewo and Pantacost islands, 50 km away from the summit. 86
Gas jetting was sustained for more than 20 days and clearly audible in a 15 km radius. The 87
eruption intensity decreased around 15 April after significant release of volcanic gases to the 88
atmosphere (123,000 tons released on April 6, 2018 alone; OMI data, Bani et al., in prep.). 89
The period from mid-March to mid-April 2018 is referred to here as phase 3 of activity. 90
Three months later, in mid-July 2018, the eruption intensity increased once again to its most 91
violent and destructive eruptive period. Ash fall covered the entire island, momentarily 92
plunging coastal villages in total darkness, causing houses to collapse. By early August 2018 93
the eruption intensity had waned. The period of July 2018 is referred to here as phase 4 of 94
activity. This July 2018 episode released an estimated 400,000 tons of sulfur dioxide into the 95
upper troposphere and stratosphere at an altitude of 16.9 km (NASA Earth Observatory, 96
2019). All together an estimated 3.2 Tg of SO2 was released during the 2017-2018 Ambae
97
eruption placing it among the top 6 largest eruption of the last 40 years in terms of SO2
98
loading (Bani et al., in prep.). A detailed narrative of the eruption and its impacts in terms of 99
ash fall, lahar and gas emissions will be presented elsewhere (Bani et al., in prep.). 100
101
In this contribution, we perform a petrological investigation of the magma expelled during 102
the four phases of activity. We present major element, trace element, and volatile content in 103
olivine and clinopyroxene hosted melt inclusions, embayments, matrix glasses and bulk rock 104
together with clinopyroxene geobarometry, olivine, plagioclase, and clinopyroxene 105
geothermometry and major element and volatile diffusion modelling. We find that the Ambae 106
plumbing system extends from 0.5 to 14 km depth with most of the magma involved in the 107
2017-2018 eruption sourced from a shallow reservoir at 0.5 to 3 km depth. Phreatic eruptions 108
in early September 2017 likely served as trigger to or facilitated the subsequent magmatic 109
activity but was itself likely triggered by magmatic gases. Olivine residence times in the 110
magma chamber(s) range from a few days to a year prior to eruption. We constrain the ascent 111
rate of the magma from the shallow reservoir to the surface at 4 to 75 m/s. This fast ascent 112
rate suggests that large amounts of pre-eruptive volatiles must have been present in the 113
reservoir, consistent with satellite observations of large SO2 emissions and of eruptive clouds
114
reaching the lower stratosphere. 115
117
Figure 1: A. Topographic hill shaded Shuttle Radar Topography Mission (SRTM) image of
118
Ambae island (credit NASA). Location of all coastal settlements are marked together with the
119
location of Voui lake. Upper left inset shows the location of Ambae/Aoba island within the
120
south Pacific. B. Ash deposit on the north-western part of Voui crater (image take on 21 May
121
2018). C. Planetscope Ortho tile satellite image of the summit area taken 10 March 2018
122
showing the strong degassing at that time (image credit: ESA)
123 124
METHOD
125
Samples 126
Tephra samples from phase one (September 2017), two (November 2017) and three (March 127
2018) were collected in the summit area within a few days to weeks of deposition. Ash 128
samples from phase four (July 2018) were collected 10 km west of the vent during 129
deposition. Samples from phase 1, 2 and 3 consisted of lapilli-size scoria with fragments 130
typically about 1 cm in diameter. Scoriae from eruptive phase 1, 2 and 3 and ash from 131
eruptive phase 4 were embedded in epoxy resin and polished to investigate their texture and 132
the composition of crystal phases and interstitial glasses. For eruptive phase 1, 2 and 3, part 133
of the same samples was crushed and sieved, and melt-inclusion bearing, euhedral and 134
unbroken olivine and pyroxene crystals were handpicked under a binocular microscope (in 135
the 0.5- and 2-mm grain size fraction). Melt inclusions and embayments were exposed by 136
polishing single crystals individually. Olivine crystals were oriented for polishing in order to 137
expose a maximum length of the embayments, from the end to the mouth of the embayment. 138
Polishing was performed without the use of diamond as to entirely avoid possible C 139
contamination in subsequent ion probe analysis, instead silicon carbide mats for coarse 140
polishing and corundum mats for final 3 µm, 1 µm and ¼ µm polishing were used. Single 141
crystals were subsequently mounted in indium. Melt inclusions are entirely glassy, often 142
contain a contraction bubble and are typically about 50 to 200 µm in diameter (Fig. 2B). 143
144
Analyses of major elements 145
Bulk tephra samples were powdered, mixed with LiBO2, and melted in an induction oven at
146
1050 °C for 4.5 min using graphite crucibles. Resulting glass beads were then dissolved in a 147
solution of deionized water and nitric acid and finally diluted by a factor of 2000. The 148
solutions were analysed by ICP-AES at Laboratoire Magmas et Volcans in Clermont-149
Ferrand. 150
Individual melt inclusions, embayments, matrix glasses and crystals were analysed with a 151
Cameca SX100 electron microprobe at the Laboratoire Magmas et Volcans in Clermont-152
Ferrand. For crystalline phases, beam conditions of 15 kV and 15 nA were employed, 153
while for glass analyses, the beam current was 6-8 nA and the beam defocussed to 10 µm. 154
Sodium was analysed first as to limit the effects of Na loss. The instrument was calibrated on 155
natural and synthetic mineral standards and glasses : wollastonite (Si, Ca), MnTiO3 (Ti, Mn),
156
Al2O3 (Al in minerals), standard glass VG2 (Al in glasses, see Óladóttir et al. 2008), Cr2O3
157
(Cr), fayalite (Fe), forsterite (Mg), NiO (Ni), albite (Na), orthoclase (K) and apatite (P). 158
Counting times were 10s minimum. Olivine core to rim transects were acquired by making 159
measurements every 10 µm from the crystal centre to the rim along a line perpendicular to 160
the crystal face. In order to produce accurate analyses for minor elements, acceleration 161
voltage was increased to 20 kV, beam current to 100 nA, and counting times to 20 s (Fe), 50 s 162
(Mn, Ni), and 100 s (Al, P). 163
164
Ion Probe analyses of volatile elements 165
Volatile (H2O, CO2, Cl, F, S) content in melt inclusions, embayments, and matrix glasses
166
were determined using a Cameca IMS 1280 ion microprobe at CRPG-CNRS-Nancy. 167
Analytical conditions were similar to other volatile studies (e.g., Hauri et al. 2002; Bouvier et 168
al. 2008; Shimizu et al. 2009; Rose-Koga et al. 2014; Moussallam et al. 2015). We used a Cs+ 169
primary beam with a current of 1 nA and an electron gun to compensate for charge build-up 170
at the sample surface. A 3-minute pre-sputter with a 30 × 30 µm square raster was applied, 171
then analyses were performed on the 15 to 20 µm spot in the center of the rastered-clean area 172
by a mechanical aperture placed at the secondary ion image plane. The mass resolving ≈7000 173
(with the contrast aperture at 400 µm, the energy aperture at 40 eV, the entrance slit at 52 µm 174
and the exit slit at 173 µm) meant that complete discrimination of mass interferences was 175
achieved (34S1H on 35Cl, 17O on 16O1H, 29Si1H on 30Si and 31P1H on 32S). We collected signals 176
for 12C (8 seconds), 17O (3 seconds), 16O1H (6 seconds), 18O (3 seconds), 19F (4 seconds), 27Al 177
(3 seconds), 30Si (3 seconds), 32S (4 seconds) and 35Cl (6 seconds; counting times in 178
parenthesis), with 2 seconds waiting time after each switch of the magnet. This cycle was 179
repeated 10 times during one analysis. One measurement lasted 12 min per spot. 180
The concentrations were determined using calibration curves (see supplementary materials) 181
obtained, at the beginning and at the end of each session, by measuring a set of natural 182
basaltic glasses during the same session and under the same analytical conditions (KL2G, 183
Jochum et al. 2006); KE12, Mosbah et al. 1991; VG2, Jarosewich et al. 1980; experimental 184
glasses N72, M35, M40 and M48, Shishkina et al. 2010 and MacQuarie glasses 47963 and 185
25603, Kamenetsky et al. 2000) with a large range of concentrations of volatile elements 186
overlapping those of our samples. Maximum errors, based on reproducibility over 10 cycles 187
of analyses, were less than 15% for CO2, 3% for Cl, 4% for S, and 5% for F and H2O.
188 189
LA-ICP-MS analyses of trace elements 190
Trace element measurements on melt inclusions, embayments and glasses were carried out 191
using a laser ablation system (193 nm Excimer Resonetics M-50E) associated with an 192
inductively coupled plasma mass spectrometer (Agilent 7500 cs LA-ICPMS at the 193
Laboratoire Magmas et Volcans, Clermont-Ferrand). Analysis were performed following 194
classical procedures outlined in previous studies (e.g., Le Voyer et al. 2010; Rose-Koga et al. 195
2012). We used a pulse energy of about 3 mJ, a spot diameter between 15 and 33 µm and a 196
laser pulse frequency of 2-3Hz, depending in the inclusion size to keep a fluence at sample 197
surface of about 4 J/cm-2. The background was measured for 30 to 40 seconds before ablation 198
and analysis time was approximately 100s. Data reduction was performed using the 199
GLITTER software (www.es.mq.edu.au/GEMOC). This technique uses CaO (measured by 200
EMP) as an internal standard. Reproducibility and accuracy of the analysis were constrained 201
by systematic analysis of 2 standards BCR2-G and 612 at the beginning, in the middle and at 202
the end of the session. Typical errors on the samples (1σ error of mean) is less than 10 % for 203
all trace elements, except for Lu (<20%) and B (<40%). 204
205
Volatile diffusion modelling 206
Concentration profiles recorded in the embayments were fitted by a diffusion model similar 207
to that of Ferguson et al. (2016). While the detail of the model and test results are explained 208
in the Supplementary, a brief description is given here. An embayment profile was measured 209
in a tube-like pocket of melt found within an olivine crystal. Because of its shape and 210
incompatibility of volatile elements, such as H, C, S, Cl, and F, in olivine, diffusive exchange 211
of elements was considered only possible at the mouth of the embayment. This justifies the 212
use of diffusion solution in 1-D geometry. Naturally, the concentrations of volatile elements 213
are systematically lower at the mouth of embayment. Having these geometrical constraints, 214
we have developed a model with the following initial and boundary conditions for Fick’s 215 Second Law: 216 d! d! = 𝐷 𝐶! !!! !"!, (1) 217 𝐶 = 𝑐!"!#!$%, 𝑥 > 0, 𝑡 = 0; 𝐶 = 𝑐!"!#!$%, 𝑥 = ∞, 𝑡 > 0, 218 𝐶 = 𝑓 𝑡 , 𝑥 = 0, 219
where D(CW) is the diffusion coefficient of water in melt as a function of total dissolved
220
water concentration; C, the concentration of diffusing species; t, time; and x, distance. 221
Concentrations of volatile elements were set at a constant value cinitial, in the embayment,
222
determined by the plateau concentration value inside the embayment. Concentration at the 223
interface was set by a function with respect to time, which determines H2O-CO2 solubility in
224
magma along the linear isothermal decompression. In a magma ascending for eruption, and 225
for fast diffusing species such as H2O, a closed system degassing approximates the volatile
226
element segregation better than an open system, as the latter requires complete segregation of 227
magma from gas at every instant of degassing. We used SolEx (Witham et al. 2012) to 228
determine the closed system, equilibrium degassing path for H2O, CO2, S, and Cl, and the f(t)
229
was determined from the SolEx result with a constant decompression rate (dP/dt). The 230
diffusion equation was solved by Crank-Nicolson finite difference method for the 1-D 231
geometry. 232
233
This diffusion calculation had therefore four parameters: (1) diffusion coefficient, (2) initial 234
concentration, (3) concentration of a volatile element at x=0 which changes with time (i.e. 235
decompression), (4) the mass of equilibrium bubble/fluid present at the moment of the 236
magma ascent, and (5) the decompression rate. The first three parameters were independently 237
determined with reasonable confidence from the experimental data, concentration profile, and 238
magma temperature. The parameter (4) was unknowable, and it influenced the degassing path 239
significantly (see the Supplementary). Here, we have tested its influence by varying from 0 to 240
1 wt % of pre-ascent volatile mass. By setting four parameters, the decompression rate was 241
determined by minimizing the least-square residuals. While the method of Ferguson et al. 242
(2016) minimizes X simultaneously for three volatile species (H2O, CO2, and S), it was not
243
possible in our case. Diffusion profile of each volatile species were hence solved separately. 244
R-based script, together with an example profile is given in Appendix B. 245
246
Olivine diffusion modelling 247
Chemical gradients (Fe–Mg) in olivines were modelled in one dimension with the DIPRA 248
software program (Girona and Costa 2013). DIPRA is a finite difference code that solves 249
Fick's second law of diffusion in order to model the one-dimensional diffusion of Fe – Mg (as 250
forsterite, Fo = Mg/(Mg + Fe), in mole fraction), Mn, Ni, and Ca in olivine. Diffusion 251
anisotropy was accounted for by determining the olivine crystallographic axes using EBSD 252
and the angles between the electron microprobe traverse and the three crystallographic axes. 253
Temperature and pressure calculations are detailed below, oxygen fugacity was fixed at the 254
Nickel-Nickel-Oxide buffer in all calculations. Initial conditions for sample Ph1Ol2E_P1 and 255
Ph1Ol2E_P2 used a step function while all other calculations were performed using a 256
homogeneous profile (see Fig. S6). The use of a step function for Ph1Ol2E_P1 and 257
Ph1Ol2E_P2 was justified by the high and non-random residual that would result from using 258
a homogeneous profile. Note that the effect of water on the Fe-Mg interdiffusion (e.g., Wang 259
et al. 2004; Hier Majumder et al. 2005) is not taken into consideration in the DIPRA 260
calculations. 261
262
Post-entrapment crystallisation modelling 263
Corrections of major and trace element composition in olivine-hosted melt inclusions for post 264
entrapment crystallisations (PEC) was performed. It consisted of dissolving increments of 265
equilibrium olivine into the melt inclusion liquid until the Fe-Mg Kd reaches the equilibrium 266
value. The equilibrium value for the Mg/Fe exchange coefficient between olivine and liquid, 267
Kd, was determined by a model accounting for the influence H2O and alkalies (Toplis 2005
268
with T = 1145 ºC and P = 1000 bars), and the predicted Kd = 0.25±0.01. It should be noted 269
that this value of Kd lower than the common value of 0.3 reflects that the Ambae melts were 270
rich in Na2O and K2O. To test the effect of oxygen fugacity, Fe3+/Fetot ratio was varied from
271
0.14 to 0.32 for the PEC calculation, reflecting the range observed for subduction zone 272
magmas, from FMQ-1 to FMQ+2; (e.g., Kress and Carmichael 1991; Bénard et al. 2018). 273
With Fe3+/Fetot = 0.14, we added successive increment of olivine back into the melt
274
recalculating an observed Kd after each step and the process stopped when observed Kd = 275
predicted Kd (0.25±0.01 here). By doing this, the mean mass of olivine added was only of 276
1% (with a standard deviation of 0.2%, n=57) suggesting that very little PEC took place. At 277
higher Fe3+/Fetot =0.32 (FMQ+2) or Fe3+/Fetot =0.23 (FMQ+1), the redox-corrected observed
278
Kd is already too high compared to the “Toplis-predicted” Kd so that no olivine can be added 279
to the melt. In the following, the corrected value reported are calculated for Fe3+/Fetot = 0.14.
280 281
Estimation of microlite number density 282
Toramaru et al. (2008) developed a model to link microlite number density (N) in pyroclastic 283
rocks to the rate of water exsolution which in turn can be linked to the rate of magma ascent. 284
Microlite crystallization can happen as a consequence of cooling or decompression-induced 285
degassing. In the case of decompression-induced degassing, a numerical simulation 286
performed by Toramaru (2008) shows that the microlite number density is directly linked to 287
the increase in liquidus temperature caused by degassing: 288 !!! !" = ! ! !/! (2) 289
With the constant a mostly a function of melt chemistry and water concentration: 290
𝑎 = 3. 10!"!!.!"# !!"#!!!" !!.!"!!!! (3)
291
where major element concentrations are in weight %. 292
The relationship between the increase in liquidus temperature TL and the degassing rate is
293
given by the derivative of the liquidus depression curve: 294 !!! !" = !!! !!!!!. !!!!! !" (4) 295
The liquidus depression curve has been determined experimentally for olivine ( !!!
!!!!! =
296
40.4 − 5.94𝐶!!!+ 0.2283𝐶!!!!; Médard and Grove 2008), and plagioclase ( !!!
!!!!! =
297
54.66𝑒!!.!"!!!!; Almeev et al. 2012) in basaltic melts. In the absence of an experimental
298
calibration for clinopyroxene, we calculated ( !!!
!!!!!~26) for the bulk scoria of phase 1 using
299
the pMelts software (Ghiorso et al. 2002). 300
The degassing can in turn be converted into a decompression rate using the derivative of the 301
water solubility curve: 302 !!!!! !" = !!!!! !!!!!. !!!!! !" (5) 303
For our trachybasaltic bulk composition, we fit a quadratic function to the solubility data 304
produced by the model of Moore et al. (1998) which gives !!!!!!!
!!!= 182.3𝐶!!! 305
In a steady state, the decompression rate at the microlite nucleation depth is linked to the 306
ascent velocity (Toramaru et al. 2008): 307
𝑉! =!"! .!!!!!
!" (6)
308
where ρ is the magma density at the microlite nucleation depth. 309 310
RESULTS
311 Mineralogy 312The investigated scoriae are glassy, and typically have low crystallinity (Fig. 2A), with rare 313
phenocrysts of plagioclase, olivine, and clinopyroxene, and microlites of the same phases. 314
Small euhedral spinel microlites are also present, often associated with olivine phenocrysts 315
(Fig. 2B). Most olivine phenocrysts have compositions ranging from Fo85 to Fo79, as expected
316
for equilibrium with the bulk rock compositions(Table S1, S2, S3, S4, Fig. 3 and 4). Four 317
types of zoning patterns can be identified in olivine phenocrysts (Fig. 3, 4B): (1) no zoning 318
(homogeneous crystals, Fig 3D, 4B); (2) normal zoning (Fig 3A, 3B, , 3C, 3F, 3G 4B); (3) 319
reverse zoning (Fig 2B, 2F, 3H, 3I); and (4) complex zoning (Fig 2E). Homogeneous crystals 320
are dominant in phase 1, and a few are still present in phase 2. Crystals with weak normal 321
zoning (less than 1.5 Fo unit) are only present in phase 1 and again in phase 4. Reverse 322
zoning is typical for most crystals from phase 2 and 3. Crystals with the stronger reverse 323
zoning also show rounded edges indicative of dissolution. Reverse zoning can be interpreted 324
as reflecting either magma mixing (Ruth et al. 2018) or reheating of a magma reservoir. 325
Complex zoned phenocrysts have a weak internal reverse zoning very similar to the one 326
observed in the previous type, followed by a strong normal zoning. These complex zoned 327
phenocrysts are associated with a high microlite density, and present mostly in phase 1, 328
although one crystal has been found in phase 2 and one in phase 3. These complex zoned 329
phenocrysts are very similar to the olivine phenocrysts described from the April 2007 330
eruption of Piton de la Fournaise (Reunion Island) where they have been interpreted as 331
products of lateral magma transfer in the plumbing system (Albert et al. 2019). As for the 332
Reunion samples, normal zoning patterns around melt inclusions are identical to normal 333
zoning patterns near the crystal rims, indicating that the zoning is not due to magma mixing 334
(Albert et al. 2019). 335
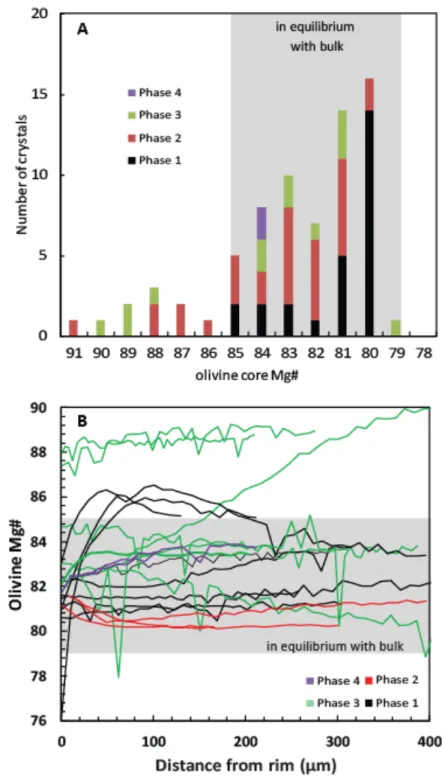
A significant fraction of the olivine phenocrysts (Fig. 4A) have core compositions more 336
magnesian than Fo84 and are thus not in equilibrium with any of the measured bulk rock
337
compositions (Fig. 4). We interpret those crystals as antecrysts, formed from a batch of more 338
primitive magma. A few small olivine microlites have compositions ranging from Fo82 to
339
Fo74 (Table S3). Clinopyroxene phenocrysts are normally zoned, with Mg# ranging from 85
340
to 78 (Table S5, calculated assuming all Fe as FeO). Oscillatory zoning is occasionally 341
observed (Fig. 2D). Clinopyroxene microlites are small and difficult to analyse but have Mg# 342
in the range 80-72. Plagioclase phenocrysts are euhedral, normally zoned and commonly 343
show oscillatory zoning (Fig.2C). Their composition varies from An81 in the core to An70
344
near the rims (Table S6). Euhedral plagioclase microlites have compositions varying from 345
An80 to An58. Spinel compositions are highly variable: spinel included in olivine phenocrysts
346
are chromites (41 wt% Cr2O3), whereas the rare spinel microlites tend to be richer in iron (58
347
wt% FeO+Fe2O3 on average, up to 76 wt%).
348
Figure 2: A. BSE microphotograph of the typical glassy texture of the pyroclasts (phase 1),
350
with plagioclase (micro-)phenocrysts and microlites and a few olivine and clinopyroxene
351
microlites. B. BSE microphotograph of a normally zoned olivine phenocryst with large glassy
352
melt inclusions associated with spinel crystals and retraction bubbles (phase 2). C. Enhanced
353
BSE microphotograph of oscillatory zoning in a plagioclase phenocryst that contain small
354
melt-inclusions (phase 1). D. BSE microphotograph of clinopyroxene phenocrysts with
355
complex oscillatory zoning and melt inclusions (phase 2). E. BSE microphotograph of an
356
olivine phenocryst showing complex zoning: slight inverse zoning around the core, followed
357
by clean normal zoning on the edges (phase 1). The phenocryst also contains spinel
358
inclusions and is surrounded by an increased microlite density. F. Enhanced BSE
359
microphotograph of a group of olivine phenocrysts with a slight reverse zoning around the
360
edges (phase 2). The phenocrysts contain spinel and melt inclusions.
361 362
363
Figure 3: Rim to core electron microprobe %Fo (mol%) (= 100 × Mg/ [Fe + Mg]), Ca, Mn,
364
and Ni traverses in olivine crystals from phase 1 (A to E) and phase 3 (F to J). AO10, AO11,
365
AO22 and AO18 show predominantly normal zoning with AO10 showing an alternation from
366
normal to reverse zoning close to the rim. AO12 shows no resolvable zoning pattern. Ol5ph3,
367
Ol2ph3 and Ol1ph3 show normal zoning while Ol7ph3 and Ol3ph3 shows reverse zoning.
369
Figure 3con: Rim to core electron microprobe %Fo (mol%) (= 100 × Mg/ [Fe + Mg]), Ca,
370
Mn, and Ni traverses in olivine crystals from phase 1 (A to E) and phase 3 (F to J). AO10,
371
AO11, AO22 and AO18 show predominantly normal zoning with AO10 showing an
372
alternation from normal to reverse zoning close to the rim. AO12 shows no resolvable zoning
373
pattern. Ol5ph3, Ol2ph3 and Ol1ph3 show normal zoning while Ol7ph3 and Ol3ph3 shows
374
reverse zoning.
376
Figure 4: A. Frequency diagram of the Fo content in olivine cores from phase one, two and
377
three. The range of Fo composition in equilibrium with bulk is calculated using measured
378
bulk rock compositions and a Kd of 0.3. Note that a significant fraction of phase 2 and 3
379
olivines have core composition more magnesian-rich than expected for equilibrium with the
380
bulk. B. Fo profiles of olivine phenocrysts from phases 1,2,3 and 4.
381 382
Major elements 383
The PEC corrected composition of melt inclusions, embayments and matrix glasses in major 384
and trace element is given in Tables S1 and S7. Uncorrected compositions are given in Tables 385
S2 and S8. 386
387
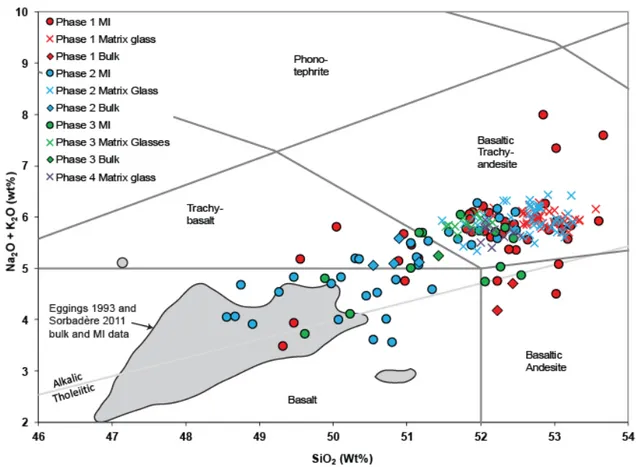
Samples for the 2017-2018 eruption are the most differentiated volcanic rocks on the island, 388
with the exception of one trachyandesite analysis reported by Eggins (1993). The bulk rock 389
compositions (Table S1) plot in the trachybasalt and basaltic trachyandesite fields of the TAS 390
diagram (Fig. 5), as an extension of previously published analyses for Ambae island (Warden 391
1970; Gorton 1977; Eggins 1993). Previously reported whole rocks (and melt inclusion) 392
compositions from older (undated) deposits on Ambae are more primitive, mostly tholeiitic 393
and alkali basalts. The younger rocks of Ambae belong to the low-Ti suite of Eggins (1993). 394
This suite starts with voluminous magnesian olivine- and clinopyroxene-phyric basalts 395
(“ankaramites”) that form the largest part of the island. More differentiated plagioclase-396
phyric basalts are confined to stream courses and represent the youngest eruptive products of 397
the volcano, including lava flows from the latest significant eruption of the volcano that 398
produced the N’dui N’dui flow about 350 years ago (Warden 1970). Products of the 2017-399
2018 eruptive phase are slightly more differentiated than these plagioclase-phyric basalts, and 400
likely represent further evolution along a fractional crystallization trend (Fig. 5). In total 401
alkali-silica space, most inclusions plot as alkali basalt, basalt or basaltic trachy-402
andesite while matrix glasses are basaltic trachy-andesite in composition. In details, melt 403
inclusions, matrix glasses and bulk rock compositions from phase 1 tend to be slightly more 404
evolved than the ones of phase 2, 3 and 4. 405
407
Figure 5: Total alkalis versus silica. Melt inclusions, matrix glasses and bulk rock
408
compositions (all normalized) are reported for the first three phases of eruptive activity
409
between 2017 and 2018 and matrix glass compositions are reported for phase 4. Bulk rock
410
and melt inclusion composition data from older (undated) deposits are from Eggins (1993)
411
and Sorbadere et al. (2011).
412 413
Melt inclusions have Mg# ranging from 31.7 to 59.6 (assuming all iron is FeO). Host olivine 414
crystals have compositions ranging from Fo79 to Fo91. As expected for near equilibrium melt
415
inclusion-host pairs, there is a clear correlation between the olivine and melt inclusions 416
compositions (Fig. 6A). Interestingly, olivine erupted during the first phase of activity 417
(September 2017) tend to have lower Forsterite content (Fo < 84%) and to contain inclusions 418
with low Mg# (Mg# < 50) while olivine erupted during the subsequent two phases of activity 419
(November 2017 and March 2018) have a larger range of Forsterite content (Fo up to 91%) 420
and contain inclusions with a larger range of Mg# (Mg# up to 60). In addition, melt 421
inclusions from the first phase tend to be richer in Si, Al, Fe, Mn and K, and poorer in Ca and 422
Mg compared to melt inclusions from the second and third phases (Fig. 6). This is also seen 423
with the interstitial glasses which show a small increase in MgO, Mg# and CaO/Al2O3, and a
424
small decrease in Na2O and K2O between phases 1, 2, 3 and 4.
425 426
427
Figure 6: Major element compositions of olivine and pyroxene-hosted melt inclusions
428
(olivine-hosted inclusions are PEC-corrected). A. Olivine Forsterite content vs melt inclusion
429
Mg#. B. SiO2 vs melt Mg#. C. CaO vs SiO2. D. FeOt vs MgO. E. CaO vs MgO. F. Al2O3 vs
430
MgO. More primitive melt inclusions data from Ambae are also shown, together with
431
MELTS-calculated liquid lines of descent at 200 MPa (dotted arrow) and 500 MPa (solid
432
arrow) (Sorbadere et al. 2011).
433 434
Trace elements 435
Trace and rare earth elements concentrations in melt inclusions and matrix glasses show no 436
systematic differences between the first three eruptive phases (Fig. S4 and 7). The rare earth 437
element distribution, normalised to chondrite (Sun and McDonough 1989), is typical of arc 438
magmas, being depleted in heavy rare earth elements. The positive correlations, passing close 439
to the origin, between incompatible element pairs (Fig. 7A and 7B) show that melt inclusion 440
compositions of the three eruption phases plot on a single trend of magma differentiation, 441
suggesting they belong to a co-genetic magmatic series. 442
444
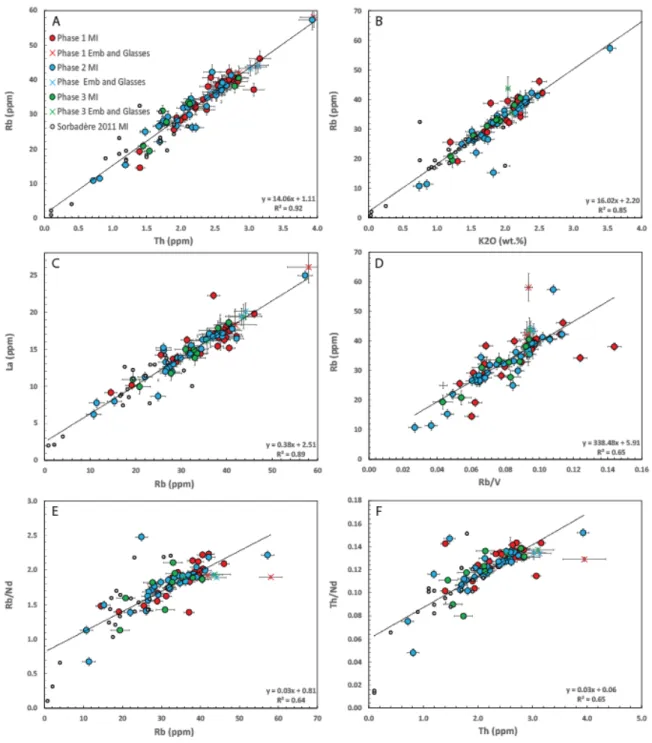
Figure 7: Trace element variation diagrams from melt inclusions and matrix glasses from the
445
2017-2018 eruption (this study; note that olivine-hosted MI are PEC-corrected) and from
446
older deposits (Sorbadere et al. 2011). A. Plot of Rb versus Th. B. Plot of Rb versus K2O. C.
447
Plot of La versus Rb. D. Plot of Rb versus Rb/V. E. Plot of Rb/Nd versus Rb. F. Plot of Th/Nd
448
versus Th. Linear regression lines through all data are presented on each plot. The data from
449
A and B define linear trends that passes through the origin as expected for fractional
450
crystallization while data from C define a linear correlation that does not pass through the
451
origin, potentially indicative of mixing between two components. Data from D is not well
452
explained by a linear relationship (R2=0.65) as expected for melts related by either mixing or
453
fractional crystallisation. Data from E and F are not well explained by linear relationships
454
(R2=0.64 and 0.65 respectively), potentially indicating mixing between two components. On
455
diagram E and F fractional crystallisation should result in no variations in Rb/Nd and Th/Nd
456
as a function of Rb and Th concentrations respectively.
Volatiles 458
In melt inclusions and matrix glasses, chlorine ranges from 1435 to 7243 ppm, fluorine from 459
410 to 779 ppm, water from 0 to 2.2 wt.%, CO2 from 0 to 3899 ppm and sulfur from 30 to
460
1541 ppm. Both H2O and CO2 in melt inclusions have the potential to be altered during
post-461
entrapment processes such as diffusive H+ exchanges between the MI and the melt through 462
the olivine (e.g., Massare et al. 2002; Danyushevsky et al. 2002; Chen et al. 2011; Gaetani et 463
al. 2012; Bucholz et al. 2013; Portnyagin et al. 2019) or CO2 diffusion between the MI and its
464
shrinkage bubble (e.g., Anderson and Brown, 1993; Steele-Macinnis et al., 2011; Wallace et 465
al., 2015). While there is no evidence for either process in the investigated sample set, neither
466
can be discarded. A conservative approach is hence to consider the measured H2O and CO2
467
values as minima. Melt inclusions from phase one tend to be richer in chlorine and fluorine 468
and poorer in water than melt inclusions from phase two and three, with phase three being the 469
poorest in chlorine and fluorine. No systematic differences are observed in the CO2 and sulfur
470
content of the melt inclusions between the three phases. 471
472
Neither chlorine, fluorine nor CO2 correlates with Nb despite being theoretically similarly
473
incompatible (Fig. S5A, B and D). Likewise, water does not correlate with Ce despite being 474
theoretically similarly incompatible (Fig. S5C). Finally, the sulfur content does not correlate 475
with FeO content suggesting that sulphide saturation did not take place during the magmatic 476
evolution recorded by melt inclusions. Together all these observations suggest that the 477
volatiles contents of melt inclusions and matrix glasses are not determined by differentiation 478
and must be more reflective of degassing processes even though no clear open- nor closed- 479
system degassing trend is shown by the data. Little correlations are observed between volatile 480
element excepted for water and sulfur (Fig. 8). The majority of the sixty-eight melt inclusions 481
analysed have low CO2 content, between detection limit (<50) and 500 ppm, while only five
482
inclusions have CO2 content above 1000 ppm.
483 484
485
Figure 8: Volatile elements abundance in melt inclusions, embayments and matrix glasses
486
from Ambae.
487 488
Geothermobarometry and volatile saturation pressure 489
The presence of euhedral microlites of plagioclase, clinopyroxene, and olivine indicates that 490
interstitial glasses are saturated with all three phases. Interstitial glasses are in equilibrium 491
with olivine microlite rims (Fe/Mg Kd = 0.27-0.29;Roeder and Emslie 1970), clinopyroxene 492
microlite rims (Fe/Mg Kd = 0.19-0.33; Putirka 2008), and plagioclase microlite rims (Ab/An 493
Kd=0.17-0.32, Putirka 2008). Pre-eruptive temperatures were thus calculated using a variety 494
of mineral-saturation models (Table 1). At least 15 glass compositions were analysed for each 495
phase; for a given phase, all analyses are within analytical error of each other, so only the 496
average value was used for thermobarometry calculations. All these estimates are within 497
error of each other and are consistent with a pre-eruptive temperature of 1145 ± 15 °C, with 498
possibly a small increase of 8 °C between phase 1 and phase 4. These calculations were 499
performed without taking into account the influence of water on mineral-saturation 500
temperatures. Water concentrations in matrix glasses vary between 0.01 and 0.81 wt% (Table 501
S9). Addition of a maximum of 0.81 wt% H2O results in a 30 °C decrease (Médard and
502
Grove 2008), i.e. a minimum pre-eruptive temperature of 1115 ± 15 °C. 503
504
Since interstitial glasses are saturated with olivine, plagioclase and clinopyroxene, it is 505
possible to estimate the equilibration pressure from the pressure-dependence of the olivine-506
plagioclase-clinopyroxene cotectic (Yang et al. 1996). The calibration of Yang et al. (1996) 507
as implemented by Kelley and Barton (2008) gives pressure estimates of 50 ± 110 MPa, , 508
indicating that the latest stages of crystallization occurred in the upper 6 km of the crust. 509
Given that the bulk rock compositions are also saturated with olivine, plagioclase and 510
clinopyroxene, it is possible to estimate a pressure where the melt equivalent to the bulk rock 511
was extracted using the same method. The average pressure at which fractional crystallization 512
from a more mafic magma produces the bulk rock composition is 133 ± 110 MPa. The model 513
of Kelley and Barton (2008) has been developed for water-poor Icelandic basalts. Addition of 514
water stabilizes clinopyroxene, resulting in pressure estimates that are too high (Husen et al. 515
2016). If interstitial glasses contained water when they last equilibrated with the phenocrysts, 516
the equilibration pressure would be lower, i.e. within error of the surface. 517
518
Crystallization pressures can also be estimated using the pressure-sensitive incorporation of 519
the jadeite component in clinopyroxene (e.g., Putirka, 2008). Barometers have been 520
calibrated either purely from the jadeite component of the clinopyroxene, or from jadeite 521
partitioning between clinopyroxene and melt. This equation is very sensitive to temperature 522
and water concentration in melts, but less sensitive to the exact melt composition. We 523
simultaneously solved for pressure and temperature using equation (30) and (33) of Putirka 524
(2008) to minimize temperature effects. We initially paired microlite and phenocryst rims 525
compositions with matrix glass compositions, phenocryst core compositions with bulk rock 526
compositions, and melt inclusion compositions with their host phenocrysts, and only kept 527
clinopyroxene analyses for which Fe/Mg Kd = 0.28 +/-0.08 (Putirka 2008). Phenocrysts cores 528
are, however, rarely in equilibrium with the bulk composition, and more commonly in near-529
equilibrium with the matrix glass, so we paired phenocryst core compositions with matrix 530
glasses. This approximation could produce a ~30 MPa error on pressure, much smaller than 531
the accuracy of the barometer. Water concentration in glasses was assumed to be 1.5 wt%, 532
the average water content in melt inclusions, except for melt inclusions in which water 533
concentrations have been analysed. Equilibrium between 11 melt inclusions and their host 534
clinopyroxenes gives pressures between 43 and 326 MPa, with an average pressure of 184 ± 535
75 MPa at an average temperature of 1089 ± 11 °C. The temperature is lower than the 536
temperature estimated from glass thermometry, since it is calculated with a higher water 537
content. Identical pressures and temperatures were obtained from 26 analyses of phenocryst 538
cores (170 ± 86 MPa at 1091 ± 13 °C) and 28 analyses of phenocryst and microlite rims (188 539
± 73 MPa at 1093 ± 12 °C), with a global average of all pressure calculations of 181 ± 78 540
MPa. Individual pressures vary between 13 and 328 MPa. Interestingly, the use of a 541
clinopyroxene-only barometer (equation 32b of Putirka et al. 2008) produces similar results, 542
with an average of 155 ± 65 MPa. Uncertainties due to barometer calibrations are quite large, 543
with a standard error of estimate of 160 MPa for equation (30) of Putirka (2008). The final 544
pressure estimates of 180 ± 160 MPa indicates that crystallization happened between 1 and 545
12 km, assuming a 2900 kg.m-3 density for the basaltic crust. These values are consistent with 546
estimates from melt inclusion volatile elements concentrations, and within error of estimates 547
based on cotectic melt compositions using bulk rock compositions. Pressure estimated from 548
cotectic melt compositions of interstitial glasses are lower and register the latest stages of 549
crystallization, whereas mineral compositions can register earlier, possibly deeper, stages. 550
551
Melt inclusions entrapment pressures were calculated using the model of Iacono-Marziano et 552
al., (2012) for H2O-CO2 saturation pressure. They yield entrapment pressures between 20 and
553
427 MPa (Fig. 9), consistent with pressures of 43 to 326 MPa estimated from 554
clinopyroxene/melt barometry. Given the above-reported error on the volatile content 555
determination and the error on the model, the results can conservatively be taken to be 556
accurate at ± 20%. Yet, as discussed previously, H2O and CO2 values are to be considered as
557
minimum values due to possible diffusion of both species out of the MI. The entrapment 558
pressures are therefore also to be taken as minimum pressure estimates. The two deepest 559
inclusions are hosted in pyroxenes and their entrapment pressure estimates from volatile 560
saturation (410 and 427 MPa) is fairly consistent, although higher, than their host pyroxene 561
calculated crystallisation pressure (277 and 302 ± 160 MPa). Most other pyroxene-hosted 562
inclusions record volatile saturation pressure lower than their host pyroxene calculated 563
crystallisation pressure yet within the standard error. Saturation pressures are also consistent 564
with the calculated cotectic pressures, and point to a shallow magma storage system 565
somewhere between 0.5 and 3 km depth for most of the crystals. 566
567
Figure 9: Melt inclusions entrapment pressure calculated from H2O-CO2 saturation
568
pressure, compared to melt Mg# and host olivine forsterite content. Note that some of the MI
569
are hosted in pyroxenes, hence not plotted on the right-hand side diagram.
570 571
Residence time 572
We modelled the %Fo concentrations of five profiles obtained from two olivine from phase 1 573
and two olivine from phase 2 (Fig. 10). The diffusion model parameters and results are 574
provided in Table 2. For normally zoned phase 1 olivine we determined diffusion timescales 575
ranging from 4 to 185 days. For reversely zoned olivine from phase 2 we determined 576
diffusion timescales ranging from 82 to 293 days (keeping in mind that phase 2 occurred 577
about two months after phase 1). While our dataset is limited, it does already highlight a 578
variety of diffusion timescales recorded by olivine phenocryst/antecryst. These results 579
suggest that the shallow magma chamber has been periodically recharged over the days to 580
year preceding the eruption. The latest recorded recharge event potentially occurred only a 581
few days prior to the eruption while the oldest recorded event occurred about a year before 582
the eruption. 583
584
Figure 10: Results of diffusion modelling compared to %Fo concentrations profiles
585
(measured by EMPA) in two olivine crystals from phase 1 and two olivine crystals from
586
phase 2 of the 2017-2018 Ambae eruptions. Modelling was performed using the DIPRA
587
software (Girona and Costa 2013). Phosphorus profiles are shown and do not correlate with
588
%Fo content as expected for Fe-Mg zoning resulting from diffusion although the error on
589
phosphorus measurement (3σ = ±0.002) could partly mask any correlation. Initial conditions
590
are shown in Fig. S6.
591 592
Ascent rates 593
Volatile diffusion modelling was performed to match the measured H2O concentration
594
profiles (obtained by SIMS) along three melt embayments from phase two of the 2017-2018 595
eruption (note that the olivine used here are different from the ones used for Fe-Mg diffusion 596
modelling in the previous section). Best fit solutions of the diffusion models are shown in 597
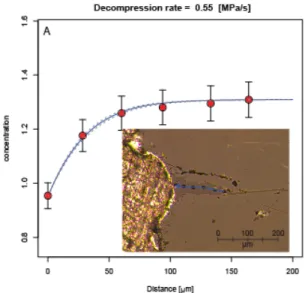
Fig. 11 with initial conditions and model parameters given in Table 3. These results give 598
decompression rates of 0.24 ±0.04, 0.25 ±0.06 and 0.55 ±0.20 MPa/s which corresponds to 599
ascent rates in the order of 33-75 km/h, assuming a unique melt/rock density of 2665 kg.m-3 600
for the trachybasaltic magma (Lange and Carmichael 1990). Concentrations of H2O at the
601
edge of the profiles are 0.06, 0.18, and 0.95 wt% indicating the degassing process can be 602
quenched at about 4 MPa. 603
604
Diffusion modelling was also performed to reproduce S and Cl concentration profiles 605
(obtained by SIMS). However, the measured profiles showed S and Cl concentrations at the 606
edge of the embayments and in the surrounding matrix glass, that are much higher than 607
expected for equilibrium at 0.1 MPa (i.e., ~50 to 200 ppm S and > 3400 ppm Cl remaining). 608
This suggests that decompression rates were too high for S and Cl to maintain equilibrium 609
during degassing, resulting in oversaturation of these species in the melt, as shown 610
experimentally for CO2 (Pichavant et al. 2013).
611 612
613
Figure 11: Results of diffusion modelling compared to H2O concentration (measured by
614
SIMS) in three melt embayments from phase two of the 2017-2018 Ambae eruptions. Insets
615
show microphotograph of each embayment with blue arrows marking the location of the
616
SIMS analyses.
618
Ascent rates can also be estimated from the microlite density (Toramaru et al. 2008). The 619
number and nature of microlites is extremely similar between samples of phases 1, 2 and 3 620
(Fig. S7). A higher number of microlites is observed in ashes from phase 4, but this is mainly 621
due to the abundance of very small microlites that are not observed in other phases. These 622
microlites might have crystallized during eruption. 2D microlite number densities and phase 623
proportions were estimated using BSE images. This allowed us to compute average microlite 624
sizes using the method of Hammer et al. (1999). To calculate 3D microlite number densities, 625
we then divided the 2D microlite number densities by the average microlite size. For samples 626
from phase 1, average microlite number densities averaged on seven BSE images are 3.8.1013 627
m-3 for plagioclase, 9.7.1012 m-3 for clinopyroxene, and 1.8.1012 m-3 for olivine. Given the 628
small number of crystals (2 to 10 per image), the olivine MND has a very large uncertainty, 629
and will not be taken into account. Using a maximum volatile content at microlite nucleation 630
of 2.23 wt% H2O (highest measurement in melt inclusions) results in decompression rates of
631
1.6.105 Pa.s-1 and 1.1.105 Pa.s-1 calculated from plagioclase and clinopyroxene, respectively. 632
The density of the trachybasaltic magma is 2665 kg.m-3 (Lange and Carmichael 1990), 633
producing ascent rates of 4-6 m.s-1., or 15-23 km.h-1, consistent with values determined from 634 volatile diffusion. 635 636
DISCUSSION
637The Ambae plumbing system
638
Clinopyroxene crystallisation pressures and melt inclusions entrapment pressures both 639
suggest that the magma involved in the 2017-2018 Ambae eruption had been crystallising 640
pyroxene and olivine at depths of 0.5 to 14 km minimum. Most melt inclusions, however, 641
record low entrapment pressures corresponding to depth of 0.5 to 3 km. This suggest that 642
most of the erupted magma originated from a shallow magma chamber located at sea level 643
(Fig. 12). There is no relationship between the melt inclusions entrapment pressures and 644
markers of magmatic differentiation (Fig. 9), suggesting that the plumbing system is not 645
arranged in a succession of progressively shallower and more evolved magma chambers. 646
Instead, multiple chambers of variously differentiated magma must occupy similar depth 647
levels, following horizontally separated pathways (Fig. 12). 648
649
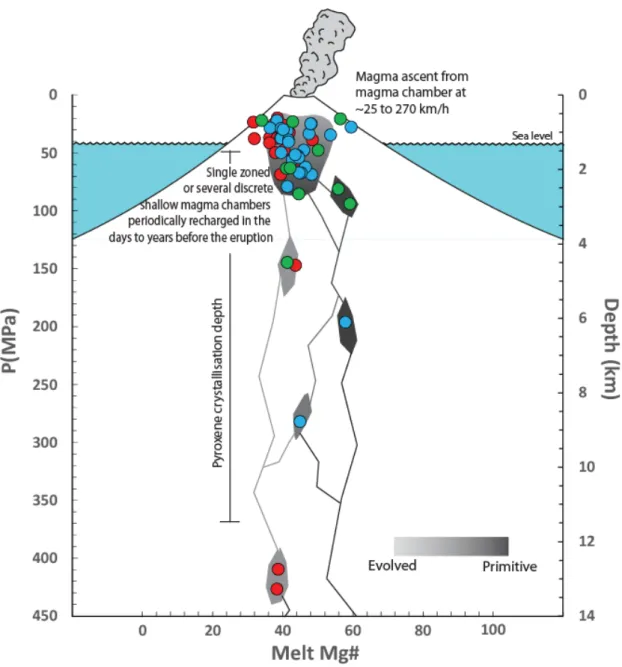
650
Figure 12: Schematic representation of the Ambae plumbing system on which melt inclusions
651
entrapment pressure and Mg# are overlaid. Magmas at different stages of differentiation
652
migrate through the crust and mix via episodic recharge events in a shallow magma chamber
653
located at sea level. During the eruption, evolved magma is emptied preferentially towards
the beginning while more primitive magma is erupted during later phases. Note that there is
655
no relationship between Mg# and horizontal coordinates of the melts.
656 657
The 2017-2018 emptying of Ambae’s plumbing system
658
The 2017-2018 eruption started with phreatic activity and the creation of a small pyroclastic 659
cone at the lake centre several days before the first appearance of phase one lava at the 660
surface (Bani et al., in prep). A phreatic or phreatomagmatic start to a magmatic eruption is a 661
commonly observed occurrence at volcanoes with previously-closed conduits, examples 662
include the 1955 Bezymianny (Gorshkov 1959), 1980 Mt St Helens (Lipman and Mullineaux 663
1981), 1990 Kelut (Bourdier et al. 1997), 1990–1995 Unzen (Nakada et al. 1999) and 2017-664
ongoing Nevados de Chillan (Moussallam et al. 2018) eruptions. Even if they do not 665
necessarily lead to edifice destruction (e.g., 1888 Bandai eruption, Yamamoto et al. 1999), 666
phreatic events can vaporize and expel water in shallow aquifers, unloading the upper crust 667
hence changing the stress field around, and the magmatic pressure within, a magma reservoir 668
(Pinel and Jaupart 2005). As such, phreatic events can act as trigger or facilitate magmatic 669
eruptions. Given the delay observed between the phreatic eruptions (6 September 2017) and 670
magma arrival at the surface (22 September 2017), it is conceivable that the phreatic 671
eruptions played a role in favouring the magmatic ones, although it is likely that the phreatic 672
eruptions themselves were driven by magmatic gases given the large quantities of SO2 they
673
released (Bani et al., in prep.). 674
675
Bulk rocks, matrix glasses and melt inclusions from phase one are compositionally more 676
evolved than those of phase two and three (Fig. 5 and 6). Melt inclusions from phase two and 677
three have higher Mg#, MgO, CaO content, lower Si and Al content and tend to be hosted in 678
more forsteritic olivine (Fig. 6). An overlap in composition exist however between the three 679
phases such that phase two and three, whilst dominated by more primitive melt inclusions, do 680
also contain inclusions that have similar compositions as the ones from phase one. Normal 681
zoning of olivine and pyroxene phenocrysts is most commonly observed in the early and late 682
phases of the eruption, yet reverse zoning is common also shown by a number of crystals, 683
particularly in phase 2 and 3 (Fig. 2, 3 and 10). The observed compositional continuity (as 684
opposed to a bimodal distribution) shown by the melt inclusions, from primitive to evolved 685
end members (Fig. 5,6) suggest a simple magmatic evolution with all erupted melts related by 686
simple liquid line of descent from the same primitive parental magma (potentially similar to 687
the 8 to 14 wt.% MgO melts described by Sorbadère et al. 2011) (Fig. 6). Trace element 688
variation diagrams from melt inclusions and matrix glasses (Fig. 7) show a strong linear 689
correlation between Rb, Th and K2O (highly incompatible elements) that points towards the
690
origin as expected for melts related by fractional crystallisation. This again suggests that all 691
melt inclusion compositions (including from older lavas) are consistent with simple fractional 692
crystallisation evolution from a single parental magma. 693
694
Some trace element systematic do hint at mixing processes having taken place. A strong 695
linear correlation is evident between La and Rb (Fig. 7C) but a regression through the data 696
does not pass through the origin potentially indicative of mixing between two components 697
(e.g., Schiano et al. 2010). Plots of Rb/Nd versus Rb and Th/Nd vs Th (Fig. 7E and F) define 698
trends that are not well described by linear relationships suggesting again mixing between 699
two components. On these diagrams, simple fractional crystallisation would result in no 700
variations in Rb/Nd and Th/Nd as a function of Rb and Th concentrations respectively (e.g., 701
Schiano et al. 2010). In addition, the fact that numerous olivine crystals exhibit reverse 702
zoning and the bi-modal distribution observed in olivine forsterite content with a significant 703
proportion of phase 2 and 3 olivine recording core Fo content higher in magnesium than 704
expected for equilibrium with the bulk rock (Fig. 4), both suggest that some of the olivine are 705
antecrystic and that some amount of mixing has taken place. 706
707
Diffusion timescales from olivine zoning show multiple recharge events occurring a few days 708
to a year prior to the 2017-2018 eruption (exact timescale depending on initial conditions). It 709
is possible therefore that the latest recharge event played a role in triggering (via magmatic 710
gas release) the initial phreatic and subsequent magmatic activity as the timing (a few days 711
before phase 1 eruption) is consistent with the onset of phreatic and seismic activity. 712
713
Based on all these observations we suggest that: 714
1. The Ambae plumbing system was periodically recharged by co-genetic magmatic 715
batches in the days to year prior to eruption. 716
2. The initial phreatic activity, propelled by magmatic gases, likely opened a pathway or 717
modified the local stress field allowing pressurized magma to travel to the surface. 718
3. The eruption first taped into the most evolved magma chamber(s) erupting phase one 719
magma. As the eruption progresses from phase one to four, the most evolved 720
chamber(s) got progressively exhausted opening the way to more primitive (and yet 721
not necessarily deeper) magma from other chambers. 722
4. During or prior to the eruption some small amount of mixing between co-genetic 723
magmas from different chambers occurred. 724
725
Magma ascent rate
726
Modelling of volatile diffusion profiles in melt embayments suggest magma decompression 727
rates in the order of 0.24 to 0.55 MPa/s, corresponding to ascent rates of 9 to 21 m/s (33 to 75 728
km/h) while calculated decompression rates based on microlite number densities are in the 729
order 0.11 to 0.16 MPa/s corresponding to ascent rates of 4 to 6 m/s (15 to 23 km/h). 730
Considering that the two methods are entirely independent their broad agreement is worth 731
highlighting and brings confidence in the determined values. Given a shallow magma 732
chamber at 0.5 to 3 km depth, it must hence have taken 24 to 122 seconds for the magma to 733
travel from the top of the magma chamber to the surface. The decompression and ascent rates 734
we calculate are comparable to other volcanoes using the same embayment volatile diffusion 735
modelling method. Liu et al., (2007) investigated the 26.5 ka phreatomagmatic Oruanui 736
eruption of Taupo (New Zealand) and found a decompression rate of 0.001 to 0.007 MPa/s. 737
Myers et al., (2018) investigated the 25.4 ka Oruanui eruption of Taupo, 0.767 Ma Bishop 738
Tuff and 2.08 Ma Huckleberry Tuff and found decompression rates in the order of 10-3 to 10-1 739
MPa/s. Humphreys et al., (2008) found decompression rates of 0.9-1.6 MPa/s for the 1980 740
Plinian eruption of Mount St Helens, (Washington, USA). Lloyd et al., (2014) found 741
decompression rate of 0.3 to 0.5 MPa/s for the basaltic andesite sub-Plinian eruption of 742
Volcán de Fuego (Guatemala) while Ferguson et al., (2016) found decompression rates 743
between 0.05 and 0.45 MPa/s during fire fountain to sub-Plinian basaltic eruptions at Kīlauea 744
volcano (Hawaii, USA). Figure 13 shows a compilation of currently available magmatic 745
decompression rate estimated using the embayment volatile diffusion method and compares it 746
to eruption magnitude. For basaltic eruptions a trend seems to emerge of increasing 747
decompression rate (i.e. ascent rate) with increasing eruption magnitude. The trend however 748
does not extend to more silicic and higher magnitude eruptions with the largest, ultraplinian, 749
eruptions yielding comparatively slow decompression rates. 750 751 752 753 754
![Figure 3: Rim to core electron microprobe %Fo (mol%) (= 100 × Mg/ [Fe + Mg]), Ca, Mn, 364](https://thumb-eu.123doks.com/thumbv2/123doknet/13621227.425593/19.892.111.781.100.926/figure-rim-core-electron-microprobe-fo-mol-mg.webp)