HAL Id: hal-00153563
https://hal.archives-ouvertes.fr/hal-00153563
Submitted on 23 Jul 2007HAL is a multi-disciplinary open access archive for the deposit and dissemination of sci-entific research documents, whether they are pub-lished or not. The documents may come from teaching and research institutions in France or abroad, or from public or private research centers.
L’archive ouverte pluridisciplinaire HAL, est destinée au dépôt et à la diffusion de documents scientifiques de niveau recherche, publiés ou non, émanant des établissements d’enseignement et de recherche français ou étrangers, des laboratoires publics ou privés.
Mortality and recruitment in a lowland tropical rain
forest of French Guiana: effects of soil type and species
guild
Cécile Madelaine, Raphaël Pelissier, Grégoire Vincent, Jean-François Molino,
Daniel Sabatier, Marie-Françoise Prévost, C. de Namur
To cite this version:
Cécile Madelaine, Raphaël Pelissier, Grégoire Vincent, Jean-François Molino, Daniel Sabatier, et al.. Mortality and recruitment in a lowland tropical rain forest of French Guiana: effects of soil type and species guild. Journal of Tropical Ecology, Cambridge University Press (CUP), 2007, 23 (3), pp.277-287. �10.1017/S0266467406003944�. �hal-00153563�
• Title:
Mortality and recruitment in a lowland tropical rain forest of French Guiana: effects of soil type and species guild • Running head:
Tree mortality and recruitment in French Guiana • Authors:
C. Madelaine, R. Pélissier*, G. Vincent, J.-F. Molino, D. Sabatier, M.-F. Prévost, C. de Namur1 • Authors’ affiliation:
IRD, UMR AMAP, Montpellier, F-34000 France
• Note (dates of birth and death of C. de Namur):
1 1949-2005 • Corresponding author: • R. Pélissier
UMR AMAP
TA40/PS2
34398 Montpellier cedex 05 Tel +33 (0)4 67 61 75 23 Fax +33 (0)4 67 61 56 68 E-mailRaphael.Pelissier@mpl.ird.fr
Abstract:A variety of processes have been identified as playing a key role in maintenance of hyper-rich tropical forest, among which ecological sorting caused by niche partitioning challenges stochastic dispersal processes. However, demographic responses to spatio-temporal resource variation
that could result in biased species distributions are still little studied. In this paper we investigate from two censuses, ca. 15 y apart, of a 12-ha permanent forest sample in French Guiana, how tree recruitment and mortality rates vary among hydrological soil types known to affect species habitat preferences and among ecological guilds related to species light requirement. The results indicate that both recruitment and mortality vary significantly with respect to these factors. While the mean instantaneous mortality and recruitment rates are estimated to 0.98 and 0.81%,
respectively, pioneer species, canopy trees and hydromorphic bottomland soils depart significantly from these values. In particular, the pioneers, regenerating either from the soil seed bank or from post-opening seed rain, show faster dynamics than other species. These two guilds harbour probabilities of mortality elevated by a factor of 1.9 and 3.2, respectively, and probabilities of recruitment elevated by a factor of 4.9 and 3.1, respectively. Conversely, canopy trees show slower dynamics, with probabilities of mortality and recruitment lowered by a mean factor of about 0.5 with respect to other species. We also observe that trees growing in hydromorphic bottomlands prove to have significantly higher mortality and recruitment probabilities, by a factor of about 2 with respect to those growing in terra firme.
INTRODUCTION
It is now a truism to say that the tropical rain forest is one of the most diverse terrestrial ecosystems of the world. But how such high species diversity is maintained over space and time within natural communities remains an open question. Among the key processes is niche
differentiation (Grubb 1977) by which species coexistence is favoured through specific functional requirements allowing spatial and temporal resource partitioning, and which limits interspecific competition.
Many empirical studies have demonstrated light or soil habitat preferences of tropical rain-forest tree species (Ashton & Hall 1992, Tuomisto et
al. 2003), and notably in French Guiana (Couteron et al. 2003, Molino & Sabatier 2001, Pélissier et al. 2002, Sabatier et al. 1997). These works
indirectly contradict the species equivalence hypothesis, which postulate the same probability to die or to reproduce everywhere for all individuals within and across species (Hubbell 2001). Furthermore, recent studies report direct evidences for the existence of significant demographic differences between species (Chave 2004, Condit et al. 2006). However, relationships between demographic traits and
environmental factors have been poorly documented. Condit et al. (1995) did not find significantly higher mortality rates for groups of species that specialized on the moister soils on Barro Colorado Island, Panama, while both Potts (2003) and Russo et al. (2005) reported higher mortality rates on sandy soils in a Bornean rain forest. In French Guiana, van der Meer (1995) noticed that treefalls seemed likely related to shallow soils at Les Nouragues, a pattern also acknowledged by other studies in Africa (Jans et al. 1993) and Central America (Brokaw 1985), and often related to soil instability.
Our aim in this paper is therefore to test for the existence of major factors of demographic variation in the tropical rain forest at Piste de St Elie in French Guiana. We investigated from two censuses, ca. 15 y apart, of a 12-ha permanent forest sample, how tree recruitment and mortality rates vary among soil types and ecological guilds related to particular light microhabitats. Hydrological soil constraints have indeed been demonstrated to be the major determinants of local species habitat preferences in French Guiana (Sabatier et al. 1997). In particular, soil hydromorphy, whether prolonged in water-saturated bottomlands or transient during the rainy season because of the formation of a perched-water table in upland
transformed soil systems, appeared to limit niche breadth of many tree species (Pélissier et al. 2002). Because sample sizes were prohibitively low for comparing demographic traits among soil types for individual species, we considered ecological guilds based on more functionally based species grouping than simply taxonomically based grouping in genera or family.
MATERIALS AND METHODS
Study site and data
Site description. The study site is an undisturbed lowland tropical rain forest on metamorphic bedrock (schist) located at station Piste de St-Elie
(PSE; 5°18’N, 53°30’W) in northern French Guiana. Climate of the region is of humid tropical type with annual rainfall ranging from 2500 to 4000 mm, a marked dry season between August and November, and a short drier period in March (Barret 2001). At the site, elevation ranged
between 10 and 50 m above mean sea level. The forest stand is characterised by high species diversity: about 170 species out of 625 trees ha-1 with diameter at breast height (dbh) ≥10 cm on average. It is dominated by Lecythidaceae, Caesalpiniaceae and Chrysobalanaceae, which
represent respectively 24.5, 12.7 and 6.6% of the total number of trees more than 10 cm dbh. Details of the floristic composition of this forest can be found in Sabatier et al. (1997).
Sampling design and tree censuses. The sampling design is composed of 12 ha of permanent plots established between 1986 and 1991: transect
B (100 × 1000 m) and plots R and P (100 × 100 m), ca. 600 m away from the transect (Sabatier et al. 1997). In these plots, 7287 trees with a dbh ≥10 cm were tagged, mapped within 10 × 10-m subplots and botanically identified. The trees were measured in girth at 1.30 m or above the buttresses if any, with a precision of 0.1 cm using a stainless steel flexible tape.
A complete re-census of the plots was carried out between October and November 2003, except a 1-ha catena inside transect B, which was surveyed in two stages in November 2002 and February 2003 within the framework of a complementary study. At the second census, dead trees were recorded, while new recruits (i.e. untagged stems larger than 10 cm dbh) were tagged, mapped and identified. A total of 7098 trees ≥10 cm dbh was recorded at the second census using the same measurement protocol than at first inventory. However, as both the first and second census dates vary among subplots, the time elapsed between inventories for an individual stem ranged from 12.3 to 17.7 y.
Soil data. A complete map of the soil characteristics with a resolution of 5 × 5 m is available for all the sampling plots. It is based on six soil
classes featuring the main hydrological constraints that have been demonstrated to be the major determinants of local species habitat preferences in French Guiana (Pélissier et al. 2002, Sabatier et al. 1997). For the sake of homogeneity with previous publications we will sometimes refer to the soil nomenclature as in Sabatier et al. (1997), through the codes given below in parentheses. One class corresponds to soils experiencing prolonged periods of surface water saturation in the bottomlands (SH), that we will more generally call the bottomland soils as opposed to upland terra firme soil types. Among these latter, three classes characterize the weathering process along topographical catenas, from the initial ferralitic cover with a deep vertical drainage (DVD) at hilltop, to thinner weathered soils on upper slopes (Alt), and to soils mainly experiencing superficial lateral drainage in bottom slopes (SLD). We will generally refer to these three soil classes as the weathered soils. The two last classes correspond to ultimately weathered soil types representing the first stages of a podzolisation process, which develop either uphill (UhS) owing to the
appearance of a transient perched water table during the rainy season, or downhill (DhS) thanks to upward percolation of water from the hydromorphic bottomlands towards the bottom slopes. We will refer to theses last two classes as the transformed soils in the following. More details of the soil categorization can be found in Sabatier et al. (1997), as well as maps showing that the soil types were distributed as repeated small-sized patches intimately intermingled at plot scale, and rarely exceeding 0.25 ha, except the initial ferralitic soil patches, which can reach 1 ha in size.
Species guilds. A species identification (either named or morphospecies) could be assigned to 97.9% of the trees. Among the 493 species
identified during inventories, 416 were represented by less than 20 individuals. In most cases the number of observations per soil class was therefore insufficient to estimate mortality and recruitment rates for individual species to any useful level of precision. Hence, we grouped species into ecological guilds according to their preferences for particular light microhabitats, and we estimated demographic traits on those groups. We first created three shade-tolerant species groups based on Favrichon (1994), who analysed the survival and growth performances, dissemination features and light requirements of 122 tree species of French Guiana. We accordingly distinguished a group of shade-tolerant understorey species (group 1 of Favrichon; 19 species in our dataset), to which we will refer to as understorey species; a group of shade-tolerant canopy species (group 2 of Favrichon; 29 species); a group of semi-tolerant canopy species (group 3 of Favrichon; 14 species), which require, like Dicorynia guianensis, more light for germination in the understorey and grow faster to the canopy than strict shade-tolerant species. We will generally refer to these two last groups as canopy species in the following. The remaining light-demanding species were split into three different
guilds according to Molino & Sabatier (2001), who proposed from an intensive survey of the literature, a classification of 104 tree species of French Guiana into: pioneer species regenerating in canopy gaps from post-opening seed rain (P in Molino & Sabatier; 18 species in our dataset); pioneer species regenerating from the soil seed bank, mostly in large canopy gaps (SB in Molino & Sabatier; 23 species); and non-pioneer
heliophilic species (H in Molino & Sabatier; 30 species), which are, like Tachigali melonii or Pourouma spp., sun-loving species at all development stages, but are not strictly gap-colonizers. We will refer to this last group in the following as heliophilic species, as opposed to pioneer species for the two former. The remaining 362 species for which we did not find any reference for inclusion in one of the above guilds, and all individuals not identified to species level, were grouped into an undetermined category representing ca. 60% of the total tree population. In so doing we hoped keeping the guilds as homogeneous as possible, to the detriment of the undetermined category, which had no obvious ecological sense. This latter was yet maintained to avoid biasing overall mean mortality or recruitment rates that serve as references in statistical analyses (see below).
Statistical analyses
Mortality and recruitment models. Let No be the number of trees at initial inventory, Nm and Nr the number of trees that died or were recruited
after a ∆t-y period, so that Ns =No−Nm is the number of survivors and Nf = No − Nm + Nr the number of trees at final inventory. Assuming
birth and death are continuous and constant processes over time, mortality and recruitment rates are usually derived according to exponential models (Condit et al. 1995, Nebel et al. 2001, Phillips et al. 1994, Sheil et al. 1995): λ= ln[No/Ns]/Δt and μ= ln[Nf /Ns]/Δt are the
instantaneous mortality and recruitment rates per unit of population, respectively. Accordingly, annual mortality and recruitment rates are given by m= 1− exp(−λ) and r= 1− exp(−μ), respectively (Sheil et al. 1995). When the return intervals between first and second censuses vary among trees (12.3 to 17.7 y in our data), is generally taken as the weighted average time interval (Condit et al. 1995), 15.15 y in our case. However, Kubo et al. (2000) demonstrated that the so-called average duration estimates, that we will note t
Δ
especially with low population size and high demographic rates. They instead proposed a maximum likelihood estimate of instantaneous mortality rate when intervals between censuses vary between trees. It consists in solving d ln L(
[
λ)]
/dλ= 0, i.e. to find λ that maximizes, the product of the probabilities that tree i remained alive during t L(λ)= exp(−λti i=1 Ns
∏
) [1− exp(−λtj)] j=1 Nm∏
i and that tree j died during tj. Whenthe time interval between censuses is the same for all the trees, maximum likelihood estimate of instantaneous mortality rate, which we will note λMLE in the following, is identical to λADE. A Maximum likelihood estimate of instantaneous recruitment rate (μMLE) is similarly obtained. In order to assess significance on mortality and recruitment estimates of the variable census intervals in our data, we systematically compared the results obtained with the two methods. We also computed standard errors and confidence intervals of estimations by means of 1000 ordinary bootstrap resamplings (Davison & Hinkley 1997).
Logistic regressions. To assess the effects of soil types and species groups on mortality and recruitment, we used logistic regression models.
This means that the probabilities of mortality (pm) and recruitment (pr) over the period of observation were specified through a general model of
the form exp[ f (gsp,soil)]/(1+ exp[ f (gsp,soil)]), strictly bounded between 0 and 1, where f(gsp,soil) is a linear function of species groups (gsp) and soil types (soil) dummy variables (Sokal & Rohlf 1995). However, the logistic model assumes that all individuals have been observed during the same period, so that pm and pr can be expressed, through the exponential models of the previous section, as average duration estimates
of instantaneous rates: λADE = ln[1/(1− pm)]/Δt and μADE = ln 1/(1− p
[
r)]
/Δt .In order to take into account the variable return intervals in our data, we also fitted logistic models to virtual data simulated from maximum likelihood estimates. From the total number of observed individuals within the soil by guilds crossed categories at initial (final) inventory, we marked as dead (recruited) λMLEΔt (μMLEΔt ) trees over a mean period of tΔ = 15.15 y. We thus obtained a virtual dataset with the same number of individuals in each crossed category as in the original one, but with a number of dead and recruited trees corrected for non-constant census intervals. Unfortunately, such a simulation procedure cannot retain information associated to individual trees, i.e. tree dbh and location. In this paper, we will call MADE and RADE the logistic mortality and recruitment models fitted to the observed (i.e. uncorrected) data, thus assuming an
average duration of 15.15 y, and MMLE and RMLE, the logistic models estimated from the virtual dataset, corrected for variable return intervals
using maximum likelihood estimates.
All logistic models were fitted thanks to the glm() function in R statistical package (http://cran.r-project.org). Goodness of fit as well as effects of soil type and/or species guild were tested using an analysis of deviance, i.e. an equivalent for logistic models to the analysis of variance for linear models (Crawley 2004). We started each analysis from the maximal model including both explanatory variables and their interaction term, and simplified it in a standard way: starting from the highest-order interaction term and controlling lowering of Akaike Information Criterion (AIC), we first removed from the maximal model, all non-significant terms, i.e. with P ≥ 0.05; we then merged step by step the soil classes on the one hand and the species guilds on the other that did not differ significantly from each other, until the adequate minimal model contained as many terms at a 1% significance level as possible (Crawley 2004). Systematic non-normality of residuals in logistic regression is a difficulty for model
checking that we overcame by using randomized quantile residuals (Dunn & Smyth 1996) computed with the qresiduals() function of statmod
1.2-4 library for R statistical package.
Toroidal tests of statistical significance. A common assumption required by the parametric tests of statistical significance used in logistic
regression, is the hypothesis of independence between observations. Many ecological studies are likely to violate this assumption because of spatial autocorrelation, a fact that could place undue statistical significance on spatially structured explanatory variables (Legendre 1993, Legendre & Fortin 1989). The problem is particularly critical with our data, since mortality and recruitment are both prone to clumping due to gap dynamics (Nebel et al. 2001, van der Meer & Bongers 1996). We therefore implemented a random toroidal shift procedure (Harms et al. 2001, Purves & Law 2002) to test for spatial independence between mortality (or recruitment) and soil patches. It is based on random translations of the whole tree map, including dead, recruited and surviving individuals, in x and y co-ordinates on a torus, with a precision of 5 m
corresponding to the resolution of the soil map. We simulated in this way 1000 spatially randomized datasets in which the intrinsic spatial patterns of both the trees and the soils were maintained, while only the spatial dependence between the two patterns was altered (see Clifford et
al. 1989). For each of the spatially randomized datasets, we then fitted the logistic mortality and recruitment models (MADE and RADE only,
because the location of trees was lost in the virtual dataset used to fit MMLE and RMLE). As the random toroidal shift procedure implies some
variation in the total number of trees per soil class across simulations, we built statistical tests of significance of model parameters in a way analogous to parametric bootstrap (Davison & Hinkley 1997): for each parameter, the P-value of the null hypothesis of no soil effect is given by the proportion of randomized datasets for which the Wald z-value exceeds the one estimated from the observed data. Because of the spatial configuration of our sample, this test was only applied to the 10-ha transect B, ignoring the two 1-ha plots.
Spatial analyses. Spatial structure analyses were conducted from tree map of transect B using functions related to Ripley’s K-function and
based on all inter-tree distances. We provided here only the broad outlines of the method, when detailed presentations were available elsewhere. For studying the spatial pattern of surviving, dead and recruited trees, we used an implementation of the linearized Ripley’s K-function proposed by Goreaud & Pélissier (1999). L(r)= K(r)/π − r is a function of the mean number of neighbours in circles of radius r centred on each point of the pattern (assumed stationary and isotropic; Ripley 1981). L® has a theoretical expectation of 0 for all r under the null hypothesis of complete spatial randomness, but a 1% confidence interval accounting for stochastic variations around this theoretical value were obtained by 1000 Monte Carlo simulations of a Poisson process (Ripley 1981). It follows that values of L® above the upper bound of the confidence interval indicate significant clustering at distance r, while values below the lower bound of the confidence interval indicate significant regularity at distance r. For studying the spatial interaction between dead and recruited trees, we used an implementation proposed by Goreaud & Pélissier (2003) for the linearized intertype K12-function of Lotwick & Silverman (1982), a bivariate extension of Ripley’s K-function, which characterizes the spatial
relationship between two types of points located in the same study area. L12(r)= K12(r) /π − r is a function of the mean number of neighbours of type 2 (the recruited trees) in circles of radius r centred on each point of type 1 (the dead trees) of the pattern (assumed stationary and
isotropic; Lotwick & Silverman 1982). Under the null hypothesis of population independence, L12® has a theoretical expectation of 0, but a 1%
confidence interval accounting for stochastic variation around this theoretical value were obtained by 1000 random toroidal shifts of dead trees relatively to recruited ones, keeping both marginal patterns unchanged (see Goreaud & Pélissier 2003 for more details). Accordingly, values of
L12® above the upper bound of the confidence interval indicate significant attraction of dead and recruited trees at a distance r, while values
below the lower bound of the confidence interval indicate significant repulsion at a distance r.
We used another extension of Ripley’s K-function, called the Km-function (Kcor-function in Goreaud 2000, Oddou-Muratorio et al. 2004), for analyzing the spatial structure of the quantile residuals of the logistic models. As this function is less usual than L® and L12®, we give here some
details about its implementation. Km® measures the mean correlation between the values of a quantitative variable borne by two arbitrary trees of the pattern located at distance r:
ij i j j i r m X X X X k N X ar V r K = × 1
∑∑
( − )×( − )× ) ( ˆ 1 ) ( ˆwhere X is a quantitative random variable measured over the Nr individuals within a distance r. Parameter is a local correcting factor of edge
effects, also used in L® and L
ij k
j which is inside the study area (see Goreaud & Pélissier 1999 for more details). Km® has a very similar interpretation to more classical
correlation functions: it has a theoretical expectation of 0 for all r under the null hypothesis of no spatial correlation between values of the quantitative variable, X, ranges between 0 and 1 when values of X at distance r are positively correlated and ranges between 0 and –1 when they are negatively correlated. To account for stochastic variations around the theoretical value of 0 under the null hypothesis of no correlation, a 1% confidence interval was obtained by 1000 random reallocations of the values of X over all trees of the pattern, which is kept unchanged. It follows that values of Km® above the upper bound of the confidence interval indicate a significant positive correlation at a distance r, while
values below the lower bound of the confidence interval indicate significant negative correlation at a distance r.
All spatial analyses were performed by means of the ads 1.2-2 library for R statistical package, freely available at http://ads2r.free.fr/. All functions incorporate an unbiased correcting factor of edge effects, but as transect B is a rectangular plot of 100 × 1000 m, we restricted the analyses to distances less than 100 m in order to limit leverage of the corrections.
RESULTS
Mortality
We assessed significance of the variable return intervals between censuses on mortality rate estimates by means of the unsigned relative deviation of λADE from λMLE, i.e. 100⋅ λADE−λMLE/λMLE, in the 42 soil by guild crossed categories. This deviation, relatively low on average (3.3%), was greater than 5% in 11 crossed categories and greater than 10% in one (maximum of 11.6%). Such important differences between results of the two methods justified trying to account for the variable return intervals in further analyses. We thus assessed the effects of the soil and guild variables on mortality by fitting two separate logistic models, one to the observed data (MADE), and one to the virtual data corrected for
unequal return intervals using λMLE (MMLE).
After the two models have been independently simplified, we obtained very similar minimal adequate mortality models (Tab. 1) with highly statistically significant additive effects of a soil variable with two categories, bottomland and terra firme soil types, and of a species guild variable with five groups, the two groups of pioneer species, the two groups of canopy species, and a last group comprising of the understorey, heliophilic and unclassified species. A posteriori comparisons of unsigned relative deviation of λADE from λMLE in the 10 simplified crossed
categories did not exceed 4.2%, which indicated that the bias introduced when using a mean time interval was lowered by merging the non-significant soil types and species guilds. We thus only retained MADE for further analyses.
The spatial structure of dead trees, as revealed by Ripley’s L-function, exhibited a significant aggregated pattern up to ca. 50 m (Figure 1a), i.e. a local autocorrelation of the response variable of our model, which is an obvious case of violation of the assumption of independence between observations. We thus checked using a random toroidal shift procedure that the statistically significant effect of the hydromorphic bottomland soils in our model was not an artefact caused by the intrinsic clumping pattern of mortality (P < 0.001 based on 1000 random toroidal
simulations). • insert Figure 1
We finally added to our mortality model an extra variable accounting for potential variation across diameter classes. The best model was
obtained with a second-order polynomial of the log-transformed tree diameter (because of left-skewed frequency distribution), which modelled a higher probability of mortality for small and large diameters. A summary of this final model, which lowered significantly the residual deviance of the former (Chi-square test, P < 0.001), is given in Table 2.
• insert Table 2
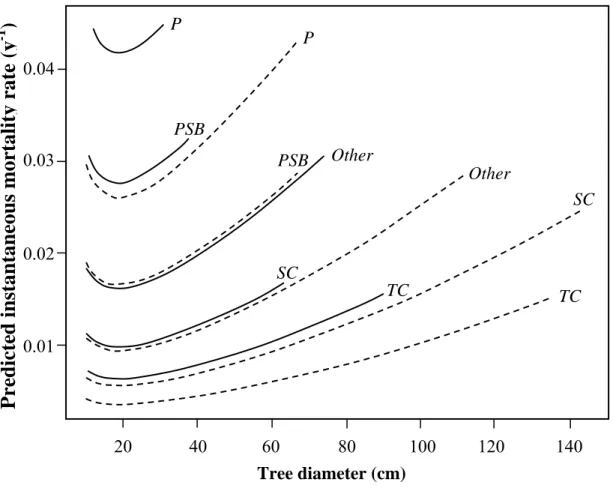
It predicted (Figure 2): (1) whatever the species and soil, a general decrease of mortality with diameter in small size classes, followed by a constant increase with diameter beyond ca. 20 cm dbh; (2) whatever the species, an increase in mortality by a factor of 1.6 in bottomlands with respect to terra firme; (3) whatever the soil, an increase in mortality by a factor of 1.87 to 3.18 for pioneer species, and a decrease by a factor of 0.35 to 0.57 for canopy species with respect to other species.
• insert Figure 2
However, the examination of the spatial structure of the quantile residuals of our final mortality model with the Km-function, revealed a
significant positive autocorrelation for distances up to 40 m (Figure 1c), i.e. for scales corresponding to significant clusters of dead trees (Figure 1a). This means that our model largely failed to include the locally aggregated pattern of natural mortality. Examining the distribution of the quantile residuals against tree dbh revealed a lack of fit of the model for the small-sized trees (not shown), which probably reflects heterogeneity of the group of the remaining species mixing old trees of understorey species prone to higher mortality with younger trees of upper-strata species. While no critical pattern was revealed by the distribution of the quantile residuals with respect to soil types or species groups, some particular combinations showed significant deviations (not shown). Indeed, for all small-sized crossed categories (less than 40 individuals at initial
4.44, 2.87, 1.08 and 0.80% for the two pioneer and the two canopy groups in the bottomlands, against 7.25, 3.88, 1.28 and 0.88% directly computed from average duration estimates (λADE). For the other crossed categories, the relative deviation of predictions from average duration estimates did not exceed 7%.
Recruitment
The mean unsigned relative deviation of μADE from μMLE accounting for variable census intervals in the 42 soil by guild crossed categories was
4.2%, while thirteen combinations exhibited a deviation higher than 5% and one higher than 10% (maximum of 19.5%). Because of these important differences, we fitted two separate logistic recruitment models, one to the (uncorrected) observed data (RADE) and one to the virtual
data corrected for unequal return intervals and simulated from μMLE (RMLE). However, after the non-significant interaction term (P ≥ 0.05) was
removed from both models, RADE and RMLE revealed highly statistically significant additive effects of a soil variable with three categories, and a
species guild variable with four species groups (Table 1): the hydromorphic bottomland soils, the uphill transformed soils (Uhs) and the other terra firme soil types (the weathered soils and the downhill transformed soils merged in a single category); the two pioneer species groups, a canopy species group comprising the shade-tolerant and semi-tolerant species, and a last species group with the understorey, heliophilic and unclassified species merged in a single category. Besides, all unsigned relative deviations of μADE from μMLE in the 12 remaining crossed
categories were lower than 5%. We thus only retained RADE for further analyses.
The spatial structure of recruited trees analyzed with Ripley’s L-function, showed a statistically significant aggregated pattern up to 80 m (Figure 1b). Because of this autocorrelation of the response variable of the model, we tested both soil effects thanks to a random toroidal shift procedure. This confirmed statistical significance of the bottomland soils (P < 0.001), but invalidated the one of the uphill transformed soils (P = 0.035). We thus merged the latter with the other terra firme soil types. The minimal adequate recruitment model thereby obtained, predicted (Table 3): (1) whatever the species, an increase in recruitment by a factor of 1.75 in bottomlands with respect to terra firme; (2) whatever the soil, an increase by a factor of 3.14 to 4.98 for pioneer species, and a decrease by a factor of 0.48 for canopy species with respect to other species.
• insert Table 3
Checking the spatial structure of the quantile residuals of our recruitment model showed a positive autocorrelation from 10 to 20 m (Figure 1d), which indicated that, not surprisingly, our model failed to explain completely the clumped spatial structure of recruitment. The distribution of the quantile residuals with respect to the soil by guild crossed categories (not shown) showed a lack of fit of the model in the heterogeneous groups of the canopy and remaining species in terra firme. Pioneer species regenerating from seed rain exhibited a significant deviation of residuals in both hydromorphic bottomlands and terra firme: when compared to direct average duration estimates (λADE= 8.58 and 1.89%, respectively), instantaneous recruitment rates predicted by the model were underestimated in bottomlands (3.60%) and overestimated in terra firme (2.28%). In the other crossed categories, the relative unsigned deviation between predictions and average duration estimates did not exceed 10%.
Demographic changes
Following Phillips et al. (1994), we computed the average of mortality and recruitment rates as an estimate of stand turnover rate. Pioneer species regenerating from seed rain showed a significantly higher turnover rate than other species at PSE, particularly in bottomlands, where they would be half-renewed in less than 10 y ( 2Ln(2) /(λADE+μADE)). Conversely, canopy species had a significantly lower turnover rate than other species, particularly in terra firme, where they would be half-renewed in about 150 y. Note that computation of turnover rate as proposed by Phillips et al. (1994) assumes that the population is close to steady state, i.e. mortality and recruitment compensate each other, so that averaging will simply dampen inaccuracy of both estimations. In the present case the population annual mortality rate was significantly higher than the whole-population annual recruitment rate (λADE = 0.98 vs. μADE = 0.81% with non-overlapping 99% confidence intervals computed from 1000 bootstrap
resamplings): the total number of trees decreased by 0.17% y-1 on average during the period of observation. Table 4 details the demographic
changes for all significant soil by guild crossed categories. • insert Table 4
Demographic rates of change in these categories ranged from +1.57 to -0.70%. However, only pioneer species regenerating from the soil seed bank increased significantly (P < 0.01), while the shade-tolerant canopy species and the other species decreased significantly (P < 0.001) in terra firme, this latter group decreasing also significantly in hydromorphic bottomland soils (P < 0.05). The remaining species groups being almost at equilibrium, the forest stand under study seemed in a phase of decrease in the number of shade-tolerant canopy trees and increase in the number of pioneer trees of the soil seed bank, particularly in terra firme.
On another hand, the spatial pattern of interaction between dead and recruited trees as revealed by the L12-function (Figure 3) indicated that the
two processes were spatially dependent, probably due to the joint effect of soils and treefall gaps.
DISCUSSION
The present analysis of tree demography between two censuses, ca. 15 y apart, in 12 ha of natural rain forest in French Guiana, provides evidence that recruitment and mortality rates vary among species guilds and soil types. These results contradict the species equivalence and environmental homogeneity assumptions behind the neutral theory of biodiversity, and hence question the prominence of dispersal limitation processes in short-term forest dynamics.
In particular, pioneer species, regenerating either from post-opening seed rain or from the soil seed bank, showed significantly higher mortality and recruitment rates (i.e. faster dynamics) when compared to other species, while canopy species, either shade-tolerant or semi-tolerant, showed significantly lower mortality and recruitment rates (slower dynamics). These results partly corroborate the results obtained by Condit et al. (1995) at Barro Colorado Island and showing a mortality rate of colonizers two to three times higher than that of non-colonizers. They are moreover in line with the largely disseminated idea that short life span of pioneers vs. long life span of canopy species are, with correlated traits
like growth rates, wood density, etc., species-specific adaptations to light microhabitats (Clark & Clark 1992, Manokaran & Kochummen 1987, Swaine et al. 1987).
We also demonstrated that both mortality and recruitment rates varied significantly according to soil type. Trees growing in hydromorphic bottomlands proved to have a significantly faster dynamics (higher mortality and recruitment rates) than those growing in terra firme.
Interestingly, both mortality and recruitment logistic models indicated that the soils and the species guilds had independent additive effects. Even though it cannot be ruled out that this lack of interaction merely reflects insufficient power of the experimental design (with too few individuals in some species group), it suggests that the turnover rate was accelerated in the bottomlands in a similar fashion for all groups of species. Unfavourable environmental conditions, like prolonged periods of anoxia due to water logging, are expected to lower performances, including survival, of non-specialist species, thus inducing biased distributions of abundances — the ecological sorting hypothesis (Grubb 1977, Russo et
al. 2005). Hence the observed higher turnover rates in bottomlands may be a consequence of different species composition (with intrinsically
different turnover rates) as well as a consequence of higher mortality rates, affecting all, non-specialist, species under harsher environmental conditions. It is unlikely that species composition alone is responsible for the observed differences in turnover rates at PSE. To confirm the direct effect of soil on turnover rates we selected among the most abundant species, two species, Eperua falcata and Lecythis persistens, which showed no strong preference with either the bottomlands or terra firme (Chi-square: P ≥ 0.05) and have moreover very similar distributional patterns across soil types (Chi-square: P = 0.7). These two species, with respectively 462 and 372 individuals, and representing together ca. 10% of the total population, showed mortality and recruitment rates twice as high in bottomlands than in terra firme. Such difference was found to be
statistically significant for both species pooled together (Pearson Chi-square tests: P < 0.05). Moreover, when species exclusively associated with either the bottomlands or terra firme were both excluded, the instantaneous mortality rate of non-specialist species remained significantly higher in bottomlands than in terra firme: λADE = 1.7 vs. 0.88% with non-overlapping 99% confidence intervals from 1000 bootstrap resamplings. This
highly significant difference holds also for instantaneous recruitment rates (μADE = 1.1% in bottomlands vs. 0.76% in terra firme), so that an
increased mortality, and in particular more frequent treefall gaps, would lead to more recruitment opportunities and thus an accelerated turnover in hydromorphic bottomland soils. These results complement those obtained at Barro Colarado Island by Condit et al. (1995), who did not find clear mortality pattern with respect to soil moisture.
However, a direct mechanical effect of water saturation, which increases tree susceptibility to uprooting is likely to affect treefall intensity in a predominantly non-species-specific way and is a possible cause of mortality increase in bottomlands. This hypothesis is supported by several reports (Durrieu de Madron 1993, van der Meer 1995) citing soil instability as an important factor affecting treefalls in French Guiana. A
posteriori determination of what caused tree death is difficult; however we did observe uprooted trees more frequently in the bottomlands than
elsewhere at PSE.
It may be noted that the whole tree population in the 12 ha showed a statistically significant annual decrease of 0.17% y-1, the density lowering from 607 to 591 trees per ha in 15 y. It is not possible to say if this change is indicative of a general trend at a larger spatial/temporal scale or simply related to the studied area/period. But from the comparison of the soil types and species guilds, we observed that all species groups, and
particularly the shade-tolerant species, lowered in density, except pioneer species regenerating from the soil seed bank, whose density increased by about 25% in 15 y. As recruitment occurred at locations close to mortality, the above imbalance could therefore be interpreted as the mark of some large canopy gaps in phase of closure (Riéra 1983).
Investigating tree demography is a difficult task, particularly in hyper-diverse tropical forests. Classical estimators of mortality and recruitment rates, like the ones used in this paper, postulate population homogeneity, i.e. identical hazards among all individuals, a hypothesis very unlikely to be met in most cases. The logistic regression model however offers a way to take into account individual differences defined by measured covariates (tree dbh, species groups, etc.) to provide individual probabilities. Yet logistic regression models are ill-suited to deal with
non-constant hazard in time, while temporal variations due to episodic disturbances (drought, opening of large canopy gaps, etc.) cannot be excluded. We therefore believe that survival analyses capable of modelling individual time-dependent hazards (Zens & Peart 2003) would provide deeper insights into tropical tree demography. But these models require repeated measures instead of simple initial and final censuses, so that more efforts should be made in the future to acquire such data for tropical forests.
ACKNOWLEDGEMENTS
This study is part of project CAREFOR-FLOR funded by the “Contrat de Plan Etat-Région pour la Guyane” 2004-2007. UMR AMAP (Botany and Computational Plant Architecture) is a joint research unit, which associates CIRAD, CNRS, INRA, IRD and Montpellier 2 University
(http://amap.cirad.fr/). The authors are particularly grateful to all technicians from IRD centre of Cayenne, who participated to enumeration of the forest plots at PSE since 1986. They also thank P. Couteron for comments on an earlier draft.
LITERATURE CITED
ASHTON, P. S. & HALL, P. 1992. Comparisons of structure among mixed dipterocarp forests of north-western Borneo. Journal of Ecology 80:459–481.
BARRET, J. 2001. Atlas illustré de la Guyane. IRD Editions, Cayenne. 215 pp.
BROKAW, N. V. L. 1985. Treefalls, regrowth, and community structure in tropical forest. Pp. 53–69 in Pickett, S. T. A. & White, P. S. (eds.). The ecology of natural disturbance and patch dynamics. Academic Press, New York.
CHAVE, J. 2004. Neutral theory and community ecology. Ecology Letters 7:241–253.
CLARK, D. A. & CLARK, D. B. 1992. Life history traits of canopy and emergent trees in a neotropical rain forest. Ecological Monographs 62:315–344.
CLIFFORD, P., RICHARDSON, S. & HÉMON, D. 1989. Assessing the significance of the correlation between two spatial processes.
CONDIT, R., HUBBELL, S. P. & FOSTER, R. B. 1995. Mortality rates of 205 neotropical tree and shrub species and the impact of a severe drought. Ecological Monographs 65:419–439.
CONDIT, R., ASHTON, P., BUNYAVEJCHEWIN, S., DATTARAJA, H. S., DAVIES, S., ESUFALI, S., EWANGO, C., FOSTER, R., GUNATILLEKE, I. A. U. N., GUNATILLEKE, C. V. S., HALL, P., HARMS, K. E., HART, T., HERNANDEZ, C., HUBBELL, S., ITOH, A., KIRATIPRAYOON, S., LAFRANKIE, J., LOO DE LAO, S., MAKANA, J. R., NOOR, M. N. S., KASSIM, A. R., RUSSO, S.,
SUKUMAR, R., SAMPER, C., SURESH, H. S., TAN, S., THOMAS, S., VALENCIA, R., VALLEJO, M., VILLA, G. & ZILLIO, T. 2006. The importance of demographic niches to tree diversity. Science 313:98–101.
COUTERON, P., PELISSIER, R., MAPAGA, D., MOLINO, J.-F. & TELLIER, L. 2003. Drawing ecological insights from a management-oriented forest inventory in French Guiana. Forest Ecology and Management 172:89–108.
CRAWLEY, M. J. 2004. Statistical computing: an introduction to data analysis using S-Plus. John Wiley & Sons Ltd., Chichester. 761 pp. DAVISON, A. C. & HINKLEY, D. V. 1997. Bootstrap methods and their application. Cambridge University Press, Cambridge. 582 pp. DUNN, P. K. & SMYTH, G. K. 1996. Randomized quantile residuals. Journal of Computational and Graphical Statistics 5:236–244. DURRIEU DE MADRON, L. 1993. Mortalité, chablis et rôle des trouées dans la sylvigenèse avant et aprés exploitation sur le dispositif d’étude sylvicole de Paracou, Guyane française. Thèse de Doctorat, Université de Nancy.
FAVRICHON, V. 1994. Classification des espèces arborées en groupes fonctionnels en vue de la réalisation d’un modèle de dynamique de peuplement en forêt guyanaise. Revue d’Ecologie Terre et Vie 49:379–403.
GOREAUD, F. 2000. Apports de l’analyse de la structure spatiale en foret tempérée à l’étude et la modélisation des peuplements complexes. Thèse de Doctorat, ENGREF, Nancy.
GOREAUD, F. & PÉLISSIER, R. 1999. On explicit formulas of edge effect correction for Ripley’s K-function. Journal of Vegetation
Science 10:433–438.
GOREAUD, F. & PÉLISSIER, R. 2003. Avoiding misinterpretation of biotic interactions with the intertype K12-function: population independence vs. random labelling hypotheses. Journal of Vegetation Science 14:681–692.
GRUBB, P. J. 1977. The maintenance of species-richness in plant communities: the importance of the regeneration niche. Biological Review 52:107–145.
HARMS, K. E., CONDIT, R., HUBBELL, S. P. & FOSTER, R. B. 2001. Habitat associations of trees and shrubs in a 50-ha neotropical forest plot. Journal of Ecology 89:947–959.
JANS, L., POORTER, L., VAN ROMPAEY, R. S. A. R. & BONGERS, F. 1993. Gaps and forest zones in tropical moist forest in Ivory Coast. Biotropica 25:258–269.
KUBO, T., KOHYAMA, T., POTTS, M. D. & ASHTON, P. S. 2000. Mortality rate estimation when inter-census intervals vary. Journal of
Tropical Ecology 16:753–756.
LEGENDRE, P. 1993. Spatial autocorrelation: trouble or new paradigm? Ecology 74:1659–1673. LEGENDRE, P. & FORTIN, M. 1989. Spatial pattern and ecological analysis. Vegetatio 80:107–138.
LOTWICK, H. W. & SILVERMAN, B. W. 1982. Methods for analysing spatial processes of several types of points. Journal of the Royal
Statistical Society B44:406–413.
MANOKARAN, N. & KOCHUMMEN, K. M. 1987. Recruitment, growth and mortality of tree species in a lowland dipterocarp forest in Peninsular Malaysia. Journal of Tropical Ecology 3:315–330.
MOLINO, J. F. & SABATIER, D. 2001. Tree diversity in tropical rain forests: a validation of the intermediate disturbance hypothesis.
Science 294:1702–1704.
NEBEL, G., KVIST, L. P., VANCLAY, J. K. & VIDAURRE, H. 2001. Forest dynamics in flood plain forests in the Peruvian Amazon: effects of disturbance and implications for management. Forest Ecology and Management 150:79–92.
ODDOU-MURATORIO, S., DEMESURE-MUSCH, B., PÉLISSIER, R. & GOUYON, P.-H. 2004. Impacts of gene flow and logging history on the local genetic structure of a scattered tree species, Sorbus torminalis L. Molecular Ecology 13:3689–3702.
PÉLISSIER, R., DRAY, S. & SABATIER, D. 2002. Within-plot relationships between tree species occurrences and hydrological soil constraints: an example in French Guiana investigated through canonical correlation analysis. Plant Ecology 162:143–156.
PHILLIPS, O. L., HALL, P., GENTRY, A. H., SAWYER, S. A. & VASQUEZ, R. 1994. Dynamics and species richness of tropical rain forests. Proceedings of the National Academy of Science USA 91:2805–2809.
POTTS, M. D. 2003. Drought in Bornean everwet rain forest. Journal of Ecology 91:467–474.
PURVES, D. W. & LAW, R. 2002. Fine-scale spatial structure in a grassland community: quantifying the plant’s-eye view. Journal of
Ecology 90:121–129.
RIPLEY, B. D. 1981. Spatial statistics. Wiley, New-York. 252 pp.
RUSSO, S. E., DAVIES, S. J., KING, D. A. & TAN, S. 2005. Soil-related performance variation and distributions of tree species in a Bornean rain forest. Journal of Ecology 93:879–889.
SABATIER, D., GRIMALDI, M., PRÉVOST, M.-F., GUILLAUME, J., GODRON, M., DOSSO, M. & CURMI, P. 1997. The influence of soil cover organization on the floristic and structural heterogeneity of a Guianan rain forest. Plant Ecology 131:81–108.
SHEIL, D., BURSLEM, D. F. R. P. & ADLER, D. 1995. The interpretation and misinterpretation of mortality rate measures. Journal of
Ecology 83:331–333.
SOKAL, R. R. & ROHLF, F. J. 1995. Biometry: the principles and practice of statistics in biological research. Hobart Press, Hobart. 887 pp.
SWAINE, M. D., LIEBERMAN, D. & PUTZ, F. E. 1987. The dynamics of tree populations in tropical forest: a review. Journal of Tropical
Ecology 3:359–366.
TUOMISTO, H., RUOKOLAINEN, K. & YLI-HALLA, M. 2003. Dispersal, environment, and floristic variation of Western Amazonian forests. Science 299:241–244.
VAN DER MEER, P. J. 1995. Canopy dynamics of a tropical rain forest in French Guiana. Ph. D. Thesis, Agricultural University, Wageningen.
VAN DER MEER, P. J. & BONGERS, F. 1996. Patterns of tree-fall and branch-fall in a tropical rain forest in French Guiana. Journal of
Ecology 84:19–29.
ZENS, M. S. & PEART, D. R. 2003. Dealing with death data: individual hazards, mortality and bias. Trends in Ecology and Evolution 18:366–373.
Table 1. Analysis of deviance for the logistic models of mortality and recruitment for trees ≥10 cm dbh in a 12-ha rain-forest sample at Piste de St-Elie in French Guiana. MADE and RADE were fitted to observed data, while MMLE and RMLE were fitted to virtual data simulated from maximum
likelihood estimates of instantaneous mortality and recruitment rates, accounting for non-constant census intervals. Probability of the Chi-square tests: * P < 0.05; ** P < 0.01; *** P < 0.001.
Mortality Recruitment
df Deviance df Deviance
Species guilds 4 89.3*** 87.1 *** 3 145.9 *** 142.9 ***
Soil types 1 20.6 *** 19.2 *** 2 30.8 *** 30.3 ***
Residual 7281 5736.7 5751.3 7092 4887.9 4948.4
Total1 7286 5846.6 5857.5 7097 5064.6 5121.5
1
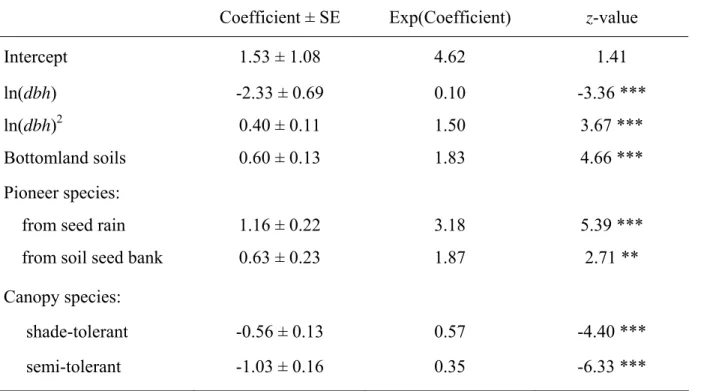
Table 2. Logistic model of mortality for trees ≥10 cm dbh in a 12-ha rain-forest sample at Piste de St-Elie in French Guiana. Coefficient estimates for the final minimal adequate model of mortality (MADE). Non-significant soil types and species groups were included within the
intercept. Exp(Coefficient) gives predicted rate of change in mortality in the corresponding variable. Probability of the Wald z-test: * P < 0.05; ** P < 0.01; *** P < 0.001.
Coefficient ± SE Exp(Coefficient) z-value
Intercept 1.53 ± 1.08 4.62 1.41
ln(dbh) -2.33 ± 0.69 0.10 -3.36 ***
ln(dbh)2 0.40 ± 0.11 1.50 3.67 ***
Bottomland soils 0.60 ± 0.13 1.83 4.66 ***
Pioneer species:
from seed rain 1.16 ± 0.22 3.18 5.39 ***
from soil seed bank 0.63 ± 0.23 1.87 2.71 **
Canopy species:
shade-tolerant -0.56 ± 0.13 0.57 -4.40 ***
Table 3. Logistic model of recruitment for trees ≥10 cm dbh in a 12-ha rain-forest sample at Piste de St-Elie in French Guiana. Coefficient estimates for the minimal adequate model of recruitment (RADE). Canopy species included shade-tolerant and semi-tolerant species.
Non-significant soil types and species groups were included within the intercept. Exp(Coefficient) gives predicted rate of change in recruitment in the corresponding variable. Probability of the Wald z-test: * P < 0.05; ** P < 0.01; *** P < 0.001.
Coefficient ± SE Exp(Coefficient) z-value
Intercept -2.03 ± 0.04 0.13 -46.83 ***
Bottomland soils 0.56 ± 0.14 1.75 3.98 ***
Pioneer species:
from seed rain 1.15 ± 0.23 3.14 4.94 *** from soil seed bank 1.61 ± 0.19 4.98 8.67 ***
Canopy species -0.73 ± 0.12 0.48 -6.32 ***
Table 4. Mortality and recruitment rates for trees ≥10 cm dbh in a 12-ha rain-forest sample at Piste de St-Elie in French Guiana. Only the species groups and soil types retained as significant in logistic models of Tables 2 and 3 are presented. Number of trees at initial census (No), dead (Nm) or recruited (Nr) during census interval (averaged to 15.15 y). λADE and μADE are average duration estimates of instantaneous mortality and
recruitment rates, given with SE computed from 1000 bootstrap resamplings; the different letters indicate significant differences (P < 0.05) among crossed categories. Half- and doubling-times are given as ln(2)/ λADE and ln(2)/ μADE, respectively. Rate of change was considered
significant when either λADE was outside confidence interval of μADE or μADE was outside confidence interval of λADE. * P < 0.05; ** P < 0.01;
Rate of change Doubling-time (y) Instantaneous recruitment rate 100 ⋅ μADE ± SE Half-time (y) 100 ⋅ λADE ± SE Instantaneous mortality rate
Species guild Soil type No Nm Nr
100 ⋅ (μADE − λADE)
bottomlands 9 6 8 7.25 ± 3.20 a 9.6 8.58 (3.31) a 8.1 1.32
Pioneers from seed rain terra firme 89 29 20 2.60 ± 0.50 a 26.6 1.90 (0.44) b 36.5 -0.70
bottomlands 9 4 5 3.88 ± 2.17 a,b 17.9 4.58 (2.43) a,c 15.1 0.69
Pioneers from soil seed bank terra firme 93 22 47 1.78 ± 0.39 a,b 38.9 3.35 (0.51) a,c 20.7 1.57 **
bottomlands 293 64 48 1.63 ± 0.21 a,b 42.6 1.26 (0.18) b,c 55.2 -0.37 *
Other species terra firme 5260 753 596 1.02 ± 0.04 a,b 68.0 0.82 (0.03) c 84.6 -0.20 ***
bottomlands 34 6 5 1.28 ± 0.53 a,b 54.1 1.08 (0.50) b,c 63.9 -0.20
Shade-tolerant canopy species terra firme 810 73 45 0.62 ± 0.07 b 111.2 0.39 (0.06) c 177.2 -0.23 ***
bottomlands 40 5 3 0.88 ± 0.41 b 78.6 0.54 (0.33) c 127.7 -0.34
Semi-tolerant canopy species terra firme 650 43 39 0.44 ± 0.06 b 153.4 0.41 (0.07) c 168.6 -0.04
Figure captions
Figure 1. Spatial pattern, based on Ripley’s L-function, of dead (a) and recruited (b) trees in a
10-ha transect of undisturbed rain forest at Piste de St Elie in French Guiana. Spatial
autocorrelation patterns of the quantile residuals of the final minimal adequate logistic models of mortality, MADE, (c) and recruitment, RADE, (d). Solid lines: functions computed for the
observed patterns; dotted lines: 99% confidence limits based on 1000 Monte Carlo
simulations of the null hypothesis of complete spatial randomness (a, b) and of no correlation of marks (c, d).
Figure 2. Predicted annual mortality rates according to tree diameter, soil types and species
guilds, based on the minimal adequate logistic model of mortality (MADE) in 12 ha of
undisturbed rain forest at Piste de St Elie in French Guiana. Solid lines: hydromorphic bottomland soils; dashed lines: terra firme soil types. TC: semi-tolerant canopy species; SC: shade-tolerant canopy species; PSB: pioneer species regenerating from the soil seed bank; P: pioneer species regenerating from seed rain; Other: other remaining species.
Figure 3. Spatial pattern of interaction based on the intertype L12-function between dead and
recruited trees in 12 ha of undisturbed rain forest at Piste de St Elie in French Guiana. Solid line: function computed for the observed pattern; dotted lines: 99% confidence limits of the null hypothesis of population independence based on 1000 Monte Carlo simulations.
Figure 1
Distance r (m)
0.04 0 20 40 60 80 100 3 100L(r)
-1 0 1 2a)
0 20 40 60 80 100 -1 0 1 3b)
2 -0.02 0 0.02Km(r)
0 20 40 60 80 100c)
-0.02 0 0.02 0.04d)
0 20 40 60 80Figure 2 TC TC SC SC Other Other PSB PSB P P 0.04 0.03 0.02 0.01
Predicted instantaneous mortalit
y
rate
(y
-1)
20 40 60 80 100 120 140 Tree diameter (cm)Figure 3 20 40 60 80