HAL Id: hal-01522298
https://hal.archives-ouvertes.fr/hal-01522298
Submitted on 26 May 2020
HAL is a multi-disciplinary open access
archive for the deposit and dissemination of sci-entific research documents, whether they are pub-lished or not. The documents may come from teaching and research institutions in France or
L’archive ouverte pluridisciplinaire HAL, est destinée au dépôt et à la diffusion de documents scientifiques de niveau recherche, publiés ou non, émanant des établissements d’enseignement et de recherche français ou étrangers, des laboratoires
Determinants of host species range in plant viruses
Benoit Moury, Frédéric Fabre, Eugénie Hébrard, Rémy Froissart
To cite this version:
Benoit Moury, Frédéric Fabre, Eugénie Hébrard, Rémy Froissart. Determinants of host species range in plant viruses. Journal of General Virology, Microbiology Society, 2017, 98 (4), pp.862-873. �10.1099/jgv.0.000742�. �hal-01522298�
Version postprint
Determinants of host species range in plant viruses
Moury, B. (1), Fabre, F. (2), Hébrard, E. (3), Froissart, R. (4,5) (1) Pathologie Végétale, INRA, 84140 Montfavet, France
(2) UMR 1065, Santé et Agroécologie du Vignoble, INRA, Bordeaux Sciences Agro, Institut des Sciences de la Vigne et du Vin, F-33883 Villenave d’Ornon, France
(3) UMR186, IRD-Cirad-UM, Laboratory "Interactions Plantes Microorganismes Environnement", Montpellier France
(4) UMR385, INRA-CIRAD-SupAgro, Laboratory «Biologie des Interactions plantes-parasites», Campus international de Baillarguet, F-34398 Montpellier, France
(5) UMR5290, CNRS-IRD-UM1-UM2, Laboratory «Maladies Infectieuses & Vecteurs : Ecologie, Génétique, Evolution & Contrôle», Montpellier France
Running title: Determinants of host species range in plant viruses
Corresponding author: B. Moury, E-mail: benoit.moury@inra.fr
Keywords: plant virus, host range, genome segmentation, vertical transmission, vector,
bipartite network
Non-standard abbreviations: HRB: host range breadth, absHRB: absolute host range
Version postprint
Abstract
Prediction of pathogen emergence is an important field of research, both in human health and
agronomy. Most studies of pathogen emergence have focused on involved ecological or
anthropic factors rather than on the role of intrinsic pathogen properties. The capacity of
pathogens to infect a large set of host species, i.e. to possess a large host range breadth
(HRB), is tightly linked to their emergence propensity. Using an extensive plant virus
database, we found that four traits related to virus genome or transmission properties were
strongly and robustly linked to virus HRB. Broader host ranges were observed for viruses
with single-stranded genomes, those with three genome segments and nematode-transmitted
viruses. Also, two contrasted groups of seed-transmitted viruses were evidenced. Those with a
single-stranded genome had larger HRB than non-seed-transmitted viruses, whereas those
with a double-stranded genome (almost exclusively RNA) had an extremely small HRB.
From the plant side, the family taxonomic rank appeared as a critical threshold for virus host
range, with a highly significant increase of barriers to infection between plant families.
Accordingly, the plant-virus infectivity matrix shows a dual structure pattern: a modular
pattern mainly due to viruses specialized to infect plants of a given family and a nested
pattern due to generalist viruses. These results contribute to a better prediction of virus host
Version postprint
Introduction
Pathogen emergence is the process by which the causative agent of a disease increases in
incidence following its appearance in a new, or in a previously existing host population [1,2].
In the case of animal and human diseases, particular attention has been paid to pathogen “host
jumps”, where a pathogen infecting a reservoir host generates epidemics and disease in a new
species. Host jumps involve three major steps: (i) encounter of the new host, (ii) infection and
(iii) propagation in that host population [3]. Most studies of pathogen emergence have
focused on involved ecological and anthropic factors, such as increase in human population,
modification of land use, introduction of pathogens in new areas through global travel or
trade, or expansion of the geographical range of vectors. These factors are mostly influential
on the above-mentioned steps (i) and (iii), and their effects are difficult to anticipate because
they are influenced by multiple environmental variables and human activities. In contrast, step
(ii) of host jump, i.e. infection of the new host, is determined to a large extent by intrinsic host
and pathogen properties. As a consequence, identifying which pathogen properties determine
host infection would help to compare risks of emergence among different pathogens.
Infectivity of a pathogen in a given species can be difficult to evaluate, especially for
animal or human pathogens, for which controlled inoculation by a new pathogen may not be
technically or ethically feasible. In contrast, determination of the species host range of plant
parasites has been used for decades as a taxonomic criterion and extensive data on the “potential” host species range of plant parasites (as opposed to their “realized” host range) have been obtained by controlled inoculation experiments, especially for viruses [4].
However, evolution of plant virus host range is poorly known (but see [5-9]).
Notwithstanding, host species jumps are certainly not infrequent among plant viruses, given
Version postprint
1000, and the incongruence between the phylogeny of most plant viruses and that of their host
species (but see [10,11]). HRB was found to be a major determinant of bacterial or viral
emergence in humans [12]. Also, host range expansion is an important cause of emergence for
plant pathogens and especially plant viruses [13,14]. In order to improve our knowledge of
the processes of plant virus emergence, we analyzed an extensive virus host range database
(VIDE database; [15]) to answer the following questions:
-Do certain types of viruses possess the capacity to infect a broader range of plant species
than others?
-Are viruses likely to jump to plant species belonging to distant taxa?
-What are the general patterns of plant-virus interactions at the species rank?
Results
Relationships between virus properties and HRB
In order to identify determinants of plant virus HRB, we analyzed its relationships with
putative explanatory variables corresponding to virus genome or transmission properties. For
each virus species in the database, two HRB estimates were obtained: absolute HRB
(absHRB), the total number of plant species listed as hosts in the database, and relative HRB
(relHRB), corresponding to absHRB divided by the total number of assayed plant species,
whether hosts or non-hosts. In addition, different datasets were analyzed because of potential
precision or accuracy issues associated with differences in (i) the total number of assayed
plant species and/or (ii) their distribution within plant taxonomy between virus species (i.e.
Version postprint
families for all viruses). To tackle the first issue, we analyzed a restricted dataset comprising the 293 virus species for which ≥15 plant species were assayed in addition to the entire dataset comprising 480 virus species. Indeed, the 293-virus dataset provides a better precision
of HRB estimates (Method S1). To tackle the second issue, we analyzed additional restricted
datasets for which a minimal diversity of plant genera or families, as assessed by Hill
numbers of order 2 (Hillgen. and Hillfam, respectively) [16] has been assayed (Table S1 and
Methods section).
We analyzed the correlations between the explanatory variables using Multiple
Correspondence Analyses (MCAs) (Fig. S1 available in the online Supplementary Material).
The two main axes of the MCAs accounted for 23.0% and 22.3% of the total variation for the
entire (480 species) and restricted (293 species) datasets, respectively, and revealed only
limited redundancy between the explanatory variables. The following two axes (orders 3 and
4) explained 16% and 17% of the total variation for these two datasets, respectively.
Moreover, absHRB and relHRB used as illustrative variables were poorly linked to the two
main axes, suggesting that they are not redundant with the explanatory variables.
The absHRB of viruses was highly significantly linked to four different viral
properties, their genome nature, their number of genome segments, their mode of vertical
transmission and their vector type (variables GEN, SEG, VER and VEC, respectively) and, to
a lower extent, to their abiotic horizontal transmission mode (Table 1). Viruses with a
single-stranded (ss) genome (either composed of RNA or DNA) had a broader host range (16.7 and
12.6 plant species on average, respectively) than viruses with a double-stranded (ds) genome
(3.6 and 3.9 species on average for dsRNA and dsDNA viruses, respectively). In contrast,
there was no significant difference in the absHRB of positive- and negative-sense (or
Version postprint
segments had a significantly broader host range (28.3 species on average) than other groups
(10.5 to 15.7 species on average). Concerning vertical transmission, seed-transmitted viruses
had a broader host range (20.2 species on average) than viruses with no vertical transmission
or viruses transmitted through vegetative propagation (12.7 to 13.5 species on average). Both
viruses transmitted vertically through contamination of the seed coat or of the seed embryo
had larger host ranges than other virus groups and no significant difference was observed
between these two groups of seed-transmitted viruses (data not shown). Concerning biotic
horizontal transmission, nematode-borne viruses had a broader host range (33.5 species on
average) than other types of viruses, whereas little absHRB differences were observed among
viruses corresponding to other vector types or with no known vector (from 10.9 to 15.1
species on average). Thrips-transmitted viruses had broad host ranges (38.3 species on
average) but did not depart significantly from other virus groups maybe because of their
underrepresentation in the dataset (six virus species only). In addition, viruses transmitted
both vertically through seeds and horizontally through biological vectors had a larger host
range than viruses transmitted exclusively through seeds, exclusively through vectors, or
neither through seeds nor vectors (data not shown; [17]). Concerning abiotic horizontal
transmission, viruses transmitted by contact between plants had a slightly broader host range
than viruses with no horizontal abiotic transmission (16.5 vs. 14.4 species, respectively).
The robustness of the links between these virus traits and HRB was examined with
restricted virus sets limiting potential precision or accuracy issues (Method S1 and Table S1).
For all these restricted datasets (13/13), the links between the two HRB estimates (absHRB
and relHRB) and the explanatory variables SEG, VER and VEC were similar to those
observed for the entire dataset, meaning that viruses with three genome segments had a larger
Version postprint
than viruses with no vertical transmission and nematode-borne viruses had a larger HRB than
arthropod-borne viruses (Table S1). Two other explanatory variables, genome type and kind
of vector transmission, showed less robust effects. Only 3/13 of these datasets revealed
significant differences among virus groups differing by their genome nature, viruses with a
ssRNA genome having a significantly larger HRB than at least one of the virus groups with a
ds genome. In six additional datasets, an overall effect of virus genome nature on HRB was
detected with the Kruskal-Wallis multiple test but no differences between virus groups were
detected. However, the trend was similar and viruses with a ssRNA genome had a larger HRB
than viruses with a ds genome. This lack of robustness was probably due to the
underrepresentation of viruses with dsRNA or dsDNA genomes in many of these datasets
(four viruses or less in these two groups) and consequently a lack of statistical power, i.e. a
poor capacity to detect true differences between virus groups. For the kind of vector
transmission, only datasets comprising viruses for which ≥15 plant species were assayed
revealed significant differences in HRB, with non-vectored viruses having a significantly
larger HRB than viruses transmitted by vectors in a non-circulative manner.
We computed conditional inference regression trees to synthesize the effect of the four main
significantly explanatory variables (GEN, SEG, VER and VEC) on HRB. Regression trees
take into account the interactions between explanatory variables and indicate which
combinations of variables and variable levels correspond to higher or lower HRB. With the
480-virus dataset, the first dichotomy in the regression tree for absHRB was linked to the
VEC variable and separated nematode-borne viruses from others (Fig. 1a). The second and
third dichotomies were linked to the SEG and GEN variables, respectively. More distal nodes
in the tree were linked to the VER variable and, again, to the SEG variable. With the
Version postprint
absHRB (data not shown). The nodes of the tree were linked to the VEC and SEG variables.
Overall, the regression trees strengthen the importance of the nature of virus vectors and of
genome segmentation to explain virus HRB and emphasize which combinations between
these biological properties correspond to a higher or lower HRB.
Differences in HRB were also compared between the most represented virus genera (Table
S2). Nepovirus was the only genus revealing a significantly broader host range than other
genera (Begomovirus, Carlavirus, Potyvirus and Tymovirus). Nepoviruses are
nematode-borne and seed-transmitted, two traits that were linked to large host ranges in the previous
analyses (Table 1; Table S1). In the 480-virus dataset, the only additional effect detected was
the smaller HRB of alphacryptoviruses (1.2 host species on average), a group of
seed-transmitted dsRNA viruses, compared to most other virus genera (data not shown).
A model was built to predict the absHRB class of a virus (class 1: ≤5 host species;
class 2: 6 to 15 host species; class 3: >15 host species) from the four variables GEN, SEG,
VER and VEC (Method S2). The overall rate of correct assignments to absHRB classes by the
model was 0.48 compared to a rate of 0.33 obtained with a random classifier choosing the
absHRB class randomly. A detailed analysis of the predictive performance of the model is
provided in Method S2. Additional models aiming to predict the diversity of host genera or
families are also presented in Method S2.
Plant determinants of virus host range
We examined at which plant taxonomic rank the barriers to infection by viruses are more
widespread and/or stronger. Four different Hill numbers [16] of order q=0 to q=3, integrating
Version postprint
different plant taxonomic ranks (Fig. 2). Depending on q, the Hill numbers place more weight
on host richness or distribution evenness. However, whatever q, the ranking of the Hill
numbers and the significant differences between taxonomic levels were remarkably similar. A
sharp decrease of host diversity was observed between the genus and the family levels. Then,
no significant difference of diversity was observed between the family and the order levels
and small but significant host diversity reduction was observed at higher taxonomic ranks.
These results indicate moderate barriers to infection at the within-family rank, each
virus species being generally infectious in several plant genera, and much more frequent
and/or stronger barriers to infection at the between-family rank. By comparison, only few
additional barriers to infection occur at higher plant taxonomic ranks. Consequently, the plant
family appears as a key taxonomic threshold for plant virus host range.
Structure of the plant-virus infectivity matrix
From the entire virus species – plant species infectivity matrix obtained from the database, a
smaller matrix (37 viruses × 28 plants) containing relatively few (<10%) missing
host/non-host data was extracted and analyzed for nested or modular structural patterns, two important
properties that correspond to two contrasted models of host range evolution [18]. This matrix
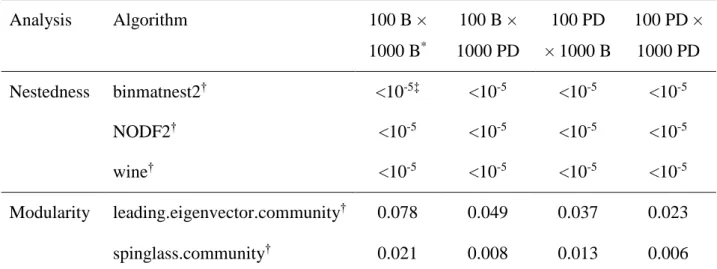
was shown to be highly significantly nested (P-value <0.001) (Fig. 3a), whatever the
algorithm used, the way to simulate the status of the missing data and the null model used for
significance assessment (Table 2).
Concerning modularity analyses, the edge.betweenness algorithm failed to detect any
module in the matrix. For the other two algorithms (spinglass.community and
Version postprint
(0.006<P-value <0.078; Table 2). In only one of eight combinations of modularity algorithm,
way of simulating missing data and null model was the significance slightly above 0.05. The
maximal modularity (0.14 for spinglass.community algorithm) was obtained when plant and
virus species were distributed into three modules (Fig. 3b). There was no obvious property
shared by viruses belonging to the same module but a strong association between modules
and plant botanical families. Module 1 contained a majority of plants (7 of 11 species) of the
Fabaceae, whereas modules 2 and 3 comprised almost exclusively plants of the Amaranthaceae (7 of 8) and Solanaceae (8 of 9), respectively (Fig. 3b).
These patterns reflect two groups of plant viruses. On one hand, “generalist” viruses
with broad host ranges were identified within module 1 and tended to possess the capacity to
infect plants of any module. They contributed mainly to the nested pattern of the matrix. On the other hand, “specialist” viruses belonging to modules 2 and 3 were mostly able to infect plants belonging to their own module and ensured the modular pattern of the matrix (Fig. 3b).
Discussion
A major asset of the VIDE database is the compilation of experimental, rather than
only natural, host range data. This allowed identifying properties linked to the virus intrinsic
capacity to infect a set of plants, irrespective of the exposure of these plants to the virus in
natural conditions. Consequently, our analyses can be useful to estimate the risks of future
emergence in new plant species for a virus possessing a given set of traits if plant exposure
conditions were to change. As for any large dataset, there are a number of pitfalls to avoid for
Version postprint
of the database and to (ii) the precision and (iii) accuracy of HRB estimates obtained from the
database.
The database is based on the literature available in 1996 and has not been updated
since. It includes host range data for 480 virus species, which represents 53% of the total
number (900) of plant virus species accepted in the latest ICTV report [19-20]. The 19 virus
families accepted to date are represented by at least 40% of their species members, except
Geminiviridae (29 species of 196), Bunyaviridae (2 of 8), Ophioviridae (0 of 6) and
Endornaviridae (0 of 4). The major quantitative difference between the viruses in the database
and the present taxonomy is the huge increase of species in the genus Begomovirus (family
Geminiviridae), for the majority of which few HRB data are available. If we withdraw the 167
begomovirus species absent from the database, our dataset represents 66% of the total virus
species. Twelve virus genera which include few species (2.3 on average) are not represented
in the dataset, of a total of 85 genera. Concerning the plant species used to estimate HRB, it
should be emphasized that virologists use more and more genome sequence data to
characterize virus species to the detriment of host range data. In summary, the database is
quite exhaustive and the missing virus species are quite evenly distributed across genera and
families. However, care should be taken about the interpretation of our results for some virus
taxa when few HRB data are available due to the peculiarities of the virus biology (see
below).
Concerning the precision of HRB estimates, a limiting factor is the number of assayed
plant species which varies between viruses and can be small for some of them. To minimize
the impact of this source of imprecision, we defined a reduced set of 293 plant viruses for
which the absHRB and relHRB were fairly well correlated, indicating that representative sets
Version postprint
absHRB in the 480- and 293-virus datasets and the relHRB in the 293-virus dataset (Table
S1). Importantly, most relationships between virus HRB and biological properties were highly
significant for the three HRB estimates. The robustness of these results minimizes the risk that
they would have been affected by imprecisions in HRB estimation.
The unequal distribution of the assayed plant species across plant taxa may affect the
accuracy of HRB estimation. Consequently, we analyzed the links between virus HRB and
genome or transmission properties using datasets with increasing requirements in terms of
diversity and distribution of assayed plant species among plant genera and families (i.e. with
increasing thresholds for Hillgen. and Hillfam., respectively) (Table S1). For all these virus
subsets, results were similar to those obtained with the entire dataset for the SEG, VER and
VEC variables. For the GEN variable, results were also similar when there was a sufficient
number of virus species in the different groups of genome nature. Again, this strengthens the
robustness of our results.
Importantly, the relationships observed between viral traits and HRB were not due to
particular virus taxa with extreme HRB values but, rather, were shared throughout the virus
diversity. Nepovirus was the only virus genus fairly well represented in the database (≥12
member species) that exhibited a significantly larger HRB (Table S2). After removing
nepoviruses from the 480- or 293-virus datasets, the four variables GEN, SEG, VER and VEC
were still significantly linked to virus HRB (data not shown).
A strong link between plant taxonomy and virus host range was evidenced in our study
and seems to be general for plant parasites [21]. Overall, there were relatively few barriers to
Version postprint
families (Fig. 2). The plant family rank can therefore be considered as a critical taxonomic
threshold that often limits virus host range. This was confirmed, on a smaller dataset, by the
analysis of the plant-virus infectivity matrix (Fig. 3). The matrix was significantly modular.
Each detected module was strongly associated with a plant family but not with a particular
virus taxon. In tree-fungus interactions, the detected modules were also linked to host taxa but
not to fungal taxa [22]. Consequently, plant taxonomy may be used as a first predictor of virus
host jumps. However, the plant-virus matrix presented also a significantly nested pattern,
which was mostly due to “generalist” viruses that were able to infect plants belonging to any
of the three modules (Fig. 3). The apparent dichotomy between specialist and generalist
viruses suggests that some viral traits (including potentially those revealed in our study)
and/or selective forces have determined contrasted host range breadth among plant viruses.
We identified several virus traits robustly and strongly linked to their HRB: genome
nature and segmentation, occurrence and mode of vertical transmission and vector type (Table
1 and Table S1). At this stage, we can only speculate as to whether these four virus traits are
determinants of virus HRB or if they are linked with HRB for other reasons. Viruses with a ss
genome had broader host ranges than viruses with a ds genome, with a 3- to 4-fold difference
between these two groups (Table 1). In accordance, Woolhouse et al. [1] observed that
ssRNA viruses are the animal pathogens most prone to emerging via host jumps. One possible
explanation is that viruses with a ss genome tend to have higher mutation and evolution rates
than those with a ds genome [23], perhaps a consequence of the higher instability of ss nucleic
acids [24]. However, this putative mechanism does not explain why ssDNA viruses have a
broader plant host range than dsRNA viruses, since they share similar evolution rates [23].
The segmentation of virus genomes was also strongly linked to HRB. Several
Version postprint
with three genome segments (Table 1). It is noteworthy that this was not due to a number of
viruses with three genome segments that possess extremely large host ranges, especially
Cucumber mosaic virus, Tomato spotted wilt virus and Alfalfa mosaic virus. Indeed, the
Kruskal-Wallis test used is based on ranks and therefore not artificially influenced by extreme
HRB values. Moreover, the SEG variable remained significantly linked to HRB after
withdrawing these three viruses from the datasets (P-values=1.2×10⁻³ to 3.7×10⁻³).
Hypotheses regarding the advantage of virus genome segmentation are longstanding [25]. It
was proposed that segmentation increases genome stability, replication fidelity and/or
replication rapidity [26-28]. Genome segmentation could also allow better regulation of gene
expression [29] and, on a longer term, could favor genome exchanges through reassortment
between virus isolates, which can be advantageous for virus adaptation in a changing
environment (the so-called “advantage of sex”; [30]). On the opposite, the low within-host
effective population size of plant viruses may be the main limitation of genome segmentation.
Only a small number of virus particles contribute to the infection of an individual plant cell
and hence the multiplicity of infection (MOI) is now considered to be low, though variable
over time, for plant viruses [31-32]. A consequence of virus genome segmentation is that the
minimum MOI required for infection would increase very rapidly as the number of genome
segments increases. This suggests an optimum number of genome segments (3 or 4), for
which the advantages of genome segmentation are not counterbalanced by the necessity of
higher MOIs [33]. Interestingly, the observation that viruses with >3 genome segments have
narrower host ranges, on average, lends support to this hypothesis (Table 1).
The larger host range of seed-transmitted viruses (Table 1; [17]) seems
counter-intuitive, since seed transmission through the embryo is often associated with host
Version postprint
Alphacryptovirus and Betacryptovirus (family Partitiviridae) are transmitted by ovule and by
pollen to the seed and their host range is restricted to ca. one plant species because of the lack
of horizontal spread, mechanical transmission and even graft transmission [19]. The 480-virus
dataset contained only 22 members of the family Partitiviridae and no member of the family
Endornaviridae, which may have led to a general overestimation of the average HRB of
transmitted viruses. An ultimate cause of the broader host range of some groups of
seed-transmitted viruses could be linked to the probability of infecting new, healthy plants. A
trade-off has been observed between the efficiency of vertical seed transmission and
horizontal transmission in some plant viruses [34]. As a consequence, seed transmission could
decrease the probability of infecting new plants through horizontal transmission. This
negative effect could be compensated by a broader host range, offering more opportunities for
virus dissemination. This evolutionary trend would only be of interest for viruses with mixed
(i.e. both vertical and horizontal) transmission modes. Confirming this hypothesis, plant
viruses transmitted both through seeds and by vectors have a broader host range than viruses
with no vector transmission or with exclusive vector transmission (data not shown and [17]).
An alternative hypothesis, with a causal link in the opposite direction, could be that viruses
with a broader host range have more opportunities of being seed-transmitted in at least one of
their host species. Indeed, many plant viruses are transmitted through seeds only in a small
subset of their host species. Overall, we postulate that two different groups of
seed-transmitted viruses should be distinguished: Those that are also seed-transmitted horizontally by
vectors exhibit large host ranges and those that are exclusively transmitted vertically show an
extremely narrow host range.
Finally, the host range of nematode-transmitted viruses was about twice as large as
Version postprint
explanation for the broader host range of nematode-transmitted viruses could be linked to the
probability of infecting new plants. Because of the poor migration capacity of their vectors
(only a few centimetres per year in uncultivated woodland habitats; [35]), nematode-borne
viruses could have evolved broader host ranges to increase their chance of infecting new
plants. The same tendency was not observed for other soil-borne viruses, such as those
transmitted by fungi (Table 1), which may be due to the fact that fungal vectors may have a
higher dissemination capacity than nematodes and/or that nematode-borne viruses are more
prone to becoming extinct after the death of their host.
Methods
Plant virus database
Plant virus host range data were obtained from the VIDE (Virus Identification Data
Exchange) database [15], which includes a list of host and non-host plant species for each
virus species. Non-hosts have been determined by controlled laboratory inoculation
experiments, whereas hosts include both naturally and experimentally-infected species.
Local-lesion hosts, in which the virus multiplies and moves from cell to cell in the inoculated organs
to some extent, are considered as hosts in the database. This is justified by the facts that (i)
local lesions result from hypersensitive reactions triggered by gene-for-gene interactions
between the plant and the virus (e.g. [36,37]), (ii) mutations in the plant resistance gene and/or
in the virus avirulence gene can allow full systemic infection [38-40] and (iii) environmental
conditions can abolish the expression of the resistance in local-lesion plants and lead to full
susceptibility [41]. Plant species included both in the host and non-host lists for a given virus
Version postprint
virus genotypes in different studies and probably the result of intraspecific variability
affecting host resistance and/or virus pathogenicity. The list of host and non-host plant species
for each virus species was copied from the database to Excel in April 2009 and then formatted
using the R software version 3.0.2 [42].
Among the virus species described in the database, we kept only those considered as
definitive or tentative species in the latest ICTV (International Committee on Taxonomy of
Viruses) report [19]. Virus taxonomy at the genus or higher ranks was as proposed by ICTV.
Biological properties of viruses were obtained from Brunt et al. [15] and King et al. [19].
Estimating host range breadth of plant viruses and tackling potential biases
A total of 480 viral species contained host range data in the database. The most obvious
estimate of virus HRB is the absHRB. However, this estimate can be affected by precision
and accuracy issues. First, the total number of assayed plant species varies greatly between
virus species, which affects the precision of HRB estimate. For example, absHRB usually
underestimates the HRB of viruses for which experimental inoculation is difficult to
implement (no artificial inoculation method, vector unknown, vector difficult to raise, no
horizontal transmission). To tackle this issue, we analyzed the relHRB. To ensure a
satisfactory precision for relHRB, we restricted the dataset to the 293 virus species for which
a minimal number of n=15 plant species were assayed (see Method S1 for justification; Table
S1). Second, the distribution of assayed plant species within plant taxonomy also varies
greatly between virus species, which can be a source of bias. For example, if a large number
of plant species of the same genus as the one where the virus was initially isolated are
Version postprint
infection barriers at this plant taxonomic rank. To tackle this bias source, we restricted the
dataset to virus species for which a minimal diversity of plant genera or families was assayed,
as assessed by Hill’s diversity. For each virus species, the diversity of assayed plant species
was calculated at different plant taxonomic levels (genus, family…) with the Hill numbers
[16], of increasing use in ecology [43]. Hill [16] integrated taxon richness and abundance into
a class of diversity measures (Hill numbers) defined for q ≠ 1 as:
𝐷
𝑞
= (∑𝑆𝑖=1 𝑝𝑖𝑞)1/(1−𝑞) (1),
in which S is the number of taxa in the sample, and the ith taxon (i = 1, 2,….., S) has relative
abundance pi. The parameter q determines the sensitivity of the measure to the relative
frequencies. For q = 0, the abundances of individual taxa do not contribute to the sum in
equation (1), so that 0D corresponds to taxon richness. For q=1, equation (1) is undefined, but
its limit as q tends to 1 is the exponential of the Shannon index:
𝐷
1 = exp(− ∑ 𝑝
𝑖 × log 𝑝𝑖 𝑆
𝑖=1 ) (2).
The variable 1D weighs species in proportion to their frequency. When q = 2, equation (1)
yields Simpson diversity, which places more weight on the frequencies of abundant taxa and
discounts rare taxa. Usually, a characterization of the taxon diversity of a sample with S taxa
and relative abundances (p1, p2,….., pS) is conveyed by a diversity profile (a plot of qD vs. q
from q = 0 to q = 3). In the analysis of assayed plant species, we found that the Hill numbers
of order q=0 to q=3 were highly correlated (r>0.90) at the genus or at the family level, but less
correlated between the genus and family levels (data not shown). Consequently, we chose
different minimal thresholds of 2D calculated at the genus and at the family levels (Hillgen. and
Version postprint
Relationships between host range breadth and biological properties of plant viruses
To unravel virus properties explaining differences in HRB, the response variables absHRB
and relHRB were compared among groups of viruses sharing the same biological or
transmission traits (putative explanatory categorical variables). These traits represent major
life history traits or genome properties of plant viruses:
- The genome nature, categorized as ss or ds RNA or DNA (variable 'GEN’);
- the number of genome segments, viruses with >3 genome segments being grouped into the
same category because they were underrepresented in the database (20 species) (variable ‘SEG’);
- the occurrence and mode of vertical transmission, categorized as (i) seed transmission and
(ii) no vertical transmission (variable ‘VER’);
- the occurrence and mode of abiotic horizontal transmission, categorized as (i) graft
transmission (when some host plants are usually multiplied by grafting) but no substrate, tool
or contact transmission, (ii) substrate (i.e. soil or irrigation water) transmission but no tool or
contact transmission, (iii) tool transmission but no contact transmission, (iv) contact
transmission between plants and (v) no abiotic horizontal transmission known;
- the vector type, categorized as (i) aphid, (ii) whitefly, (iii) other Hemiptera, (iv) Coleoptera,
(v) thrips, (vi) mite, (vii) fungus or soil-borne protists (named collectively fungus for
simplicity), (viii) nematode, and (ix) no vector known;
- the vector type defined as previously but with arthropods grouped into a single category (variable ‘VEC’);
Version postprint
- the mode of vector transmission, categorized as (i) non-vectored, (ii) non-circulative (non-
or semi-persistent), (iii) circulative (i.e. persistent but non-multiplicative) and (iv)
circulative-multiplicative.
Variables linked to nucleotide composition or within-species genetic diversity or evolutionary
constraints were not included because of the lack of data for a large set of viruses in the
database. Additional variables did not provide consistent results (number of vector species) or
are confounded with other variables (genome linearity or circularity) and are therefore not
presented.
All statistical analyses were performed with the R software version 3.0.2. First, we performed
MCAs using the package ‘FactoMineR’ to analyze the correlations and putative redundancy
between the explanatory variables. Then, an analysis of the links between HRB estimates and
each explanatory variable was performed. Since residues of linear models explaining absHRB
or relHRB with any of the explanatory variables departed significantly from a normal
distribution, we used non-parametric Kruskal-Wallis tests, using the package ‘pgirmess’, to
assess the significance of the link between HRB estimates and each explanatory variable and
to compare the HRB between virus categories. Additionally, regression trees were realized to
better explore the effect of the most significant explanatory variables on HRB. We used the
conditional inference trees method ‘ctree’ implemented in the package ‘party’ with a
minimum number of 15 viruses in each terminal “leaf” of the tree and default setting for other parameters to describe the conditional distribution of absHRB and relHRB as a function of the
four categorical variables GEN, SEG, VER and VEC.
Version postprint
Different diversity indices were calculated to unravel the links between the host status of plant
species and their taxonomic proximity. For each virus species, the host diversity was
calculated as presented before with the Hill numbers of orders q=0 to q=3. The mean Hill
numbers of host plants for all virus species that we obtained for q = 0 to q = 3 were compared
among plant taxonomic ranks with Kruskal-Wallis tests.
Plant taxonomy was according to Brunt et al. [15] and Watson & Dallwitz [44,45] at the
species, genus and family ranks and according to Stevens [46] at higher ranks.
Structure of the plant-virus infectivity matrix
Infectivity matrices, where a set of parasite species or genotypes are confronted to a set of
host species or genotypes, contain binary data related to parasites’ host range (e.g. 1 for hosts
and 0 for non-hosts). Structural patterns of such matrices, notably their modularity and
nestedness, vary depending on host range evolution at the species or intraspecific levels
[18;47-49]. In a nested pattern, the host range of the more-specialized viruses is a subset of
the host range of less-specialized viruses, leading to a stair-shaped pattern for host cases. This
corresponds to a host range expansion pattern of virus evolution. In contrast, a modular
pattern, where each virus is specialized to infect one (or a small set of) host species,
corresponds to a host shift pattern of evolution. In that case, viruses become specialized on
new hosts at the cost of losing infectivity on older hosts.
Methods to estimate nestedness and modularity are described in detail in Weitz et al.
[18] and were computed using the ‘bipartite’ and ‘igraph’ packages, respectively. Because
these methods do not accept missing data (plant-virus combinations for which the host status
Version postprint
compromise between the number of plant and virus species and the amount of missing data.
For this, the lines and columns of the initial matrix were permuted to rank plant and virus
species by increasing numbers of missing data, evidencing a 37 virus species × 28 plant
species subset containing only 9.8% of missing data which was subsequently analyzed.
Attempts to analyze larger matrices were not successful because of too many missing data
(data not shown). Then, we simulated the host/non-host status for missing data. Two
approaches were followed: (i) the host/non-host status of missing data was set as proportional
to the total amounts of host and non-host cases in the rest of the infectivity matrix (Bernoulli
model) and (ii) each plant-virus combination missing in the matrix was assigned a probability
of being a host case which was equal to the mean of the frequencies of host cases in the same
column and in the same line of the initial matrix (probabilistic degree model). In both cases,
100 filled matrices were simulated. For statistical significance assessment, the nestedness and
modularity of the infectivity matrices filled as described previously were compared to two
different null models [18]: (i) the Bernoulli random null model, where the same total number
of host cases as in the filled matrix was randomly distributed in matrices containing the same
number of lines and columns as the filled matrix and (ii) the probabilistic degree null model,
where each plant-virus combination was assigned a probability of corresponding to a host
case which was equal to the mean of the frequencies of host cases in the same column and in
the same line of the filled matrix. Each of the 100 filled matrices was compared to 1000
matrices generated under both null models.
Version postprint
This work was supported by the MIE (Maladies Infectieuses Emergentes) interdisciplinary
programme of CNRS (Centre National de la Recherche Scientifique). The funders did not
play any role in the study or in the preparation of the article or decision to publish.
Acknowledgments
Thanks to Véronique Decognet for efficient help in the management of the database, to Denis
Fargette and Hervé Lecoq for the spark of this study and to Thierry Candresse, Mark Tepfer,
Karine Berthier, Stéphane Blanc and Julien Papaïx for help in analyses and/or constructive
comments on the manuscript.
Conflict of interest
The authors declare no conflict of interest.
Ethical statement
Version postprint
References
1. Woolhouse MEJ, Haydon DT, Antia R. Emerging pathogens: the epidemiology and
evolution of species jumps. Trends Ecol Evol 2005;20:238-244.
2. Scharg SJ, Wiener P. Emerging infectious disease: what are the relative roles of
ecology and evolution. Trends Ecol Evol 1995;10:319-324.
3. Pulliam JRC. Viral host jumps: Moving toward a predictive framework. EcoHealth
2008;5:80-91.
4. Dijskra J. Importance of host ranges and other biological properties for the taxonomy
of plant viruses. Arch Virol 1992;Suppl5:279-289.
5. Suehiro N, Natsuaki T, Watanabe T, Okuda S. An important determinant of the
ability of Turnip mosaic virus to infect Brassica spp and/or Raphanus sativus is in its P3 protein.
J Gen Virol 2004;85:2087-2098.
6. Chen KC, Chiang CH, Raja JAJ, Liu FL, Tai CH et al. A single amino acid of NiaPro
of Papaya ringspot virus determines host specificity for infection of papaya. Mol
Plant-Microbe Interact 2008;21:1046–1057.
7. Tatineni S, Robertson CJ, Garnsey SM, Dawson WO. A plant virus evolved by
acquiring multiple nonconserved genes to extend its host range. Proc Natl Acad Sci USA 2011;108:17366–17371.
8. Poulicard N, Pinel-Galzi A, Traoré O, Vignols F, Ghesquière A et al. Historical
contingencies modulate the adaptability of Rice yellow mottle virus. PLOS Pathog 2012;8:e1002482.
9. Vassilakos N, Simon V, Tzima A, Johansen E, Moury B. Genetic determinism and
evolutionary reconstruction of a host jump in a plant virus. Mol Biol Evol 2016;33:541-553.
10. Gibbs A. Evolution and origins of tobamoviruses. Phil Trans R Soc B 1999;354:593–
602.
11. Wu B, Melcher U, Guo X, Wang X, Fan L et al. Assessment of codivergence of
mastreviruses with their plant hosts. BMC Evol Biol 2008;8:335.13.
12. Woolhouse MEJ, Gowtage-Sequeria S. Host range and emerging and reemerging
pathogens. Emerg Infect Dis 2005;11:1842-1847.
13. Anderson PK, Cunningham AA, Patel NG, Morales FJ, Epstein PR et al. Emerging
infectious diseases of plants: pathogen pollution, climate change and agrotechnology drivers.
Version postprint
14. Jones RAC. Plant virus emergence and evolution: origins, new encounter scenarios,
factors driving emergence, effects of changing world conditions, and prospects for control.
Virus Res 2009;141:113–130.
15. Brunt AA, Crabtree K, Dallwitz MJ, Gibbs AJ, Watson L et al. Plant Viruses
Online: Descriptions and Lists from the VIDE Database. Version: 20th August 1996; URL: http://pvo.bio-mirror.cn/refs.htm; now available at: http://sdb.im.ac.cn/vide/refs.htm; 1996.
16. Hill M. Diversity and evenness: a unifying notation and its consequences. Ecology
1973;54:427–432.
17. Power AG, Flecker AS. Virus specificity in disease systems: are species redundant?
In: Kareiva P, Levin SA (editors). The importance of species: Perspectives on Expendability
and Triage. Princeton, USA: Princeton University Press; 2003. pp. 330-347.
18. Weitz JS, Poisot T, Meyer JR, Flores CO, Valverde S et al. Phage–bacteria infection
networks. Trends Microbiol 2013;21:82-91.
19. King AMQ, Adams MJ, Carstens EB, Lefkowitz EJ. Virus taxonomy. Classification and nomenclature of viruses. Ninth report of the International Committee on Taxonomy of Viruses. London, UK, Waltham, MA, USA, San Diego, CA, USA: Elsevier Academic Press;
2012.
20. Desbiez C, Moury B, Lecoq H. The hallmarks of "green" viruses: Do plant viruses
evolve differently from the others? Inf Genet Evol 2011;11:812-824.
21. Gilbert GS, Magarey R, Suiter K, Webb CO. Evolutionary tools for phytosanitary
risk analysis: phylogenetic signal as a predictor of host range of plant pests and pathogens. Evol
Appl 2012;5:869-878.
22. Vacher C, Piou D, Desprez-Loustau M-L. Architecture of an antagonistic tree/fungus
network: The asymmetric influence of past evolutionary history. PLOS One 2008;3:e1740.
23. Sanjuán R. From molecular genetics to phylodynamics: Evolutionary relevance of
mutation rates across viruses. PLOS Pathog 2012;8:e1002685.
24. Frederico LA, Kunkel TA, Shaw BR. A sensitive genetic assay for the detection of
cytosine deamination: determination of rate constants and the activation energy. Biochemistry 1990;29:2532–2537.
25. Sicard A, Michalakis Y, Gutiérrez S, Blanc S. The strange lifestyle of multipartite
viruses. PLoS Pathog 2016;12:e1005819.
26. Nee S. The evolution of multicompartmental genomes in viruses. J Mol Evol
1987;25:277-281.
27. Chao L. Levels of selection, evolution of sex in RNA viruses, and the origin of life. J Theor Biol 1991;153:229–246.
Version postprint
28. Ojosnegros S, García-Arriaza J, Escarmís C, Manrubia SC, Perales C et al. Viral
genome segmentation can result from a trade-off between genetic content and particle stability.
PLOS Genet 2011;7:e1001344.
29. Sicard A, Yvon M, Timchenko T, Gronenborn B, Michalakis Y et al. Gene copy
number is differentially regulated in a multipartite virus. Nature Comm 2013;4:2248.
30. Maynard Smith J. The Evolution of Sex. Cambridge, UK: Cambridge University Press;
1978.
31. Gutiérrez S, Michalakis Y, Blanc S. Virus population bottlenecks during within-host
progression and host-to-host transmission. Curr Opin Virol 2012;2:546-555.
32. Tromas N, Zwart MP, Lafforgue G, Elena SF. Within-host spatiotemporal dynamics
of plant virus infection at the cellular level. PLOS Genet 2014;10:e1004186.
33. Iranzo J, Manrubia SC. Evolutionary dynamics of genome segmentation in
multipartite viruses. Proc R Soc B 2012;279:3812-3919.
34. Stewart AD, Logsdon JM, Kelley SE. An empirical study of the evolution of virulence
under both horizontal and vertical transmission. Evolution 2005;59:730–739.
35. Taylor CE, Brown DJF, Neilson R, Jones AT. The persistence and spread of Xiphinema diversicaudatum in cultivated and uncultivated biotopes. Ann Appl Biol
1994;124:469-477.
36. De la Cruz A, Lopez L, Tenllado F, Diaz Ruiz JR, Sanz AI et al. The coat protein is
required for the elicitation of the Capsicum L2 gene-mediated resistance against the tobamoviruses. Mol Plant-Microbe Interact 1997;10:107-113.
37. Tomita R, Ken-Taro S, Hiroyuki M, Sakamoto M, Murai J et al. Genetic basis for
the hierarchical interaction between Tobamovirus spp and L resistance gene alleles from different pepper species. Mol Plant-Microbe Interact 2011;24:108-117.
38. Andersen K, Johansen IE. A single conserved amino acid in the coat protein gene of
pea seed-borne mosaic potyvirus modulates the ability of the virus to move systemically in
Chenopodium quinoa. Virology 1998;241:304-311.
39. Sekine KT, Ishihara T, Hase S, Kusano T, Shah J et al. Single amino acid alterations
in Arabidopsis thaliana RCY1 compromise resistance to Cucumber mosaic virus, but differentially suppress hypersensitive response-like cell death. Plant Mol Biol 2006;62:669-682.
40. Desbiez C, Chandeysson C, Lecoq H. A short motif in the N-terminal part of the coat
protein is a host-specific determinant of systemic infectivity for two potyviruses. Mol Plant
Version postprint
41. García-Castillo S, Marcos JF, Pallas V, Sanchez-Pina MA. Influence of the plant
growing conditions on the translocation routes and systemic infection of carnation mottle virus in Chenopodium quinoa plants. Physiol Mol Plant Pathol 2001;58:229-238.
42. R Core Team. R: A language and environment for statistical computing. R Foundation
for Statistical Computing, Vienna, Austria; http://www.R-project.org/; 2013.
43. Chao A, Gotelli NJ, Hsieh T.C, Sander E.L, Ma KH et al. Rarefaction and
extrapolation with Hill numbers: a framework for sampling and estimation in species diversity studies. Ecological Monographs 2014;84:45–67.
44. Watson L, Dallwitz MJ. The families of angiosperms: automated descriptions, with
interactive identification and information retrieval. Austral Syst Bot 1991;4:601-695
45. Watson L, Dallwitz MJ. The families of flowering plants: Descriptions, illustrations,
identification and information retrieval; URL ftp://www.keil.ukans.edu/pub/delta/; 1992.
46. Stevens PF. Angiosperm Phylogeny Website Version 12, July 2012; http://www.mobot.org/MOBOT/research/APweb/; 2012.
47. Flores CO, Valverde S, Weitz JS. Multi-scale structure and geographic drivers of
cross-infection within marine bacteria and phages. ISME J 2013;7:520–532.
48. Moury B, Janzac B, Ruellan Y, Simon V, Ben Khalifa M et al. Interaction patterns
between Potato virus Y and eIF4E-mediated recessive resistance in the Solanaceae. J Virol 2014;88:9799-9807.
49. Hillung J, Cuevas JM, Valverde S, Elena SF. Experimental evolution of an emerging
plant virus in host genotypes that differ in their susceptibility to infection. Evolution 2014;68:2467-2480.
Version postprint
Table 1. Mean host range breadth of groups of plant viruses sharing genome or transmission
properties.
Virus trait [Variable]
Significance* Virus group absHRB N†
Genome type [GEN] <10-15*** ssRNA 16.7 a‡ 384 ssDNA 12.6 a 44 dsDNA 3.9 b 21 dsRNA 3.6 b 31 Genome segments [SEG] 9.3×10⁻⁵*** 3 segments 28.3 a 35 2 segments 15.7 b 109 1 segment 13.5 b 316 >3 segments 10.5 b 20 Vertical transmission [VER] 8.0×10⁻⁵*** seed transmission 20.2 a 140 none 12.8 b 340 Abiotic horizontal transmission 0.005** substrate 22.0 ab 6 contact between plants 16.5 a 61 graft 16.3 ab 80 none 14.4 b 319 tools 10.1 ab 14 Vector type 1.2×10⁻⁴*** thrips 38.3 ab 6
nematode 33.5 a 24 Coleoptera 15.1 ab 42 aphid 14.8 b 168 no vector 14.4 b 120 fungus 11.3 b 24 other Hemiptera 11.1 b 55 whitefly 10.9 b 35 Vector type (arthropods grouped) [VEC] 1.3×10⁻⁴*** nematode 33.5 a 24 no vector 14.4 b 120 arthropod 14.0 b 312 fungus 11.3 b 24 Kind of vector transmission
0.87ns circulative and non-multiplying
16.4 a 80
no vector transmission
Version postprint
circulative and multiplying
14.6 a 28
*P-values of Kruskal-Wallis significance tests are followed by ns, *, **, *** when tests are
non-significant, p-value<0.05, p-value<0.01 and p-value<0.001, respectively.
†
N: number of virus species in the group.
‡
Mean values of absolute host range breadth (absHRB) for each virus group based on a dataset of 480 virus species. Virus groups sharing letters are not significantly different according to Kruskal-Wallis multiple comparisons (p-value>0.05).
Version postprint
Table 2. Statistical significance of nestedness and modularity in a 37 virus species × 28 plant
species infectivity matrix.
Analysis Algorithm 100 B × 1000 B* 100 B × 1000 PD 100 PD × 1000 B 100 PD × 1000 PD Nestedness binmatnest2† <10-5‡ <10-5 <10-5 <10-5 NODF2† <10-5 <10-5 <10-5 <10-5 wine† <10-5 <10-5 <10-5 <10-5 Modularity leading.eigenvector.community† 0.078 0.049 0.037 0.023 spinglass.community† 0.021 0.008 0.013 0.006
* Models used to fill missing data in the infectivity matrix (100 simulations) and to compare
them to null hypotheses for statistical assessment (1000 simulations) [18]. B: Bernoulli model; PD: Probabilistic degree model.
†
R functions used to estimate nestedness or modularity.
‡P-values corresponding to the frequency of null model simulations (over 105) showing higher
Version postprint
Fig. 1: Conditional inference regression trees modelling the host range breadth (HRB) of plant viruses with four explanatory variables representing major virus biological
properties. (a). Absolute host range breadth (absHRB) using a dataset of 480 virus species.
(b). Relative host range breadth (relHRB) using a dataset of 293 virus species. Explanatory
variables were the genome nature of viruses (variable ‘GEN’; 4 categories: ssrna, ssdna,
dsrna, dsdna; see Methods section), their number of genome segments (variable ‘SEG’, 4
categories: one, two, three, >3), the mode of vertical transmission (variable ‘VER’, 2
categories: seed, no) and the vector type (arthropods were grouped) (VEC). Trees should be
interpreted by starting at the top, following each branch down from each node, to arrive to a
terminal node. For each terminal node, boxplots of host range breadths are represented and
Version postprint
Fig. 2: Comparison of the diversity of plant taxa in the host and/or non-host species groups of viruses. Mean of Hill numbers of orders q=0 to q=3 corresponding to the diversity
of host species averaged for all virus species at different plant taxonomic ranks. For each q
order, means of Hill numbers were compared between plant taxonomic levels by a
Kruskal-Wallis multiple test. Plant taxonomic levels sharing letters are not significantly different for a
given q order. Taxonomic rank X was based on plant phylogeny and contains Eurosids I and
II, Euasterids I and II, Commelinids, Asparagales, Liliales, Caryophyllales, Alismatales,
Ranunculales, Proteales, Buxales, Cycadales, Dioscoreales, Polypodiales, Saxifragales,
Version postprint
Fig. 3: Evidence of nestedness (a) and modularity (b) in a 37 virus species × 28 plant species infectivity matrix. The two matrices correspond to the same dataset after permutation
of lines and columns. Black boxes correspond to hosts (infection) and white boxes to
non-hosts (no infection). Gray boxes correspond to missing data. Modularity analyses allowed
identifying three modules (delineated by gray lines), partially associated with three plant
families.
Module 1 contained the following plant species: Trifolium repens, Trifolium incarnatum,
Solanum tuberosum, Lactuca sativa, Brassica campestris, Glycine max, Pisum sativum, Vicia faba, Vigna unguiculata, Cucumis sativus and Phaseolus vulgaris, and the following virus
species: BWYV (beet western yellows polerovirus), AMV (alfalfa mosaic alfamovirus), CMV
(cucumber mosaic cucumovirus), TRSV (tobacco ringspot nepovirus), TSV (tobacco streak
ilarvirus), SLRSV (strawberry latent ringspot sadwavirus), TRV (tobacco rattle tobravirus),
BCTV (beet curly top curtovirus), PSV (peanut stunt cucumovirus), RCNMV (red clover
necrotic mosaic dianthovirus), TBRV (tomato black ring nepovirus), SMV (soybean mosaic
potyvirus) and ClYMV (clover yellow mosaic potexvirus).
Module 2 contained the following plant species: Cucurbita pepo, Chenopodium album,
Spinacia oleracea, Tetragonia tetragonioides, Beta vulgaris, Gomphrena globosa, Chenopodium amaranticolor and Chenopodium quinoa, and the following virus species:
CarMV (carnation mottle carmovirus), OkMV (okra mosaic tymovirus), CVMoV (carnation
vein mottle potyvirus), ArMV (arabis mosaic nepovirus), HLV (heracleum latent vitivirus),
TuMV (turnip mosaic potyvirus), BtMV (beet mosaic potyvirus), CymRSV (cymbidium
ringspot tombusvirus), PFBV (pelargonium flower break carmovirus), TNV-A (tobacco
Version postprint
S), PSbMV (pea seedborne mosaic potyvirus), SqMV (squash mosaic comovirus), BNYVV
(beet necrotic yellow vein benyvirus) and CPMMV (cowpea mild mottle carlavirus).
Module 3 contained the following plant species: Nicotiana tabacum, Nicotiana glutinosa,
Nicotiana clevelandii, Lycopersicon esculentum, Petunia x hybrida, Zinnia elegans, Nicotiana rustica, Physalis floridana and Datura stramonium, and the following virus species: TEV
(tobacco etch potyvirus), CVB (chrysanthemum B carlavirus), SPMMV (sweet potato mild
mottle ipomovirus), RMV (ribgrass mosaic tobamovirus), PopMV (poplar mosaic carlavirus),
PTV (peru tomato mosaic potyvirus), PVMV (pepper veinal mottle potyvirus) and PhyMV
Version postprint
Method S1. Determination of a virus subset with a good compromise between the precision of host range breadth (HRB) estimates and number of remaining viruses.
In the VIDE database, the total number of assayed plant species (i.e. plant species for which
the host or non-host status is known) varies greatly among virus species and can be small for
some. Consequently, for those latter viruses the absolute host range breadth (absHRB),
corresponding to the total number of reported host species is an imprecise estimate of HRB.
To take into account the total number of plant species assayed for each virus, we used the
relative host range breadth (relHRB), i.e. the absHRB divided by the total number of assayed
plant species. When the number of assayed plant species increases, so does the precision of
HRB estimates, and absHRB and relHRB tend to be equivalent (see Figure below). The
coefficient of correlation between absHRB and relHRB is therefore an indicator of the
precision of HRB estimates. Accordingly, a global increase of , the Spearman’s coefficient
of correlation between absHRB and relHRB, is observed as the total number of assayed plant
species increases and corresponds to a decreasing number of viruses remaining in the dataset.
Note however that when the number of assayed plant species becomes high (>50), the number
of remaining virus species is too low for a precise estimation of the coefficient of correlation
between relHRB and absHRB. A minimal threshold of plant species number was noticeable
(~15 plant species) beyond which the increase of became smaller per additional plant
species, corresponding to a change of slope of the linear regression between and the number
of remaining virus species in the dataset (see Figure below). Consequently, this threshold of
15 plant species corresponds to a good compromise between the precision of HRB estimation
(=0.74) and the number of virus species remaining in the dataset (293 species). Therefore,
the relHRB was analyzed only for the restricted set of viruses (293 species) for which a
293-Version postprint
virus dataset but also for more exhaustive datasets (Table 1; Suppl. Table S1). Globally, we
expect more precision from the 293-virus dataset but more statistical power for more
exhaustive datasets, especially for underrepresented virus groups (for example viruses with a
Version postprint
Method S2.
Tentative models for the prediction of plant virus host range breadth
We defined an ordinal variable, Class_absHRB, ordering the 480 virus species in the database
into three equilibrated classes of increasing absHRB: class 1 (1 to 5 hosts; 145 virus species),
class 2 (6 to 15 hosts; 170 species), and class 3 (>15 hosts; 165 species). We then fitted and
analyzed the performance of a cumulative link model with a logit link explaining
Class_absHRB as a function of the four main viral properties found significant (VEC, SEG,
VER, GEN). The model only included the main effects of these four explanatory variables
without any interaction (most interaction parameters could not be estimated). The model was fitted with the function “clm” of the package “ordinal” in the R software version 3.0.2. The predictive performance of the model was evaluated by cross-validation tests. In these tests, we
randomly left out 10% of the virus species (48 species), fitted the model to the remaining
dataset (432 species) and determined the confusion matrix of the 48 left-out virus species for
the 3 classes of absHRB, i.e. a two dimension contingency table (“actual” and “predicted”)
with the numbers of false positives, false negatives, true positives and true negatives. These
steps were iterated 500 times. The predictive performance of the model was summarized by
the average sensitivity, specificity, positive predictive value and negative predictive value for
each absHRB class. These indices were calculated with the ‘confusionMatrix’ function of the ‘caret’ package in the R version 3.0.2 software, using the approach "one level versus all". The sensitivity is the probability that the model classifies in class ci of absHRB (1≤ i ≤3) a virus
that belongs effectively to class ci. The specificity is the probability that the model does not
classify in class ci a virus that is effectively not in class ci. The positive predictive value
(PPV) is the probability that a virus classified in class ci by the model is indeed in class ci (i.e.
Version postprint
a virus not classified in class ci by the model is indeed not in class ci (i.e. true negative results
of the model). Over the 500 cross-validations realized, the overall accuracy (i.e. the overall
rate of correct assignments to absHRB classes by the model) was 0.48. It should be compared
to a no-information rate of 0.33 (proportion of correct assignments obtained by choosing a
class randomly) or 0.35 (proportion of correct assignments obtained by choosing the most
frequent class in the dataset). The detailed analysis for each absHRB class is provided in the
table below. Focusing on the two extreme classes, the specificity of the model was high (0.92
and 0.79 for classes 1 and 3, respectively) but its sensitivity lower (0.36 and 0.47 for classes 1
and 3, respectively). Sensitivity and specificity measures can be combined with the
prevalence of the three absHRB classes, i.e. their proportion in the cross-validation datasets,
to estimate the positive predictive value (PPV) and negative predictive value (NPV) of the
model (i.e. the proportions of true positive and true negative results). Accordingly, the
probability that a virus classified in class 1 (or 3) by the model belongs truly to class 1 (or 3)
is 0.65 (respectively 0.55). The probability that a virus not classified in class 1 (or 3) by the
model does truly not belong to this class is 0.77 (respectively 0.74). These figures should be
compared to the ones obtained with a baseline random classifier (i.e. a classifier choosing an
absHRB class randomly), indicated in brackets in the table below.
Model performance index for host species
absHRB class Prevalence Sensitivity Specificity PPV NPV
Class1: 1 to 5 hosts 0.3 0.36 (0.33) 0.92 (0.67) 0.65 (0.3) 0.77 (0.7)
Class 2: 6 to 15 hosts 0.35 0.6 (0.33) 0.5 (0.67) 0.4 (0.35) 0.69 (0.65)
Version postprint
Next, we tested how the model performance changes if classes 2 and 3 are grouped. We
defined a new binary ordinal variable (TwoClass_absHRB) with two classes of increasing
absHRB: class 1 (1 to 5 hosts; 145 virus species) and class 2 (>5 hosts; 335 species). We then
used the same analysis framework. The overall accuracy of this model was 0.75 that should be
compared to a no-information rate of 0.5. The specificity of the model was high (0.95) but its
sensitivity was low (0.3). The PPV and NPV were of 0.73 and 0.76, respectively. Finally we
estimated the area under the Receiver Operating Characteristic curve associated to this binary
predictor using the package pROC. This area (AUC) also measures the accuracy of a binary
predictor. It ranges from 0.5 (no discrimination between the 2 classes of absHRB) to 1
(perfect discrimination). The AUC was estimated to 0.73 with a 95% confidence interval
ranging from 0.68 to 0.78.
The same analyses were performed to predict the diversity of host genera and families (Hill
numbers of order q=2, Hillgen and Hillfam, respectively; see Methods section). We defined the
ordered variable Class_Hillgen with the following three equilibrated classes of increasing
diversity of host genera: class 1 (Hillgen < 3.33; 156 virus species), class 2 (3.33 ≤ Hillgen ≤
7.25; 160 species), and class 3 (Hillgen > 7.25; 164 species). Similarly we defined the ordered
variable Class_Hillfam with the following three equilibrated classes of increasing diversity of
host families: class 1 (Hillfam < 1.19; 159 virus species), class 2 (1.19 ≤ Hillfam ≤ 2.9; 158
species), and class 3 (Hillfam > 2.9; 163 species). The overall rate of correct assignments by
the model was slightly lower (0.45) for Hillgen and slightly higher (0.53) for Hillfam than for
absHRB (0.48). These values should be compared to a no-information rate of 0.33 (proportion
of correct assignments obtained by choosing a class randomly). The detailed predictive
Version postprint
Model performance index for the diversity of host genera
Hillgen class Prevalence Sensitivity Specificity PPV NPV
Class1: < 3.33 0.32 0.36 (0.33) 0.86 (0.67) 0.55 (0.33) 0.74 (0.67)
Class 2: 3.33 to 7.25 0.33 0.55 (0.33) 0.51 (0.67) 0.36 (0.33) 0.69 (0.67)
Class 3: > 7.25 0.34 0.46 (0.33) 0.82 (0.67) 0.57 (0.33) 0.75 (0.67)
Model performance index for the diversity of host families
Hillfam class Prevalence Sensitivity Specificity PPV NPV
Class1: < 1.19 0.33 0.45 (0.33) 0.91 (0.67) 0.71 (0.33) 0.77 (0.67) Class 2: 1.19 to 2.9 0.32 0.59 (0.33) 0.54 (0.67) 0.38 (0.33) 0.73 (0.67)