HAL Id: hal-02992310
https://hal.archives-ouvertes.fr/hal-02992310
Submitted on 7 Nov 2020
HAL is a multi-disciplinary open access
archive for the deposit and dissemination of
sci-entific research documents, whether they are
pub-lished or not. The documents may come from
teaching and research institutions in France or
abroad, or from public or private research centers.
L’archive ouverte pluridisciplinaire HAL, est
destinée au dépôt et à la diffusion de documents
scientifiques de niveau recherche, publiés ou non,
émanant des établissements d’enseignement et de
recherche français ou étrangers, des laboratoires
publics ou privés.
High throughput error corrected Nanopore single cell
transcriptome sequencing
Kevin Lebrigand, Virginie Magnone, Pascal Barbry, Rainer Waldmann
To cite this version:
Kevin Lebrigand, Virginie Magnone, Pascal Barbry, Rainer Waldmann. High throughput error
cor-rected Nanopore single cell transcriptome sequencing. Nature Communications, Nature Publishing
Group, 2020, 11 (1), �10.1038/s41467-020-17800-6�. �hal-02992310�
High throughput error corrected Nanopore single
cell transcriptome sequencing
Kevin Lebrigand
1
✉
, Virginie Magnone
1
, Pascal Barbry
1
✉
& Rainer Waldmann
1
✉
Droplet-based high throughput single cell sequencing techniques tremendously advanced our
insight into cell-to-cell heterogeneity. However, those approaches only allow analysis of one
extremity of the transcript after short read sequencing. In consequence, information on
splicing and sequence heterogeneity is lost. To overcome this limitation, several approaches
that use long-read sequencing were introduced recently. Yet, those techniques are limited by
low sequencing depth and/or lacking or inaccurate assignment of unique molecular
identi-fiers (UMIs), which are critical for elimination of PCR bias and artifacts. We introduce
ScNaUmi-seq, an approach that combines the high throughput of Oxford Nanopore
sequencing with an accurate cell barcode and UMI assignment strategy. UMI guided error
correction allows to generate high accuracy full length sequence information with the 10x
Genomics single cell isolation system at high sequencing depths. We analyzed transcript
isoform diversity in embryonic mouse brain and show that ScNaUmi-seq allows de
fining
splicing and SNVs (RNA editing) at a single cell level.
https://doi.org/10.1038/s41467-020-17800-6
OPEN
1Université Côte d’Azur, CNRS, Institut de Pharmacologie Moléculaire et Cellulaire, F06560 Sophia Antipolis, France. ✉email:[email protected];
[email protected];[email protected]
123456789
S
ingle-cell RNA sequencing (scRNA-seq) is a key technique
for the analysis of cell-to-cell heterogeneity and projects
aiming at analyzing the transcriptome of all cells from
complex organisms have been initiated (e.g., Human Cell Atlas
1,
Tabula Muris
2). While droplet-based high throughput scRNA-seq
approaches (e.g., 10xGenomics Chromium) allow the analysis of
thousands of cells, they only yield limited sequence information
close to one extremity of the transcript after Illumina short-read
sequencing. Information crucial for an in-depth understanding of
cell-to-cell heterogeneity on splicing, chimeric transcripts and
sequence diversity (SNPs, RNA editing, imprinting) is lacking.
Long-read sequencing can overcome this limitation. Several
studies used Pacific Biosciences (PacBio) or Nanopore long-read
sequencing to obtain full-length single-cell data with the 10x
Genomics Chromium system. Gupta et al.
3reported PacBio
single-cell sequencing of 6627 cells. However, due to the low
PacBio sequencing throughput, the sequencing depth was rather
low (270 reads, 260 UMI, 129 genes per cell). Such a low depth
limits analysis to highly expressed transcripts. Oxford Nanopore
PromethION long-read sequencers generate 20 times more reads
per
flow cell than the PacBio Sequel II. The first Nanopore
sequencing of 10x Genomics single-cell libraries was a targeted
sequencing of antigen receptors in lymphocytes
4. To assure
cor-rect barcode assignment, both studies used high accuracy
Illu-mina sequencing data of the same libraries to guide cell barcode
(cellBC) assignment to long reads. Volden et al.
5recently
pre-sented a Nanopore sequencing approach with undisclosed
bar-code assignment accuracy, that does not require Illumina data for
cellBC assignment.
Single-cell sequencing library preparation requires rather
strong PCR amplification. Amplification bias and chimeric cDNA
generated during PCR amplification are issues that can be both
addressed by unique molecular identifiers (UMIs), short random
sequence tags that are introduced during reverse transcription.
UMIs allow grouping of reads that correspond to same RNA
molecule and elimination of PCR artifacts. In consequence UMIs
minimize the risk that PCR generated chimeric cDNAs are falsely
annotated as novel transcripts. Furthermore, UMIs allow the
generation of error-corrected consensus sequences for each RNA
molecule. Obviously, accuracy of UMI assignment is crucial.
Previous long-read single-cell sequencing approaches either did
not use UMIs
4or did not correct UMI sequencing errors
3,5. They
assigned every novel UMI read sequence to a novel UMI.
How-ever, with this strategy, the higher sequencing error rate of
long-read sequencers causes serious issues. PacBio sequencers have a
circular consensus error rate of about 1%. In consequence, about
10% of the 10 nt. UMI reads are expected to have at least one
error. Fake UMIs are an even more serious issue with the higher
Nanopore sequencing error rate of 5–8%. For 45% of the UMIs
identified by Nanopore sequencing, Volden et al.
5could not
find
a corresponding UMI in the Illumina dataset of the same sample.
The authors suggest that at least one-third of the UMIs were
mis-assigned with their strategy due to Nanopore sequencing errors.
We addressed those issues and designed a long-read single-cell
sequencing approach that combines the high throughput of
Nanopore sequencing with high accuracy cellBC and UMI
assignment. Our approach, entitled ScNaUmi-seq (Single-cell
Nanopore sequencing with UMIs), enables the analysis of splicing
and sequence variation at the single-cell level with the 10x
Genomics Chromium system. This is illustrated with data on
alternative splicing and RNA editing in embryonic mouse brain.
Results and discussion
Assignment of cell barcodes and unique molecular identi
fiers
to Nanopore reads. We prepared a 190 cell and a 951 cell E18
mouse brain library with the 10x Genomics Chromium system
and generated 43 × 10
6and 70 × 10
6Illumina reads
(Supple-mentary Fig. 1) as well as 32 × 10
6and 322 × 10
6Nanopore reads
for the 190 and 951 cell replicates, respectively.
Since cellBCs and UMIs are located between a 3′ PCR priming
site (adapter) and the polyA-tail of the cDNA (Supplementary
Fig. 2b) we
first searched for a >20 nt. sequence with at least 17
As within 100 nucleotides from the end of the read and then for
the adapter downstream of the poly(A) tail. We identified both
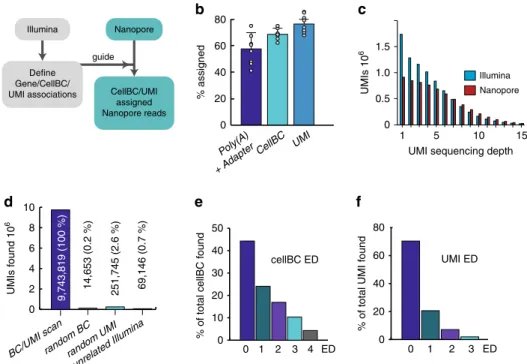
the poly(A) tail and the adapter in 57 ± 11% of the reads (Fig.
1
b).
This initial scan removed most of the low quality (QV < 10) and
non genome-matched reads (Supplementary Fig. 3a–e).
To ensure highly accurate barcode assignment, we used a
strategy where barcodes assignment is guided with Illumina data.
We
first extracted for each gene and genomic region (500 nt.
windows) the barcodes detected in the Illumina short-read data.
We then compared the cellBC sequence extracted from each
genome aligned Nanopore read with the cell barcodes found in
the Illumina data for the same gene or genomic region. Following
this strategy, we assigned cellBCs to 68 ± 4% of Nanopore reads
with identified poly(A) and adapter sequence (Fig.
1
b;
Supple-mentary Fig. 3a, c; see methods section for details).
The poly(A) and cellBC discovery rates of our approach are,
despite the higher error rates of Nanopore reads, similar to those
reported previously for PacBio sequencing of 10x Genomics
libraries
3.
Molecular barcoding with UMIs facilitates elimination of PCR
artifacts and sequencing error correction (Supplementary Fig. 4).
Yet, high accuracy assignment of UMIs to long reads is
challenging and was not reported as for yet. The principle
reasons are: (i) long reads, in particular Nanopore reads, have a
far higher error rate than Illumina reads. With a median
Nanopore accuracy below 95%, more than half of the 10 nt.
UMI reads are expected to have at least one error. (ii) Even at a
high sequencing saturation, the majority of UMIs is covered by
just a few reads (Fig.
1
c). Clustering such unprecise UMI
sequences with just a few reads per UMI is rather error prone. To
avoid widespread UMI misassignment to Nanopore reads as
reported by others
5, we designed a UMI assignment strategy that
is guided by Illumina high accuracy sequencing data. After
assignment of the cellBC to the Nanopore read, we compared the
Nanopore UMI read sequence with the UMI sequences found for
the same gene (or genomic region) and the same cell in the
Illumina sequencing data (see methods section for details). This
strategy drastically reduces the complexity of the UMI search set,
which corresponds to the number of transcripts molecules
captured for a given gene or genomic region in one cell. Using
this strategy, we assigned UMIs to 76 ± 3% of the reads with
identified cellBC (Fig.
1
b).
We next examined the accuracy of our cellBC and UMI
assignment strategy. We replaced either the cellBC or the UMI
sequence in each Nanopore read by a random sequence
and examined the number of cellBC and UMI assigned reads
(see methods section for details). The accuracy (100*(1
−assigned
random/assigned)) of both cellBC and UMI
assign-ment were 99.8% and 97.4%, respectively (Fig.
1
d). We also
examined the precision of cellBC and UMI assignment with a
second strategy where we compared the number of cellBC and
UMI assigned reads obtained with the Illumina dataset of the
same and of another unrelated 885 cell mouse brain sample.
We found 140 times less cellBC and UMI assigned reads with
the unrelated Illumina data, suggesting a combined cellBC/
UMI assignment accuracy of 99.3%. The accuracy is likely
higher since cellBCs and UMIs were found at higher edit
distances (ED) with the unrelated Illumina dataset (mean ED:
cellBCs, 3.01; UMIs, 2.28; n
= 38,310) than with the short-read
data of the same sample (mean ED: cellBCs, 1.05; UMIs, 0.51;
n
= 1,841,442).
To evaluate whether the additional cycles of full-length PCR
amplification (see “Methods” section) or Nanopore library
preparation skew the long-read dataset, we compared the cellBC
and UMI assigned Nanopore data to the Illumina data of the
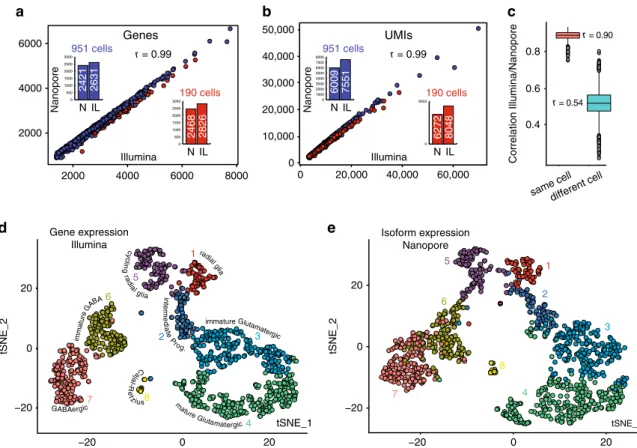
same sample. On average, 79% of the RNA molecules (UMIs) and
91% of the genes identified in each single cell after Illumina
sequencing were also found in our Nanopore dataset (Fig.
2
a, b).
The cellBC and UMI assigned Nanopore reads (median 28,120
/cell) reflect a median of 2427 genes and 6047 UMIs per cell with
a good correlation between Nanopore and Illumina gene counts
(Fig.
2
a; r
= 0.99), UMI counts (Fig.
2
b; r
= 0.99) and gene
expression for individual cells (Fig.
2
c, mean r
= 0.90). In
consequence, our cellBC and UMI assigned Nanopore dataset
represents well the transcriptome captured in the 10x Genomics
workflow.
Identi
fication of transcript isoforms in full-length E18 mouse
brain transcriptome. We next analyzed the transcript isoforms in
our long-read dataset. In total we found 33,002 Gencode vM18
annotated transcripts where all annotated exon-exon junctions
were supported by at least one UMI. It was recently suggested
that single cells tend to express dominantly one transcript isoform
of a gene
6. While we noticed this for certain genes (e.g., Pkm), we
also found many instances of well-expressed genes showing
expression of several isoforms in a single cell (Supplementary
Fig. 5).
We also identified 4388 novel isoforms in our dataset
(Supplementary Fig. 6, Supplementary Data 2, Supplementary
Data 3). We required that novel transcript isoforms: (i) are
backed by at least
five UMIs; (ii) have all splice junctions
confirmed in a mouse brain Illumina short-read dataset; (iii) have
a 5′ end within 50 nt. from CAGE-seq identified transcription
start site; (iv) have a polyadenylation site within 50 nt. of the
transcript 3′ end (see methods section and Supplementary Note
for details). Globally, the novel isoforms were detected at far
lower levels (Gencode: median 3795 UMIs/cell; novel: 60 UMIs/
cell) than Gencode isoforms suggesting that some of those novel
isoforms might reflect a certain leakiness of the splicing or
transcription machinery.
A t-SNE plot of the Illumina short-read gene expression data
reveals typical cell types for E18 mouse brain (Fig.
2
d). t-SNE
projection of transcript isoform expression defined by Nanopore
sequencing (Fig.
2
e) yielded a similar clustering without revealing
novel well-defined sub-clusters. Globally, the isoform-based
clustering was more diffuse than the gene-based clustering. This
is likely due to: (i) a split of the UMIs for a given gene in a cell
between several isoforms (16,612 genes vs. 33,002 isoforms). This
results in globally lower isoform counts and a higher dropout rate
(cells with zero UMIs for a given isoform). (ii) Only 63.6% of the
UMIs could be assigned to exactly one transcript isoform,
resulting in a further reduction of isoform UMI counts (Illumina:
median 7605 UMIs/cell; nanopore: median 6047 geneUMIs/cell,
3795 isoformUMIs/cell).
In two independent technical replicates, the 951 cell and the
190 cell datasets, the corresponding clusters correlated well in
gene expression based on either Illumina or Nanopore data and
in isoform expression deduced from Nanopore data
(Supple-mentary Fig. 7).
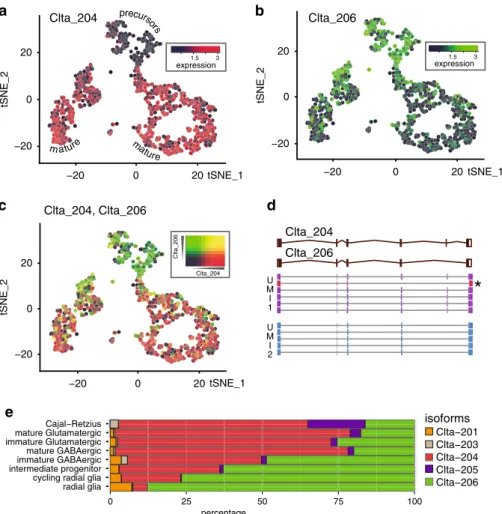
We next searched for genes with a transcript isoform
expression that differed between clusters. We noticed cell-type
selective isoform usage for 76 genes and 174 differentially
expressed isoforms (Supplementary Data 1, Supplementary
Fig. 8b). For instance, Clathrin light chain A (Clta) (Fig.
3
a–d)
and Myosin Light Chain 6 (Myl6; Supplementary Fig. 9) undergo
CellBC/UMI assigned Nanopore reads Illumina Define Gene/CellBC/ UMI associations Nanopore guide % of t o tal UMI f o und UMI EDe
f
% of t o tal c e llBC f ound 0 cellBC ED 0 10 20 30 40 50 1 2 3 4 ED 0 0 20 40 60 80 1 2 3 ED 0 0.5 1.0 1.5 1 5 10 15 UMI sequencing depthIllumina Nanopore UMIs 10 6
c
a
b
d
UMI CellBC Poly( A) + Adapter % assig ned 0 20 40 60 80 0 2 4 6 8 10 UMIs f o und 10 6 9,743,819 (100 %) 14,653 (0.2 %) 251,745 (2.6 %) 69,146 (0.7 %)random BCrandom UMI BC/UMI scan
unrelated I llumina
Fig. 1 Efficiency and accuracy of cellBC and UMI assignment. a CellBC and UMI assignment strategy (Detailed in Supplementary Fig. 2). b Efficiency of
cellBC and UMI identification for eight PromethION sequencing runs (n = 8): both poly(A) and adapter, 57 ± 11% (SD) of total reads; cellBC, 68 ± 4% (SD)
of reads with identified poly(A) and adapter; UMI, 76 ± 3% (SD) of reads with identified cellBC. Boxes and error bars indicate the means and standard
deviations, respectively, forn = 8 flow cells. c UMI sequencing depth (reads/UMI) for the Illumina and Nanopore dataset. d Accuracy of cellBC and UMI
assignment. Number of cellBC and UMI assigned reads before and after replacement of cellBC or UMIs with random sequences and after cellBC and UMI
identification guided by an unrelated Illumina dataset (24 × 106reads of the 190 cell sample were scanned).e, f Edit distance distribution of the cellBC and
a pronounced isoform switch during neuronal maturation.
Myosin and Clathrin are involved in neuronal migration and
axonal guidance
7,8and in synaptic membrane recycling
9and
synaptic remodeling
10associated with synaptic plasticity in
mature neurons. The isoform switch of Clta and Myl6 might
fine-tune both proteins for their respective roles at different
developmental stages.
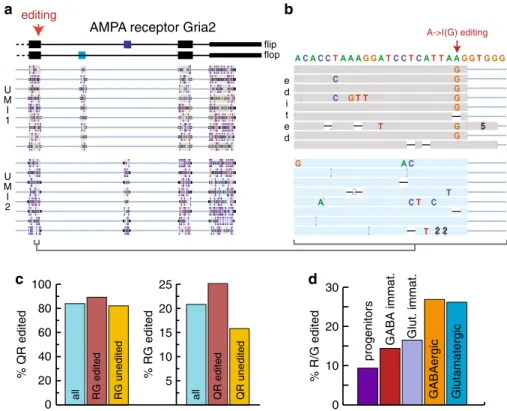
ScNaUmi-seq can detect SNVs. We next examined how
single-cell Nanopore sequencing with UMIs (ScNaUmi-seq) performs in
defining SNVs for the ionotropic glutamate receptor Gria2, a
post-synaptic cation channel that is A- > I edited at two sites,
leading to a Q/R substitution within the pore that renders the
channel Ca
2+impermeable and a R/G substitution within the
ligand-binding domain that results in accelerated recovery from
activation
11,12. UMIs allow addressing the principle weakness of
Nanopore sequencing, the low accuracy. Generation of consensus
sequences for single RNA molecules (UMIs) allows boosting the
Nanopore sequencing accuracy from 93% to beyond 99%
(Sup-plementary Fig. 4b, c) and identification of such sequence
het-erogeneity at a single-cell resolution (Fig.
4
a, b). Analysis of
error-corrected Gria2 consensus sequences confirmed previous
find-ings
11that Gria2 editing (Fig.
4
c) is almost complete at the Q/R
editing site (83.8%) and partial at the R/G editing site (20.8%) in
E18 mouse brain. Long-read sequencing further revealed that
editing of one site increases the probability that the other site is
edited (Fig.
4
c) and that editing of the R/G site increases during
neuronal maturation (Fig.
4
d) from 9.3% in neuronal progenitors
to 26.7 and 26% in mature inhibitory and glutamatergic neurons
respectively. Thus, single-cell long-read sequencing both confirms
and extends previous knowledge on Gria2 editing in the central
nervous system.
Combining the high throughput of Nanopore sequencing with
UMI guided error correction thus allows both high confidence
definition of transcript isoforms and identification of sequence
heterogeneity in single cells.
Accurate cellBC and in particular UMI assignment is crucial in
single-cell sequencing. To achieve this, we opted for an approach
that is guided by Illumina data. While this requires additional
short-read sequencing, this strategy has multiple advantages. (i)
We achieve a cellBC assignment accuracy that is, despite the
higher error rate of Nanopore reads, comparable to that
previously reported for PacBio reads
3. (ii) This is the
first
approach that enables accurate UMI assignment to long reads.
(iii) The additional short-read dataset of the same sample
provides a quality control that allows detecting bias introduced
by the additional amplification of full-length cDNA during
Nanopore library preparation.
One principal advantage of our approach is the accurate UMI
assignment. The use of UMIs is even more important for long
read than for short-read sequencing. Chimeric cDNA generated
during PCR amplification is not an issue in short-read sequencing
when only one extremity of the cDNA is sequenced. Conversely,
PCR artifacts can severely affect the quality of long-read
sequencing data. UMIs allow elimination of most of those PCR
artifacts (Supplementary Fig. 4a). This will be particularly
important for the identification of rare chimeric transcripts in
single-cell studies of tumor heterogeneity.
10,000 20,000 30,000 40,000 50,000 0 0 20,000 40,000 60,000 r = 0.99 UMIs Nanopor e Illumina 0 1000 2000 3000 4000 5000 6000 7000 8000 N IL 951 cells 0 9000 N IL 190 cells 6009 7551 6272 8048 r = 0.99 2000 4000 6000 2000 4000 6000 8000 Illumina Nanopor e Genes 0 500 1000 1500 2000 2500 3000 N IL 951 cells 0 500 1000 1500 2000 2500 3000 N IL 190 cells 2421 2631 2468 2826 −20 0 20 −20 0 20 tSNE_2 tSNE_1 Gene expression Illumina cy c lin g rad ia l glia 5 rad ialgli a 1 in te rm e d ia te Pro g. 2 Glutam atergic 3 m atu re G lutamatergic4 C aja l-R e t zius8 GAB A GABAergic 6 7 −20 0 20 tSNE_1 −20 0 20 tSNE_2 Isoform expression Nanopore 2 1 3 6 5 8 7 4
d
e
a
b
c
r = 0.54 0.4 0.6 0.8 Correlation Illumina/Nanopore same cell different cell r = 0.90 imm atu re immatureFig. 2 Comparison of Nanopore long read with short-read scRNA-seq. Number of genes a and number of UMIs b detected for each cell of the 190 and
951 cell datasets after Illumina and Nanopore sequencing. Median genesa and UMIs b per cells for both datasets are shown in the histograms.
c Correlation of gene expression between Illumina and Nanopore sequencing data for each cell. Boxes represent the 25% quantile to 75% quantile range,
upper and lower edges of notches are median+/− 1.58 * IQR/sqrt(n) (IQR: inter quantile range, n = 1121). t-SNE plots of Illumina gene expression d and
Nanopore isoform expressione for 1121 cells (integration of the 190 and 951 cell datasets). Colors for individual cells are the same in d and e. Clustering
details are in Supplementary Fig. 8 and Supplementary Data 1.
In conclusion, ScNaUmi-seq can be easily plugged into
standard single-cell sequencing workflows and should facilitate
high throughput single-cell studies on RNA splicing, editing, and
imprinting. We anticipate its usefulness in many biological and
medical applications, from cell biology and development to
clinical analyses of tumor heterogeneity.
Methods
Mouse brain dissociation. A combined hippocampus, cortex, and ventricular zone pair from an E18 C57BL/6 mouse was obtained from BrainBits LLC (Leicestershire, UK). A single-cell suspension was prepared following the
10x Genomics protocol for“Dissociation of Mouse Embryonic Neural
Tissue”. Briefly, tissues were incubated with 2 mg/ml Papain in calcium free Hibernate E medium (BrainBits) for 20 min at 37 °C, rinsed with
Hiber-nate-E/B27/GlutaMAX (HEB) medium, triturated andfiltered through a 40 µm
FlowMi cell strainer (Sigma-Aldrich). Cell concentration and viability
were determined with a Countess®II automated cell counter (Life
Technologies).
Single-cell cDNA library preparation. The E18 mouse brain single-cell sus-pension was converted into a barcoded scRNA-seq library with the 10x Genomics Chromium Single Cell 3′ Library, Gel Bead & Multiplex Kit and Chip
Kit (v2), aiming for 1400 cells following the manufacturer’s instructions with
the following modifications: To obtain batches with different cell numbers, we split the emulsion before reverse transcription into two aliquots (85.7% and 14.3%; targeting 1200 and 200 cells). We extended the PCR elongation time during the initial PCR amplification of the cDNA from the manufacturer recommended 1 min to 3 min to minimize preferential amplification of small
cDNAs. Half of the amplified cDNA was used for short-read sequencing library
preparation following the 10x Genomics protocol and sequenced on an Illumina
Nextseq 500 sequencer (26bases+ 57bases). We generated 43 M and 70 M
Illumina reads for the samples targeting 200 and 1200 cells respectively and mapped them to the mouse genome (build mm10) with the 10x Genomics Cell Ranger software (v2.0.0).
For each PromethIONflow cell (Oxford Nanopore) we re-amplified 2–10 ng of
the 10x Genomics PCR product for eight cycles with the primers NNNAAGCA GTGGTATCAACGCAGAGTACAT and NNNCTACACGACGCTCTTCCG ATCT (Integrated DNA Technologies, IDT). The Ns at the 5′ end of the primers avoid the preferential generation of reverse Nanopore reads (>85%) we observed without those random nucleotides. Amplified cDNA was purified with 0.65x SPRISelect (alternatively: 0.45x SPRISelect for depletion of cDNA smaller than 1 kb) and Nanopore sequencing libraries were prepared with the Oxford Nanopore LSK-109 kit (PCR free) following the manufacturer’s instructions. For the libraries targeting 200 and 1200 cells, we generated 32 M reads and 322 M reads, respectively.
Optional steps for the depletion of cDNA lacking a terminal poly(A)/poly(T). Amplified single-cell cDNA contains to a variable extend (30–50%) cDNA that lacks poly(A) and poly(T) sequences. For the study presented here, we did not deplete those cDNAs. Such cDNA can be depleted after a PCR of 2–10 ng of the 10x Genomics PCR product for 5 cycles with 5′-NNNAAGCAGTGGTATC AACGCAGAGTACAT-3′ and 5′ Biotine-AAAAACTACACGACGCTCTTC
CGATCT 3′. After 0.55x SPRIselect purification to remove excess biotinylated
primers, biotinylated cDNA (in 40 µl EB) is bound to 15 µl 1x SSPE washed Dynabeads™ M-270 Streptavidin beads (Thermo) resuspended in 10 µl 5x SSPE for 15 min at room temperature on a shaker. After two washes with 100 µl 1x SSPE and one wash with 100 µl EB, the beads are suspended in 100 µl 1x PCR mix and amplified for 6–9 cycles with the primers NNNAAGCAGTGGTATCAACGCA-GAGTACAT and NNNCTACACGACGCTCTTCCGATCT to generate enough material for Nanopore sequencing library preparation.
All PCR amplifications for Nanopore library preparations were done with Kapa
Hifi Hotstart polymerase (Roche Sequencing Solutions): initial denaturation, 3 min
at 95 °C; cycles: 98 °C for 30 s, 64 °C for 30 s, 72 °C for 5 min;final elongation: 72 °C
for 10 min, primer concentration was 1 µM.
*
Clta_206 Clta_204 −20 0 20 −20 0 20 1.5 3 expression precurs ors tSNE_1 tSNE_2 Clta_204 tSNE_1 tSNE_2 0 −20 20 −20 0 20 expression1.5 3 Clta_206 m ature mature Clta_204 Clta_206 −20 0 20 tSNE_2 −20 0 20 U M I 1 U M I 2 tSNE_1 Clta_204, Clta_206a
b
c
d
e
Clta−201 Clta−203 Clta−204 Clta−205 Clta−206 100 75 50 25 0 isoforms percentage Cajal−Retzius radial glia cycling radial glia intermediate progenitor immature GABAergic mature GABAergic immature Glutamatergic mature GlutamatergicFig. 3 Nanopore scRNA-seq reveals transcript isoform diversity. a–c Clta isoform expression switch during neuronal maturation visualized on the t-SNE
plot of Fig.2d.a Clta-204 (ENSMUST00000107849.9), b Clta-206 (ENSMUST00000170241.7), c Overlay Clta-204/Clta- 206. d Principal Clta splice
variants and supporting genome-aligned reads for two UMIs. A read not consistent with the UMI consensus (likely PCR artifact) is labeled with an“*”.
Mapping of Nanopore reads. Nanopore reads were aligned to the Mus musculus Genome (mm10) with minimap2 v2.17 in spliced alignment mode (command: “minimap2 -ax splice -uf -MD -sam-hit-only -junc-bed”). The splice junction bed file was generated from the Gencode vM18 GTF using paftools.js, a companion script of minimap2. For reads matching known genes, the gene name was added to the corresponding SAM record (SAM Tag: GE) using the Sicelore (ScNaUmi-seq companion java toolkit) AddGeneNameTag method. Before cellBC and UMI assignment, SAM records were annotated with their Nanopore read sequence (SAM Tags: US) and read qualities (SAM tag: UQ) using the Sicelore AddBam-ReadSequenceTag method.
CellBC and UMI assignment to Nanopore reads. Our Java software performs the following analysis steps (Supplemantary Fig. 2a):
1. Parsing of Illumina data: To retrieve accurate cellBC and UMI information,
BAMfiles with the cellBC and UMI assigned Illumina data generated by the
10x Genomics Cell Ranger software were parsed. For each gene, we
extracted the cellBC from the Illumina data and identified the UMIs found
for each gene/cellBC combination. We also associated genomic regions (window size 500 nt.) with cellBCs and UMIs to account for reads that match outside of annotated genes. The parsed Illumina data were stored in nested Hash tables as serialized Java objects.
2. Search for poly(A) tail: Our software searches for a poly(T) and a poly(A)
sequence (default 85% A or T,≥20 nt.) within 100 nucleotides from the 5′ or
3′ end of the read, respectively. Reads without poly (A or T) and reads with a
poly(A or T) on both ends are not further analyzed.
3. Search for 3′ adapter sequence: The cellBC and the UMI are located between
an adapter sequence (10x Genomics 3′ PCR priming site) and the poly(T) of
the reverse transcription primer (Supplementary Fig. 2b). To define the position of the cellBC we searched for the adapter sequence between the extremity of the read and the poly(A/T) sequence identified in the previous step using sliding window Needleman Wunsch alignments. The position with the best adapter match (least mismatches) was used. We found that searching for just the ten 3′ nucleotides of the adapter with 3 allowed mismatches (adapter found in 90.4% of the reads with poly(A)) more efficient than a search for a 20 nucleotide adapter sequence with 6 allowed mismatches (79.9% adapter found in poly(A) reads). Possible reasons for
this are (i) The adapter 5′ end is very close to the extremity of the read and
read quality might be lower there. (ii) Intrinsic error rate of Nanopore sequencing might be higher for the 5′ of the adapter sequence.
4. Search for internal adapter and poly(A): Toflag reads corresponding to
chimeric cDNA generated during library preparation, we searched for internal adapter sequences in proximity of a A- or T-rich sequence and flagged those reads as chimeric reads in the output file. In our dataset we found internal adapters in 3.5% of the reads.
5. Search for cellBCs: Cell barcodes in high accuracy Illumina reads are typically assigned by grouping reads that differ by not more than one
position (edit distance: ED= 1). Indels are typically not considered. In
consequence just 48 possible permutations of the 16 nt. cellBC reads need to be analyzed and assignment of reads to a barcode is highly reliable.
Nanopore reads still have a mean error rate of about 5–10% (substitutions
and indels). In consequence higher edit distances need to be examined and indels must be considered. This implies the generation and analysis of
PED
i¼0128ibarcode sequence permutations (2,113,664 for ED= 3) for each
read. A 50 million read PromethION sequencing run would require the
generation and analysis of about 1014barcode sequences for ED= 3. This is
clearly not feasible using reasonable sized compute clusters and standard bioinformatics approaches where sequences are typically treated as text. To solve this computational bottleneck, we encoded the barcode sequences using 2 bits per base (A: 00, G:01, T:10, C:11) which allows encoding of the entire 16 nucleotide cellBC into just one integer. This bitwise encoding allows performing substitutions, insertions, and deletions using highly efficient bitwise operations that require just one CPU cycle. Encoding cellBC and UMIs into integers also tremendously accelerates the search for matching Illumina cellBC or UMIs, since searching for a matching integer is much faster than searching for matching strings. An additional challenge for accurate barcode assignment is that 10x Genomics cellBCs are randomly selected out of a pool of 750,000 barcode sequences. The used barcode sequences are not known in advance. Clustering the Nanopore barcode reads correctly without a priori knowledge of the used barcodes is rather error prone, since two reads that each have e.g., two sequencing errors in the cellBC, can differ in up to four positions when compared to each other. To improve the accuracy of cell barcode assignment, we used the cellBC
sequences defined by Illumina sequencing of the same libraries to guide the
cellBC identification in Nanopore reads. For each genome aligned Nanopore read, we extracted the sequence (16 nt. barcode plus 4 nt. to allow insertion errors) just downstream of the adapter (position corrected for indels in
adapter) identified in the previous step. We also extracted the barcode
sequences for the preceding and following position to account for eventual terminal indels in the adapter read. We then compared the extracted
editing
A->I(G) editing
AMPA receptor Gria2
% R/G edited progenitors Glut. immat. GABA immat. 0 10 20 30 % QR edited % RG edit ed 0 20 40 60 80 100 U ed i t e d flop flip M I 1 U M I 2 5 10 15 20 25 all RG edit ed
RG unedited all QR edited QR unedit
ed Glutamatergic GABAergic
a
c
d
b
5 2 2 2Fig. 4 Nanopore scRNA-seq reveals sequence diversity. a Principal splice variants of Gria2. The 3′ end of genome aligned reads for two UMIs are shown
(Integrated Genome Viewer, UCSC Santa Cruz).b Zoom onto the R/G A- > I editing site for the reads shown in e. c Q/R and R/G editing. Editing rates at
the Q/R site are 89.1 and 82% for RNAs edited or unedited at the R/G site respectively. R/G site editing is 25.1% and 15.8% for Q/R site edited and
unedited RNAs respectively.d Extend of A− > I editing of the R/G site increases during neuronal maturation. Progenitors, 9.3%, clusters 1,2,5 in Fig.2d;
GABA immature, 14.3%, cluster 6; Glutamatergic immature, 16.4%, cluster 3; GABA mature, 26.7%, cluster 7; Glutamatergic mature, 26%, cluster 4.
Nanopore barcode sequences and all possible permutation up to a defined edit distance with: (i) The cellBCs identified by Illumina sequencing for the same gene if the Nanopore read matches a known gene in the Illumina dataset; (ii) Illumina cellBCs sequences for the genomic region (500 nt. window) if the Nanopore read matches an unannotated genomic region or if the gene name was not found in the Illumina data. Since the Nanopore barcodes are only compared with Illumina barcodes found for the same gene or genomic region, the complexity of the search set is reduced. Barcode matches, eventual second-best barcode matches and their quality (edit
distance) were recorded in the output BAM file. The maximal ED is
dynamically selected (ED limit 1–4) and depends on the number of cellBCs found for the same gene or genomic region in the Illumina data (the
complexity of the search set). The software allows to define the maximal
false assignment percentage as a parameter. We used computer simulations of collision frequencies to define the complexity of the search set (number of Illumina barcodes) allowed for different edit distances and maximal false
assignment percentages. Simulation data are supplied as an XMLfile and
can be easily adapted. Optionally the software also allows the definition of fixed edit distance limits.
6. Search for UMIs: To identify the ten nucleotide UMI, 14 nucleotides (to allow for insertions in the read) following the end of the cellBC sequence (position corrected for barcode indels) were extracted. For UMI assignment, we used the same strategy as for cellBC assignment. We searched for matching UMIs in Illumina data for the same cellBC and either genomic region or gene identified in the previous step. This means the complexity of the search set corresponds to the copy number of a given gene in just one cell. The maximal allowed edit distance which is dynamically adjusted depending on the complexity of the search set (detailed above).
7. Determination of cellBC and UMI assignment accuracy: To evaluate the
accuracy of cellBC and UMI assignment, wefirst scanned each Nanopore
SAM record for a matching Illumina cellBC or UMI. We then repeated the scan where we replaced each cellBC or UMI sequence extracted from the Nanopore read by a random sequence and mutated this random sequence allowing the same number of mutations (edit distance) that was used for the same SAM record in the previous scan and searched for matching cellBC or UMIs in the Illumina dataset. The ratio between the number of reads that were assigned to both a cellBC and UMI after and before replacement of the cellBC or the UMI against a random sequence is the false assignment probability.
The cellBC assignment accuracy is particularly high, since after an incorrect cellBC assignment, the UMI is compared with the UMIs associated with this wrong cellBC in the Illumina data. In consequence, most reads with falsely assigned cellBC are subsequently eliminated during UMI assignment. The false barcode assignment rate in cellBC and UMI assigned reads is thus the product of the false cellBC and the false UMI discovery rate. With the default cellBC (5% false assignment) and UMI scanning (2% false assignment) parameters we used, we obtained an effective cellBC assignment accuracy of 99.8%, which is close to the value expected with those parameters. In a second approach to assess the accuracy of cellBC and UMI assignment we guided the barcode and UMI assignment to the Nanopore reads with Illumina short-read sequencing data from an independent mouse brain single-cell sequencing experiment. The unrelated Illumina dataset was from an 885 cell P18 mouse brain sample (GEO accession number GSM4224249, 219k reads/cell, 88.1% sequencing saturation, 6550 UMIs/cell, 2739 genes/cell).
While in thefirst approach (replacement against random sequences), the
maximal edit distance tested for each read was limited to the edit distance for which a match was found (if any) with the non-random sequences, in the second approach, the cellBC and UMI search was allowed to proceed up to the maximal allowed edit distance. E.g. when for a given Nanopore read a
cellBC match was found with the correct Illumina dataset at ED= 0, a
cellBC match at a higher edit distance in the unrelated Illumina dataset was considered a match.
8. Maximal possible Barcode and UMI assignment efficiency with 10xGenomics
data: Since our software scans for matches of the Nanopore cell barcodes with barcodes associated with cells (the relevant barcodes), barcodes associated with empty drops are ignored. The maximal possible barcode discovery rate in Nanopore reads corresponds to the percentage of reads associated with cells in the Illumina dataset: 83.7% and 85.1% for the 190 cell and the 951 cell sample, respectively.
The maximal UMI discovery rate for Nanopore reads depends on the Illumina sequencing depth of the same sample and corresponds to the sequencing saturation computed by the 10xGenomics Cell Ranger software after Illumina sequencing. The sequencing saturation is the probability that a matching UMI is found in the Illumina dataset for a given read. For the 190 cell and 951 cell samples, the sequencing saturations were 90.5% and 74.8%
respectively. Efficiencies of barcode assignment are given as percentages of
cell associated barcodes. UMI assignment efficiencies were corrected for the sequencing saturation.
9. Compatibility of the software: The software is compatible with the 10x Genomics workflow v2 and the recent upgrade (v3) which uses 12nt UMIs.
It can also be used for cellBC and UMI assignment of long-read single-cell data generated with other single-cell isolation systems with the following
limitations: The cDNA needs to have a 3′ adapter followed by a cellBC, an
UMI and a poly(A). CellBC and UMI length, adapter sequences as well as the search stringency for poly(A/T), adapter, cellBC, and UMI can be
configured accordingly.
Definition of cDNA consensus sequences for each UMI. Potentially chimeric
reads (terminal Soft/Hard-clipping of >150 nt; 1.93% and 3.95% for the 190 and 951 cell dataset respectively) and reads with low-quality genome alignments
(minimap2 mapping quality values= 0) were filtered out. SAM records for each
cell and gene were grouped by UMI. The cDNA sequence, between TSO end (TE SAM tag) and poly(A) start (PE SAM tag), was extracted for consensus sequence computation using the Sicelore ComputeConsensus method. Depending on the number of available reads for the UMI the following sequence was assigned as the consensus sequence for the UMI: (i) just one read, the cDNA sequence of the read was assigned to the UMI; (ii) two reads, the cDNA sequence of the best mapping
read (lowest“de” minimap2 SAM record tag value) was defined as the consensus
sequence; (iii) More than 2 reads, a consensus sequence of all cDNA sequences for
the UMI was generated after poa13multiple alignment and polished with racon14
using all cDNA sequences for the UMI.
Assignment of Gencode transcript isoforms. Consensus cDNA sequences for all UMIs were aligned to the Mus musculus Genome (mm10) with minimap2 v2.17 in spliced alignment mode. SAM records matching known genes were analyzed for matching Gencode vM18 transcript isoforms (same exon makeup). To assign a UMI to a Gencode transcript we required a full match between the UMI and the Gencode transcript exonic structures. We authorized a two-base margin of added or lacking sequences at exon boundaries, to allow for indels at exon junctions and imprecise mapping by minimap2. Following this strategy (Sicelore IsoformMatrix method), we assigned 63.6% of the UMIs to a known Gencode transcript isoform
and generated gene-level (median UMIs/cell= 6047) and isoform-level (median
UMIs/cell= 3795) count matrices used for the Nanopore/Illumina gene count and
UMI count per cell correlations (Fig.2a, b) and for the transcripts isoforms t-SNE
(Fig.2e).
Single-cell gene expression quantification and determination of major cell
types. Raw gene expression matrices generated by Cell Ranger were processed using R/Bioconductor (version 3.5.2) and the Seurat R package (version 3.1.4). A total of 190 cells and 951 cells were detected with default Cell Ranger cutoffs for the two replicates. Cells with over 95% dropouts were removed. From the 186 and 935 remaining cells (hereafter called 1121 cells dataset), gene expression matrices were cell level scaled to 10.000 and log-normalized. The top 2000 highly variable genes were selected based on the variance-stabilizing transformation method and used for Principal Component Analysis. Due to differences in sequencing depth of both
replicates, data were integrated using the Seurat CCA method. Thefirst 11 aligned
canonical correlations were used to define the integrated sub space for clustering and t-SNE visualization of the 1121 remaining cells. Clusters in the t-SNE plot were assigned to known cell types using canonical marker genes (Supplementary Fig. 8a, Supplementary Data 1). Using Seurat multi-modal capabilities, we integrated Illumina and Nanopore gene-level and isoform-level datasets allowing direct comparison of gene and isoform expression in individual cells.
Identification of novel transcript isoforms. UMIs of the 1121 cells dataset were
used for the identification of novel transcripts isoforms using the Sicelore Col-lapseModel method. cDNA consensus sequences for UMIs with an exon structure not supported by Gencode (at least one splice junction different when compared with annotated Gencode transcripts, see Supplementary Fig. 6, Supplementary
Note) werefirst grouped by gene and sequences with identical exon structure were
used to define potential novel transcript isoforms. Novel isoforms supported by less
thanfive UMIs were discarded. Isoforms with identical exon layout that differ in
SNVs or 5′ or 3′ ends were considered as identical isoforms. Novel isoforms were
classified as suggested by Tardaguila et al.15: (i) combination of known splice
junctions, only composed of exon-exon junctions found in Gencode transcripts; (ii) combination of known splice sites, individual donor and acceptor sites are known, but the resulting splice junction is novel; (iii) at least one donor or acceptor site is not found in Gencode transcripts.
We nextfiltered novel transcripts isoforms requiring: (i) all exon-exon junctions
either described in Gencode or confirmed in an E18 cortex/ midhindbrain Illumina
short-read dataset (GEO accession GSE69711); (ii) a 5′ end located within 50
nucleotides of a known transcription start site identified by CAGE (FANTOM5
mm9 reference UCSC liftover to mm10,https://fantom.gsc.riken.jp/5/datafiles/
latest/extra/CAGE_peaks/); (iii) a 3′ end within 50 nucleotides of a polyadenylation
site (GENCODE vM24 PolyA feature annotation,https://www.gencodegenes.org/
mouse/).
Correlation of gene or isoform expression between replicates. To analyze expression correlations between clusters, Illumina gene-level and Nanopore
gene- and isoform-level data were downsampled (R package DropletUtils16
downsampleMatrix method) to the median UMIs/cell of the 1121 cell Nanopore transcript isoform-level dataset (3795 UMIs/cell). We then grouped for each
replicate cells for each cluster (see Fig.2d, e), and used the mean expression of each
gene or isoform in the clusters to produce a Pearson correlation matrix (R cor function). Heatmaps in Supplementary Fig. 7 were generated after cluster agglomeration with the Ward method (pheatmap package).
Gria2 data analysis. 9593 reads (2105 UMIs) corresponding to Gria2 (mm10: chr3:80,682,936-80,804,791) were extracted from the 951 and the 190 cell dataset. A consensus sequence for each molecule was computed and re-mapped to the mm10 genome for SNP calling using the Sicelore SNPMatrix method. Gria2 mRNAs are huge (> 6 kB) and inefficiently converted into full-length cDNA in the 10x Genomics workflow. This is likely due to: (i) some RNA degradation within the droplet between cell lysis and reverse transcription. (ii) internal reverse tran-scription priming at A-rich sites within the cDNA leading to cDNAs that cover only part of the transcripts. In consequence, we noticed 3′ bias and fragmented coverage for certain long transcripts such as Gria2 where a total of 456 cDNA molecules (UMIs) had the R/G-editing-and 233 had both the R/G and the Q/R-editing-site. Further optimization of the 10x Genomics workflow should allow more efficient full-length capture of long mRNAs.
Reporting summary. Further information on research design is available in the Nature Research Reporting Summary linked to this article.
Data availability
All relevant data have been deposited in Gene Expression Omnibus under accession numberGSE130708.
Code availability
Source data are provided with this paper. All custom software used is available on Github
https://github.com/ucagenomix/sicelore.
Received: 3 June 2020; Accepted: 17 July 2020;
References
1. Rozenblatt-Rosen, O., Stubbington, M. J., Regev, A. & Teichmann, S. A. The
Human Cell Atlas: from vision to reality. Nat. N. 550, 451 (2017).
2. Tabula Muris, C. et al. Single-cell transcriptomics of 20 mouse organs creates
a. Tabula Muris. Nat. 562, 367–372 (2018).
3. Gupta, I. et al. Single-cell isoform RNA sequencing characterizes isoforms in
thousands of cerebellar cells. Nat. Biotechnol. 36, 1197–120214 (2018).
4. Singh, M. et al. High-throughput targeted long-read single cell sequencing
reveals the clonal and transcriptional landscape of lymphocytes. Nat. Commun. 10, 3120 (2019).
5. Volden, R. & Vollmers, C. Highly multiplexed single-cell full-length cDNA
sequencing of human immune cells with 10X genomics and R2C2. bioRxiv
https://www.biorxiv.org/content/10.1101/2020.01.10.902361v1(2020).
6. Liu, W. & Zhang, X. Single-cell alternative splicing analysis reveals dominance
of single transcript variant. Genomics 112, 2418–2425 (2020).
7. Tojima, T., Itofusa, R. & Kamiguchi, H. Asymmetric clathrin-mediated
endocytosis drives repulsive growth cone guidance. Neuron 66, 370–377 (2010).
8. Vallee, R. B., Seale, G. E. & Tsai, J.-W. Emerging roles for myosin II and
cytoplasmic dynein in migrating neurons and growth cones. Trends Cell Biol.
19, 347–355 (2009).
9. McMahon, H. T. & Boucrot, E. Molecular mechanism and physiological
functions of clathrin-mediated endocytosis. Nat. Rev. Mol. Cell Biol. 12, 517 (2011).
10. Kneussel, M. & Wagner, W. Myosin motors at neuronal synapses: drivers of membrane transport and actin dynamics. Nat. Rev. Neurosci. 14, 233 (2013).
11. Wahlstedt, H., Daniel, C., Ensterö, M. & Öhman, M. Large-scale mRNA sequencing determines global regulation of RNA editing during brain development. Genome Res. 19, 978–986 (2009).
12. Lomeli, H. et al. Control of kinetic properties of AMPA receptor channels by
nuclear RNA editing. Science 266, 1709–1713 (1994).
13. Lee, C., Grasso, C. & Sharlow, M. F. Multiple sequence alignment using partial
order graphs. Bioinformatics 18, 452–464 (2002).
14. Vaser, R., Sovic, I., Nagarajan, N. & Sikic, M. Fast and accurate de novo genome assembly from long uncorrected reads. Genome Res. 27, 737–746 (2017).
15. Tardaguila, M. et al. SQANTI: extensive characterization of long-read transcript sequences for quality control in full-length transcriptome identification and quantification. Genome Res. 28, 396–411 (2018). 16. Lun, A. T. L. et al. EmptyDrops: distinguishing cells from empty
droplets in droplet-based single-cell RNA sequencing data. Genome Biol. 20, 63 (2019).
Acknowledgements
This project was funded by grants from the Institut National contre le Cancer (PLBIO2018-156), the Conseil Départemental des Alpes Maritimes (2016-294DGADSH-CV), FRM (DEQ20180339158), the Inserm Cross-cutting Scientific Program HuDeCA 2018, the National Infrastructure France Génomique (Commissariat aux Grands Investissements, ANR-10-INBS-09-03, ANR-10-INBS-09-02). This publication is part of the Human Cell Atlas -https://www.humancellatlas.org/publications.
Author contributions
Conception and design: R.W., P.B.; Experimental work: V.M., R.W.; Data process, curation and visualization: R.W., K.L.; Analysis and interpretation: K.L., R.W., P.B.; Drafting of the manuscript: R.W.; Manuscript review and edition: all authors. Funding and supervision: P.B.
Competing interests
The authors declare no competing interests.
Additional information
Supplementary informationis available for this paper at https://doi.org/10.1038/s41467-020-17800-6.
Correspondenceand requests for materials should be addressed to K.L., P.B. or R.W. Peer review informationNature Communications thanks the anonymous reviewer(s) for their contribution to the peer review of this work. Peer reviewer reports are available. Reprints and permission informationis available athttp://www.nature.com/reprints
Publisher’s note Springer Nature remains neutral with regard to jurisdictional claims in published maps and institutional affiliations.
Open Access This article is licensed under a Creative Commons Attribution 4.0 International License, which permits use, sharing, adaptation, distribution and reproduction in any medium or format, as long as you give appropriate credit to the original author(s) and the source, provide a link to the Creative Commons license, and indicate if changes were made. The images or other third party material in this article are included in the article’s Creative Commons license, unless indicated otherwise in a credit line to the material. If material is not included in the article’s Creative Commons license and your intended use is not permitted by statutory regulation or exceeds the permitted use, you will need to obtain permission directly from the copyright holder. To view a copy of this license, visithttp://creativecommons.org/ licenses/by/4.0/.
© The Author(s) 2020