HAL Id: hal-02509355
https://hal-amu.archives-ouvertes.fr/hal-02509355
Submitted on 18 Mar 2020
HAL is a multi-disciplinary open access archive for the deposit and dissemination of sci-entific research documents, whether they are pub-lished or not. The documents may come from teaching and research institutions in France or abroad, or from public or private research centers.
L’archive ouverte pluridisciplinaire HAL, est destinée au dépôt et à la diffusion de documents scientifiques de niveau recherche, publiés ou non, émanant des établissements d’enseignement et de recherche français ou étrangers, des laboratoires publics ou privés.
MALDI-TOF mass spectrometry
Angéline Antezack, Hervé Chaudet, Hervé Tissot-Dupont, Philippe Brouqui,
Virginie Monnet-Corti
To cite this version:
Angéline Antezack, Hervé Chaudet, Hervé Tissot-Dupont, Philippe Brouqui, Virginie Monnet-Corti. Rapid diagnosis of periodontitis, a feasibility study using MALDI-TOF mass spectrometry. PLoS ONE, Public Library of Science, 2020, 15 (3), pp.e0230334. �10.1371/journal.pone.0230334�. �hal-02509355�
RESEARCH ARTICLE
Rapid diagnosis of periodontitis, a feasibility
study using MALDI-TOF mass spectrometry
Ange´line Antezack1,2, Herve´ Chaudet2, Herve´ Tissot-Dupont2, Philippe Brouqui2, Virginie Monnet-Corti1,2*1 Department of Periodontology, Service of Odontology, AP-HM, UFR of Odontology, Aix-Marseille University, Marseille, France, 2 AP-HM, IHU-Me´diterrane´e Infection, Institut de Recherche pour le De´veloppement, Institut Hospitalo-Universitaire Me´diterrane´e Infection, MEPHI, Aix Marseille University, Marseille, France
*virginie.corti@univ-amu.fr
Abstract
Aim
The aim of the present study was to assess the feasibility and diagnostic contribution of pro-tein profiling using MALDI-TOF mass spectrometry applied to saliva, gingival crevicular fluid (GCF) and dental plaque from periodontitis and healthy subjects. We hypothesized that rapid routine and blinded MALDI-TOF analysis could accurately classify these three types of samples according to periodontal state.
Materials and methods
Unstimulated saliva, GCF and dental plaque, collected from periodontitis subjects and healthy controls, were analyzed by MALDI-TOF MS. Based on the differentially expressed peaks between the two groups, diagnostic decision trees were built for each sample.
Results
Among 141 patients (67 periodontitis and 74 healthy controls), the decision trees diagnosed periodontitis with a sensitivity = 70.3% (±0.211) and a specificity = 77.8% (±0.165) for saliva, a sensitivity = 79.6% (±0.188) and a specificity = 75.7% (±0.195) for GCF, and a sensitivity = 72.1% (±0.202) and a specificity = 72.2% (±0.195) for dental plaque. The sen-sitivity and specificity of the tests were improved to 100% (CI 95% = [0.91;1]) and 100% (CI 95% = [0.92;1]), respectively, when two samples were tested.
Conclusion
We developed, for the first time, diagnostic tests based on protein profiles of saliva, GCF and dental plaque between periodontitis patients and healthy subjects. When at least 2 of these samples were tested, the best results were obtained.
a1111111111 a1111111111 a1111111111 a1111111111 a1111111111 OPEN ACCESS
Citation: Antezack A, Chaudet H, Tissot-Dupont H,
Brouqui P, Monnet-Corti V (2020) Rapid diagnosis of periodontitis, a feasibility study using MALDI-TOF mass spectrometry. PLoS ONE 15(3): e0230334.https://doi.org/10.1371/journal. pone.0230334
Editor: Tommaso Lomonaco, University of Pisa,
ITALY
Received: November 7, 2019 Accepted: February 26, 2020 Published: March 13, 2020
Peer Review History: PLOS recognizes the
benefits of transparency in the peer review process; therefore, we enable the publication of all of the content of peer review and author responses alongside final, published articles. The editorial history of this article is available here: https://doi.org/10.1371/journal.pone.0230334
Copyright:© 2020 Antezack et al. This is an open access article distributed under the terms of the Creative Commons Attribution License, which permits unrestricted use, distribution, and reproduction in any medium, provided the original author and source are credited.
Data Availability Statement: All relevant data are
within the manuscript and its Supporting Information files.
Introduction
Periodontitis is a chronic multifactorial inflammatory disease associated with dysbiotic plaque biofilms that results in the progressive destruction of the supporting structures of the teeth [1]. The 2009–2012 NHANES estimated that 46% of adults aged 30 years or older in the United States had periodontitis with 8.9% having two or more interproximal sites with � 6 mm clini-cal attachment loss (not on the same tooth) and one or more interproximal site(s) with � 5 mm periodontal probing depth [2]. Due to its high prevalence and its consequences on quality of life, oral health and associations with systemic diseases, periodontitis is an important public health problem [3,4]. The diagnosis of periodontitis is currently based on clinical measure-ments of probing pocket depth (PD), bleeding on probing (BOP), plaque index, and clinical attachment level and is associated with a radiographic examination [1]. The major drawbacks of this clinical diagnosis are that it is time-consuming and that it requires professional skills and training, making it difficult to use for large-scale screening. Furthermore, because at the beginning of periodontal disease the patient does not experience any symptoms, he will not consult and will not be diagnosed until an advanced stage of periodontitis is reached. These assessments highlight the necessity to have a simple minimally invasive screening and diagno-sis tool for periodontal health and periodontal disease at any stage.
Recently, the development of diagnostic tests based in either oral fluid or blood analysis has seen considerable growth for population screening in many medical disciplines [5–7]. Further-more, the use of oral fluid as an alternative to venous blood has been intensively explored in various fields of research such as therapeutic drug monitoring or diseases biomarker discovery purpose [8,9]. Compared to blood and its derivatives, saliva carries many advantages including non-invasiveness, no need for highly trained personnel, safer to handle, ease to collect, ship and store [10]. Recently, Campanella et al. have found that analysis of volatile salivary metabo-lites could be promising for the indirect assessment of gut microbiota [11].
In the periodontal field, numerous studies have attempted to investigate potential changes in saliva, gingival crevicular fluid (GCF) and dental plaque that could be correlated to peri-odontitis and be used to develop new alternative diagnostic method [12–14]. However, to date, no unique biomarker has been identified as sensitive and specific enough to be used for diagnosing periodontitis [15,16]. Biological tests are still dramatically missing in the periodon-tal diagnosis field while they already exist or will exist tomorrow for other diseases [17,18]. Faced with this observation, the evaluation and comparison of global protein profiles seem more relevant than the search for and identification of biomarkers in the periodontitis diagno-sis. The existence of specific protein profiles could represent the signature of a periodontal disease.
Matrix-assisted laser desorption ionization time-of-flight (MALDI-TOF) mass spectrome-try (MS) is a rapid and precise proteome profiling method that generates a characteristic spec-trum for analytes in the sample. Profiling is a conventional approach that is widely used in bacterial identification by comparing spectra of unknown bacteria to databases that contain spectra of reference bacteria [19–20]. In this non-quantitative technique, intact cells can directly be mixed with MALDI matrix [20]. La Scola & Raoult have shown that this method was efficient for direct routine identification of bacterial isolates in blood culture and may sur-pass the conventional diagnostic methods in speed and accuracy [21]. Beyond the realms of microbial world, recent studies demonstrated that MALDI-TOF MS technique can be used to identify fleas [22], ticks [23] and mosquitoes [24] and also appears promising in the rapid diag-nosis of cancerous lung nodule [25].
In the periodontology field, Ngo et al. were the first to use mass spectrometric techniques to identify 33 peptides and 66 proteins in GCF from inflammatory sites in periodontal
Funding: This work was supported by the French
Government under the ‘Investissements d’avenir’ (Investments for the Future) program managed by the AgenceNationale de la Recherche (ANR, fr: National Agency for Research) (reference: Me´diterrane´e Infection 10-IAHU-03).
Competing interests: The authors have declared
maintenance subjects [26]. In another study, the same authors found that peptide profiles of GCF from periodontal maintenance subjects could be used to predict sites with attachment loss [27]. Zhang et al. compared the protein profiles of orthodontics patients with and without periodontitis using MALDI-TOF MS and found significantly different intensities of nine peaks, seven of which were higher in healthy subjects [28]. Chaiyarit et al. analyzed salivary protein profiles in oral cancer, oral lichen planus, and chronic periodontitis and found that mass signals at 5,835.73 and 9,801.83 Da were significantly decreased in periodontitis patients compared to the two others oral diseases [29]. More recently, in a small number of patients, changes in protein profiles in chronic periodontitis were reported in saliva, GCF and serum [30].
The few studies identifying protein profiles changes were case-control studies, which described differences between periodontitis and healthy subjects, but there are no data avail-able from blinded experiments. The aim of the present study was to assess the feasibility and diagnostic contribution of protein profiling using MALDI-TOF mass spectrometry applied to saliva, GCF and dental plaque from periodontitis and healthy subjects. We hypothesized that rapid routine and blinded MALDI-TOF analysis could accurately classify these three types of samples according to periodontal state.
Materials and methods
This study was approved by the Institutional Review Board (IRB) and Independent Ethics Committee (IEC) of Institut Hospitalo-Universitaire (IHU), Microbes Evolution Phylogeny and Infections—(MEPHI) under N˚ 2019–008. Informed written consent was obtained from each patient.
Study population
The subject population was recruited from January 2019 until June 2019. Periodontitis subjects were recruited among patients referred to the periodontal department of the Pavillon Odonto-logique de la Timone, Marseille. Control subjects were recruited among young adults. A medical questionnaire (epidemiological data) including the main general risk factors for peri-odontal diseases was completed (S1 Table) and a periodontal examination was performed, including an intra-oral examination and full-mouth periodontal probing. A periodontal diag-nosis was made, and subjects were divided into two groups: the periodontitis group, in which the periodontitis has been classified into stages and grades according the Chicago classification [1] and the healthy periodontium (control) group.
According to the Chicago classification [1], the inclusion criteria for:
• the periodontitis group were interdental clinical attachment loss (CAL) detectable at � 2 non-adjacent teeth or buccal or oral CAL � 3 mm with pocketing � 3 mm detectable at � 2 teeth,
• the healthy periodontium control group were bleeding score on probing < 10%, pocket depth < 3 mm and no clinical attachment loss.
All the patients were selected based upon periodontal status, regardless of the other criteria (e.g., systemic disease or disease/infection that may affect the periodontal health status, use of antibiotics or immunosuppressant medication within 3 months, current or former smokers), in order to reduce selection bias.
Non-inclusion criteria for both groups were history of periodontal therapy within the previ-ous 6 months, pregnant/lactating women and orthodontic patients.
Sample collections
Saliva. All subjects were asked to not eat, drink or brush their teeth one hour before sam-ple collection. Each subject was asked to expectorate whole saliva into a 50-mL centrifuge tube until a minimum saliva volume of 2 mL was collected.
GCF and subgingival dental plaque. GCF and subgingival dental plaque samples were collected from one site showing PD <3mm without CAL or BOP of one tooth in each quad-rant (4 sites from each subject in total) in control group. In periodontitis group, samples were collected from one site with PD � 5mm and CAL � 3mm of one tooth in each quadrant of each subject (4 sites from each subject in total). For both GCF and subgingival dental plaque collections, all supra-gingival plaque facing the sampling area was removed with a sterile curette to avoid contaminating the samples. The site was then isolated by cotton rolls and gently air dried for 5 s to remove any saliva present. GCF was collected using sterile absorbent paper points (Paper points N˚20, VDW-Zipperer1) carefully positioned into the periodontal pocket from periodontitis patients and into the gingival sulcus from control subjects and left for 30 s. GCF within the periodontal pocket or the sulcus was absorbed by the paper points through capillary action. A total of 4 paper points were obtained from each patient and placed into a 1.5-mL Eppendorf tube containing 100μL HPLC-grade water (HPLC: high-perfor-mance liquid chromatography). Subgingival dental plaque was collected using a sterile curette and placed into a 1.5 mL Eppendorf tube containing 100μL HPLC-grade water. Samples were immediately stored at 4˚C and analyzed within 24 to 48 hours. Only samples not visually con-taminated with blood were selected for the study.
Mass spectrometry. A volume of 0.5μL of each sample was directly spotted six times onto a 96 polished steel MALDI target and then allowed to dry at room temperature. Deposits were then coated with 1μL of a matrix solution containing α-cyano-4-hydroxycinnamic acid diluted into 500μL of acetonitrile, 250 μL of 10% trifluoroacetic acid and 250 μL of HPLC-grade water. All manipulations were carried out under class II biological safety cabinets MSC-AdvantageTM (Thermo Fischer Scientific, Villebon sur Yvette, France). After drying for a few minutes at room temperature, the target was introduced into a Microflex LT MALDI-TOF mass spectrometer laser (Bruker Daltonics, Bremen, Germany; external mass spectrome-ter calibration accuracy± 300ppm). Each sample generated 6 spectra from 6 deposits. Spectra were recorded in the positive linear mode at a laser frequency of 50 Hz within a mass range of 2–20 kDa. The acceleration voltage was 20 kV, and the extraction delay time was 200 ns. Each spectrum was obtained from 240 laser shots performed in 6 regions of the same spot and then automatically acquired using the AutoXecute acquisition control in FlexControl software 3.0 (Bruker Daltonics). The spectra of the six spots for each sample were imported into the BioTy-per-RTCTMversion 3.0 software (Bruker Daltonics GmbH). The calibration of the MS was fully automated and performed with a commercial solution (BTS: Bacterial standard test) and the procedure was completely automatic (BiotyperRTC user manual). For each analysis, the MALDI target was simultaneously tested with an inactivated strain ofEscherichia coli as the
positive control (objective score > 2,1) and with matrix solution alone as the negative control (objective score < 1,5). All spectra were controlled using the Flexanalysis1v3.4 software (Bru-ker Daltonics, Bremen, Germany). Quality criteria of the spectrum for global aspect and inten-sity were checked : inteninten-sity above 104arbitrary units (AU), horizontal baseline curve and presence of visually identifiable peaks.
Bioinformatics analysis. Spectra were analyzed using a homemade R program [31] including the supplementary libraries MALDIQuant [32], seriation [33] and binDA [34].
A first step of spectra pre-processing included noisy spectra discarding using spectrum sig-nal to noise ratio, smoothing (moving average with half window size 8), baseline correction
(Statistics-sensitive Non-linear Iterative Peak-clipping algorithm, 100 iterations), intensity recalibration (total ion current), peak selection (MAD with half window size 8 and signal-noise ratio threshold 3), spectra alignment (quadratic warping function with 0.002 tolerance), averaging of technical replicates in main spectrum profiles (MSP), peak binning, and intensity matrix building, as recommended by Gibb & Strimmer [35].
Differences in the two groups analyzed were assessed on the basis of a discriminant peak identification list using binary predictors. To create the list of discriminant peaks for each sam-ple, we performed a discriminant analysis between groups using the Binary Discriminant Analysis method [34]. Then, we searched for models able to correctly discriminate the two groups, periodontitis and healthy periodontal subjects, from each sample. We generated binary decision trees using Quinlan’s C5.0 algorithm, an extension of C4.5 [36]. In a second step, an internal validation was processed with a 10-fold cross-validation in order to verify the classification ability of the generated models. Each group of samples was randomly partitioned into 10 equal-sized subsamples. One subsample was selected as the validation data for testing the diagnostic decision tree, while the other 9 subsamples were used as training data. The pro-cess was repeated 10 times with a rotation of the subsamples tested. The performance of the models of each sample was evaluated by sensitivity and specificity. Finally, a principal compo-nent analysis was carried out between the top 10 ranking peaks and the epidemiological data from the medical questionnaire (age, gender, current smokers, former smokers, diabetes, car-diovascular disease, hypothyroidism, arthritis, respiratory disease, anti-diabetic medication, antibiotics, anti-inflammatory, antihypertensive, anticoagulants, thyroid hormone thyroxine, hormonal contraception and stress).
Results
Characteristics of the subjects in the study
A total of 141 subjects, specifically 39 males and 102 females aged from 20 to 77 years, were enrolled in the study. The periodontitis group included 67 subjects (mean age 50.18± 13.85 years, 14 males/53 females). The control group included 74 subjects (mean age 24.50± 3.28 years, 25 males/49 females). Patient details are listed in Tables1and2. The same proportions of current smokers were present in our two groups. A large proportion of our periodontitis group was classified into stages III (46.3%) and IV (41.8%). A total of 119 samples of saliva (51 periodontitis; 68 controls), 104 samples of GCF (54 periodontitis; 50 controls) and 110 samples of dental plaque (51 periodontitis; 59 controls) were collected.
Differentially expressed peptide peaks. Saliva, GCF and dental plaque samples were ana-lyzed by MALDI-TOF MS, and protein profiles were obtained from each sample in the range of 2–20 kDa.
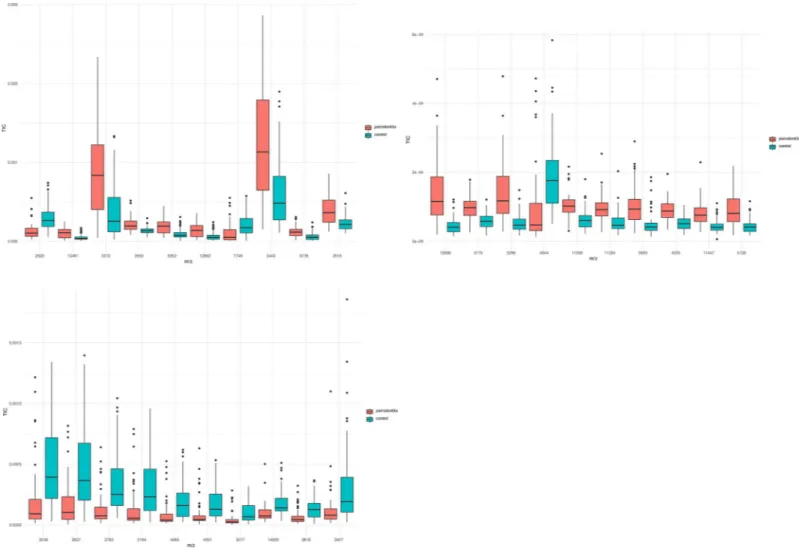
A total of 217 peaks were detected in saliva, among which 114 were significantly different between the two groups (p < 0.05) (S2 Table). Among the top 10 ranking peaks, 8 (m/z values: 3372 Da, 3443 Da, 3519 Da, 3550 Da, 6352 Da, 6735 Da, 12692 Da, and 13461 Da) had higher levels of intensities in the periodontitis group, and 2 (m/z values: 2620 Da and 7746 Da) had higher levels of intensity in the control group (Fig 1A).
A total of 176 peaks were detected in GCF, among which 110 were significantly different between the two groups (p < 0.05) (S3 Table). Among the top 10 ranking peaks, 9 (m/z values: 3775 Da, 4235 Da, 5296 Da, 5728 Da, 5893 Da, 10586 Da, 11324 Da, 11359 Da and 11447 Da) had higher levels of intensity in the periodontitis group, and only 1 (m/z values: 4944 Da) had a higher level of intensity in the control group (Fig 1B).
A total of 124 peaks were detected in dental plaque, among which 54 were significantly dif-ferent between the two groups (p < 0,05) (S4 Table). All top 10 ranking peaks (m/z values:
2407 Da, 2627 Da, 2783 Da, 2818 Da, 3038 Da, 3077 Da, 3194 Da, 4065 Da, 4931 Da and 14693 Da) had lower levels of intensity in the periodontitis group (Fig 1C).
Construction of the informatics decision tree for periodontal diagnosis
On the basis of protein profiles obtained by MALDI-TOF MS, a diagnostic decision tree for periodontitis based on the differentially expressed peaks was made for each type of sample (Fig 2). For saliva, 7 peaks were selected to build a diagnostic decision tree with a sensitivity = 98% and a specificity = 91%. For GCF and dental plaque, 9 peaks were selected to build a diagnostic decision tree with a sensitivity = 96% and 94% and a specificity = 98% and 96%, respectively.
In the blind experiment with a 10-fold cross-validation, diagnostic decision trees were con-firmed with a sensitivity = 70.3% (± 0.211) and a specificity = 77.8% (± 0.165) for saliva, a sen-sitivity = 79.6% (± 0.188) and a specificity = 75.7% (± 0.195) for GCF, and a sensen-sitivity = 72.1% (± 0.202) and a specificity = 72.2% (± 0.195) for dental plaque.
When a concatenation of the 3 decision trees was performed with a minimum of two sam-ples tested, we found a sensitivity = 1 (CI 95% = [0.91;1]), a specificity = 1 (CI 95% = [0.92;1]),
Table 1. Demographic characteristics contrasting the subjects from the periodontitis group and control group, with the p-value resulting from the between-group comparison of all subjects.
Periodontitis group Control group p value Variable Male Female All Male Female All
Number of patients 14 53 67 25 49 74
Age (years) 49.14± 15.35 50.45± 13.58 50.18± 13.85 24.12± 2.35 24.63± 3.67 24.50± 3.28 <0.0001�
Number of current smokers 4 14 18 8 9 17 0.593
Number of former smokers 5 11 16 2 2 4 0.0017�
Diabetes (HbA1c < 7) 0 4 4 0 0 0 0.0330� Cardiovascular disease 2 6 8 1 2 3 0.0812 Hypothyroidism (TSH<4 mUI) 2 8 10 0 1 1 0.0027� Arthritis 0 2 2 0 1 1 0.502 Respiratory disease 2 2 4 1 2 3 0.600 Anti-diabetic medication† 0 4 4 0 0 0 0.0330� Antibiotics† 0 2 2 0 3 3 0.731 Anti-inflammatory† 0 2 2 2 9 11 0.0149� Antihypertensive† 2 4 6 0 1 1 0.037� Anticoagulants1 1 5 6 0 1 1 0.0379�
Thyroid hormone thyroxine (T4)† 2 6 8 0 41 1 0.0102�
Hormonal Contraception† 0 11 11 0 21 21 0.0904
Stress 4 25 29 10 31 41 0.150
†Medication within a month
�Significant difference (p<0.05)
https://doi.org/10.1371/journal.pone.0230334.t001
Table 2. Stages and grades in the periodontitis group according to the Chicago classification [1]. The percentage in each box refers to the relative frequency in relation
to the total of 67 periodontitis subjects.
Stage Grade 1 2 3 4 Total A 0 (0,0%) 3 (4,5%) 0 (0,0%) 0 (0,0%) 3 (4,5%) B 0 (0,0%) 5 (7,5%) 15 (22,4%) 6 (8,9%) 26 (38,8%) C 0 (0,0%) 0 (0,0%) 16 (23,9%) 22 (32,8%) 38 (56,7%) Total 0 (0,0%) 8 (11,9%) 31 (46,3%) 28 (41,8%) 67 (100%)
a positive predictive value = 1 (CI 95% = [0.91;1]) and a negative predictive value = 1 (CI 95% = [0.92;1]) for our study population.
Relation between the peaks and the epidemiological data
A principal component analysis was carried out between the 10 top ranking peaks and the epi-demiological data from the medical questionnaire (age, gender, current smokers, former smokers, diabetes, cardiovascular disease, hypothyroidism, arthritis, respiratory disease, anti-diabetic medication, antibiotics, anti-inflammatory, antihypertensive, anticoagulants, thyroid hormone thyroxine, hormonal contraception and stress). The 10 top ranking peaks were found independent of the general risk factors for periodontal diseases, which means that these peaks are specific of the periodontal status.
Discussion
Due to high and constantly increasing prevalence of periodontitis and its consequences on quality of life, oral and general health, a rapid, minimally invasive and large-scale periodontal
Fig 1. Box plots of the 10 top ranking peaks differentially expressed between the periodontitis and the control groups (a. saliva, b. GCF, c. dental plaque). Most of the
differentially expressed peaks had higher levels of intensities in the periodontitis group in saliva and GCF, while all 10 top ranking peaks were found to be decreased in dental plaque from the periodontitis group.
diagnosis test is of a particular interest, especially in patients with periodontal risk factors. In this study, direct samples analysis of dental plaque, GCF and saliva by a MALDI-TOF mass spectrometer used in routine diagnostic (Microflex LT, Bruker) combined with the use of an algorithm for sample classification resulted in an acceptable performance to correctly classify periodontitis and healthy periodontium subjects. Our study was the first, to our knowledge, to demonstrate that MALDI-TOF MS differentiates periodontitis from healthy periodontium by blind identification of specific patterns in mass signals from protein profiles in saliva, GCF and dental plaque. Previous encouraging results were obtained using MALDI-TOF MS analysis to investigate differences in protein profiles according to the periodontal state, but might be lim-ited by the small sample sizes of the studies [28–30]. In our study, we obtained samples from 141 patients, 67 periodontitis patients and 74 control subjects, and found a large ratio of peaks significantly different between the periodontitis group and the control group in saliva (114 over 217), GCF (110 over 176) and dental plaque (54 over 124). These results reflect that com-position of saliva, GCF and dental plaque present important differences in correlation with periodontitis and emphasize that periodontal diagnosis does not depend on a unique bio-marker [16]. In comparison, Tang et al. detected 91 salivary peptide peaks, 7 of which were sig-nificantly different between the periodontitis and the control group, and 48 in the GCF among 4 were significantly different between the two groups [30]. These different results might be explained by a greater numbers of subjects (119 for saliva and 104 for GCF versus 33) and a larger range of detection (2-20kDa versus 1-10kDa) in our study and also variations in the sta-tistical analysis.
Fig 2. Diagnostic decision trees based on differentially expressed peaks between periodontitis and control groups (a. saliva, b. GCF, c. dental plaque).
In this study, GCF showed a strong ability to distinguish, in blind experiment, periodontitis patients from control subjects with a sensitivity = 79.6% (± 0.188) and a specificity = 75,7% (± 0,195). This result is not surprising because GCF reflects site-specific periodontal status, while saliva expresses the global status of the oral cavity. Periodontitis has been associated with changes in GCF composition and more than 90 different components have been investigated so far [37–39]. Some of these components have been found to be reduced from healthy sub-jects to patients with periodontitis, while others have been found to have concentrations posi-tively correlated with periodontal inflammation [40,41].
Saliva profiles allowed periodontitis diagnosis, in blind experiment, with a sensitiv-ity = 70.3% (± 0.211) and a specificsensitiv-ity = 77.8% (± 0.165). This result supports the promising interest of saliva as a diagnostic fluid for screening patients with periodontal diseases. Numer-ous salivary components including locally produced proteins and salivary microbiota have been investigated as potential reflect of periodontal status [42,43]. For example,Prevotella has
been found to be overabundant in the saliva of healthy subjects, whilePorphyromonas, Tanner-ella, Desulfobulbus, Eubacterium, Phocaeicola and Mogibacterium were associated with the
sali-vary microbiota of periodontitis patients [44]. We can state that these shifts in the saliva composition associated with periodontitis have a direct impact on saliva’s protein profiles, which could be used as a signature of the periodontal status. Moreover, the potentiality of saliva in screening patients with periodontitis needs to be investigated further as saliva collec-tion is non-invasive, simple, fast and dispensable of professional skills and training [16].
The decision tree obtained from dental plaque samples showed a sensitivity = 72.1% (± 0.202) and a specificity = 72.2% (± 0.195) for periodontitis diagnosis in blind experiment. We found large variations in peptide profiles (43.5% peaks differentially expressed) in subgingival plaque samples from healthy subjects and periodontitis patients in our study. It was interesting to note that the 10 most differentially expressed peaks in dental plaque had lower levels of intensity in the periodontitis group. The genesPorphyromonas, Treponema, Tannerella, Fili-factor, and Aggregatibacter were found to be more abundant in periodontitis patients, whereas Streptococcus, Haemophilus, Capnocytophaga, Gemella, Campylobacter and Granulicatella
were observed at higher levels in healthy subjects [45]. We hypothesize that these peaks could be associated with non-periodontal pathogens as initial colonizers that were less abundant in patients with periodontal diseases. If the average richness of microbes in subgingival plaque from patients with periodontitis was higher than in samples from healthy subjects, the micro-bial communities associated with periodontal health were correlated with higher Shannon indexes [45]. Subgingival microbiota in periodontal diseases seemed to be characterized by more microbes with low relative abundance compared to healthy microbiota [45]. These find-ings can explain the lower level of intensity of the top 10 ranking peaks in the periodontitis group.
The concatenation of the decision trees has improved the diagnosis of periodontitis with a sensitivity = 1 (CI 95% = [0.91;1]), a specificity = 1 (CI 95% = [0.92;1]), a positive predictive value = 1 (CI 95% = [0.91;1]) and a negative predictive value = 1 (CI 95% = [0.92;1]). As a con-sequence, our test provides the best results when at least 2 different samples are tested. Saliva and dental plaque should be preferred because their collection is easier and faster than GCF. In comparison, Tang et al. have evaluated the differentially expressed peaks to distinguish sub-jects with periodontal diseases from healthy controls with Area Under the Curve’s (AUC) val-ues in saliva and in GCF ranged from 0.688 to 0.860 and from 0.926 to 1.000 respectively [30]. To our knowledge, our study was the first to demonstrate that the protein profiles are exclu-sively specific to periodontal status independently of the periodontal risk factors. These find-ings make the prospect of a large-scale diagnostic test that could be used without
protein profiles in periodontitis diagnostic [30] was conducted in very limited population, free of periodontal risk factors and the results cannot be applied in a large-scale population as peri-odontitis is strongly linked to several periodontal risk factors [1,46]. By enlarging the selected population and ensuring the independence of the discriminating peaks, we wanted to get closer to the clinical reality.
A large proportion of our periodontitis group was classified into stages III (46,3%) and IV (41,8%), which meant that significant damage to the attachment apparatus has occurred, sup-porting delays of patients’ consultations and professional care. To date, no data related to pro-tein profiles at each stage of periodontitis based upon the new classification (2018) are
available. Future studies are needed to investigate whether the early stages (I or II) of periodon-titis present the same protein profiles as advanced stages (III or IV).
MALDI-TOF MS is a simple, inexpensive and fast technique that analyses protein profiles with a high reliability rate, and could be used as a rapid screening method in a large population [47]. The observed changes in protein profiles could reflect specific microbiota, as well as the inflammation process with host immune response and periodontal tissue breakdown. The proteomic profile of complex samples like saliva, GCF and dental plaque should be considered as a phenotypic expression resulting from a vast molecular network including bacterial coloni-zation and host immunity. The identification of specific biomarkers responsible for each peak or group of peaks represents a difficult and demanding task that requires further specific stud-ies. The spectra comparison is based on protein fingerprinting. As Maldi-TOF MS is semi-quantitative [20,48], it allows to work on the relative frequency of peaks within the same spectrum, the comparison of these relative frequencies between spectra being ensured by nor-malization (TIC, total ion current) [20,49,50]. This mechanism is the basis of the Maldi-tof bacterial identification technique currently used in routine [20,51,52]. In this pilot study, our methodology based on direct sample analysis and profiling obtained good diagnostic perfor-mance without identification of specific proteins and has the advantage to not require techni-cal expertise and to be learned by any parameditechni-cal personnel. As our strategy was to assess if Microflex LT (Bruker Daltonics, Bremen, Germany) mass spectrometer laser could meet the need of a fast routine diagnostic test in periodontology that could be easily be applied in real conditions, we choose to not freeze the samples compared to the previously-mentioned studies and to carry out the analysis in a short period of time (within 24 to 48 hours). In a study evalu-ating the right sampling conditions to obtain the best correlation between oral fluid and plasma concentrations of unbound WAR, RR/SS-warfarin and RS/SR-warfarin alcohols, Lomonaco et al. have shown that no significant degradation occurred in the extracted oral fluid samples for at least two months of storage at 4˚C [53]. Others substances like cortisol or uric acid remained stable when saliva was stored for at least 4 weeks at 4˚C whereas salivary α-amylase activity has been found decreased of about 15% in the same storage conditions [54,55]. For GCF sample, a recent study showed that 10 peaks, over the 20 top signals analyzed, resulted significantly changed after 3 months of storage at -20˚C compared to 1 month at -80˚C but the authors did not evaluate storage at 4˚C and shorter durations [56]. Despite the lack of data available concerning saliva, GCF and dental plaque storage conditions before direct MALDI-TOF MS analysis, the same conditions applied to all of our samples thus ensur-ing the correct comparability of our results. However, further studies would be necessary to assess the optimal time frame for a routine diagnostic test.
In this pilot study, in order to analyze the performance of the MALDI-TOF test we have randomly chosen a "healthy" population and a periodontitis population according to the crite-ria of the new classification [1]. We will need to refine the performance with patients from intermediate groups (children, mixed teeth, adolescents, implants, seniors) in further studies.
Conclusion
In the present study, we developed, for the first time, diagnostic tests based on protein profiles in saliva, GCF and dental plaque between periodontitis patients and healthy subjects. When at least 2 of these samples were tested, the best results were obtained. Because identifying patients at risk of periodontitis remains a challenge in periodontology, it is urgent to develop fast rou-tine biological diagnostic tests, non-invasive and easy to perform by the practitioner.
Supporting information
S1 Table. List of epidemiological data recording during the medical questionnaire. (PDF)
S2 Table. List of peaks detected in saliva. (PDF)
S3 Table. List of peaks detected in GCF. (PDF)
S4 Table. List of peaks detected in dental plaque. (PDF)
Acknowledgments
The authors would like to thank Professor Martine Bonnaure-Mallet, Doctors Alexandra Boyer, Elsa Solal, Le´a Tholozan, Cathy Dumas, Se´bastien Melloul, Mathias Faure-Brac, Camille Sadowski and Basheer Khadaroo for their valuable assistance. English editing of the article was performed by American Journal Expert under ID: Q2D3W36L.
Author Contributions
Conceptualization: Philippe Brouqui, Virginie Monnet-Corti. Formal analysis: Herve´ Chaudet.
Investigation: Ange´line Antezack. Software: Herve´ Chaudet.
Supervision: Herve´ Tissot-Dupont, Philippe Brouqui, Virginie Monnet-Corti. Writing – original draft: Ange´line Antezack.
Writing – review & editing: Ange´line Antezack, Philippe Brouqui, Virginie Monnet-Corti.
References
1. Papapanou PN, Sanz M, Buduneli N, Dietrich T, Feres M, Fine DH, et al. Periodontitis: Consensus report of workgroup 2 of the 2017 World Workshop on the Classification of Periodontal and Peri-Implant Diseases and Conditions. J Periodontol. 2018; 89 Suppl 1: S173–S182.https://doi.org/10.1002/JPER. 17-0721PMID:29926951
2. Eke PI, Dye BA, Wei L, Slade GD, Thornton-Evans GO, Borgnakke WS, et al. Update on Prevalence of Periodontitis in Adults in the United States: NHANES 2009 to 2012. J Periodontol. 2015; 86(5): 611– 22.https://doi.org/10.1902/jop.2015.140520PMID:25688694
3. Otomo-Corgel J, Pucher JJ, Rethman MP, Reynolds MA. State of the science: chronic periodontitis and systemic health. J Evid Based Dent Pract. 2012; 12(3 Suppl): 20–8.
4. Slots J. Periodontitis: facts, fallacies and the future. Periodontol 2000. 2017; 75(1): 7–23.https://doi. org/10.1111/prd.12221PMID:28758294
5. Namuganga AR, Chegou NN, Mubiri P, Walzl G, Mayanja-Kizza H. Suitability of saliva for Tuberculosis diagnosis: comparing with serum. BMC Infect Dis. 2017; 17(1): 600. https://doi.org/10.1186/s12879-017-2687-zPMID:28859607
6. Yilmaz A, Geddes T, Han B, Bahado-Singh RO, Wilson GD, Imam K, et al. Diagnostic Biomarkers of Alzheimer’s Disease as Identified in Saliva using 1H NMR-Based Metabolomics. J Alzheimers Dis. 2017; 58(2): 355–359.https://doi.org/10.3233/JAD-161226PMID:28453477
7. Pallare´s C, Carvalho-Gomes Aˆ , Hontangas V, Conde I, Di Maira T, Aguilera V, et al. Performance of the OraQuick Hepatitis C virus antibody test in oral fluid and fingerstick blood before and after treatment-induced viral clearance. J Clin Virol. 2018; 102: 77–83.https://doi.org/10.1016/j.jcv.2018.02.016PMID:
29525634
8. Ghimenti S, Lomonaco T, Onor M, Murgia L, Paolicchi A, Fuoco R, et al. Measurement of warfarin in the oral fluid of patients undergoing anticoagulant oral therapy. PloS one. 2011; 6(12), e28182.https:// doi.org/10.1371/journal.pone.0028182PMID:22164240
9. Lomonaco T, Ghimenti S, Piga I, Biagini D, Onor M, Fuoco R, et al. Monitoring of warfarin therapy: Pre-liminary results from a longitudinal pilot study. Microchem. J. 2018; 136: 170–176.
10. Yoshizawa JM, Schafer CA, Schafer JJ, Farrell JJ, Paster BJ, Wong DT. Salivary biomarkers: toward future clinical and diagnostic utilities. Clin Microbiol Rev. 2013; 26(4): 781–791.https://doi.org/10.1128/ CMR.00021-13PMID:24092855
11. Campanella B, Onor M, Lomonaco T, Benedetti E, Bramanti E. HS-SPME-GC-MS approach for the analysis of volatile salivary metabolites and application in a case study for the indirect assessment of gut microbiota. Anal Bioanal Chem. 2019; 411(28): 7551–7562. https://doi.org/10.1007/s00216-019-02158-6PMID:31641822
12. Mohamed HG, Idris SB, Mustafa M, Ahmed MF,Åstrøm AN, Mustafa K, et al. Impact of Chronic Peri-odontitis on Levels of Glucoregulatory Biomarkers in Gingival Crevicular Fluid of Adults with and without Type 2 Diabetes. PLoS One. 2015; 10(5): e0127660.https://doi.org/10.1371/journal.pone.0127660
PMID:25993052
13. Belstrøm D, Sembler-Møller ML, Grande MA, Kirkby N, Cotton SL, Paster BJ, et al. Microbial profile comparisons of saliva, pooled and site-specific subgingival samples in periodontitis patients. PLoS One. 2017; 12(8): e0182992.https://doi.org/10.1371/journal.pone.0182992PMID:28800622
14. AlQallaf H, Hamada Y, Blanchard S, Shin D, Gregory R, Srinivasan M. Differential profiles of soluble and cellular toll like receptor (TLR)-2 and 4 in chronic periodontitis. PLoS One. 2018; 13(12): e0200231.https://doi.org/10.1371/journal.pone.0200231PMID:30571680
15. Trindade F, Oppenheim FG, Helmerhorst EJ, Amado F, Gomes PS, Vitorino R. Uncovering the molecu-lar networks in periodontitis. Proteomics Clin. 2014; Appl, 8(9–10): 748–61.
16. Ghallab NA. Diagnostic potential and future directions of biomarkers in gingival crevicular fluid and saliva of periodontal diseases: Review of the current evidence. Arch Oral Biol. 2018; 87: 115–124.
https://doi.org/10.1016/j.archoralbio.2017.12.022PMID:29288920
17. Guillon G, Yearwood G, Snipes C, Boschi D, Reed MR. Human anti-HIV IgM detection by the OraQuick ADVANCE®Rapid HIV 1/2 Antibody Test. PeerJ. 2018; 6: e4430.
18. Dubourg G, Raoult D, Fenollar F. Emerging methodologies for pathogen identification in bloodstream infections: an update. Expert Rev Mol Diagn. 2019; 19(2): 161–173.https://doi.org/10.1080/14737159. 2019.1568241PMID:30640566
19. Seng P, Rolain JM, Fournier PE, La Scola B, Drancourt M, Raoult D. MALDI-TOF-mass spectrometry applications in clinical microbiology. Future Microbiol. 2010; 5(11): 1733–54.https://doi.org/10.2217/ fmb.10.127PMID:21133692
20. Sandrin TR, Goldstein JE, Schumaker S. MALDI TOF MS profiling of bacteria at the strain level: a review. Mass Spectrom Rev. 2013; 32(3): 188–217.https://doi.org/10.1002/mas.21359PMID:
22996584
21. La Scola B, Raoult D. Direct identification of bacteria in positive blood culture bottles by matrix-assisted laser desorption ionisation time-of-flight mass spectrometry. PLoS One. 2009; 4(11): e8041.https:// doi.org/10.1371/journal.pone.0008041PMID:19946369
22. Yssouf A, Socolovschi C, Leulmi H, Kernif T, Bitam I, Audoly G, et al. Identification of flea species using MALDI-TOF/MS. Comp Immunol Microbiol Infect Dis. 2014; 37(3): 153–7.https://doi.org/10.1016/j. cimid.2014.05.002PMID:24878069
23. Diarra AZ, Almeras L, Laroche M, Berenger JM, Kone´ AK, Bocoum Z, et al. Molecular and MALDI-TOF identification of ticks and tick-associated bacteria in Mali. PLoS Negl Trop Dis. 2017; 11(7): e0005762.
24. Tandina F, Niare´ S, Laroche M, Kone´ AK, Diarra AZ, Ongoiba A, et al. Using MALDI-TOF MS to identify mosquitoes collected in Mali and their blood meals. Parasitology. 2018; 145(9): 1170–1182.https://doi. org/10.1017/S0031182018000070PMID:29409547
25. Brioude G, Bre´geon F, Trousse D, Flaudrops C, Secq V, De Dominicis F, et al. Rapid Diagnosis of Lung Tumors, a Feasability Study Using Maldi-Tof Mass Spectrometry. PLoS One. 2016; 11(5): e0155449.
https://doi.org/10.1371/journal.pone.0155449PMID:27228175
26. Ngo LH, Veith PD, Chen YY, Chen D, Darby IB, Reynolds EC. Mass spectrometric analyses of peptides and proteins in human gingival crevicular fluid. J Proteome Res. 2010; 9(4): 1683–1693.https://doi.org/ 10.1021/pr900775sPMID:20020772
27. Ngo LH, Darby IB, Veith PD, Locke AG, Reynolds EC. Mass spectrometric analysis of gingival crevicu-lar fluid biomarkers can predict periodontal disease progression. J Periodontal Res. 2013; 48(3): 331– 41.https://doi.org/10.1111/jre.12012PMID:23050757
28. Zhang J, Zhou S, Li R, Cao T, Zheng H, Wang X, et al. Magnetic bead-based salivary peptidome profil-ing for periodontal-orthodontic treatment. Proteome Sci. 2012; 10(1): 63. https://doi.org/10.1186/1477-5956-10-63PMID:23126675
29. Chaiyarit P, Taweechaisupapong S, Jaresitthikunchai J, Phaonakrop N, Roytrakul S. Comparative eval-uation of 5-15-kDa salivary proteins from patients with different oral diseases by MALDI-TOF/TOF mass spectrometry. Clin Oral Investig. 2015; 19(3): 729–37. https://doi.org/10.1007/s00784-014-1293-3PMID:25078551
30. Tang H, Yuan C, Ma Z, Zhu C, Tong P, Gallagher JE, et al. The potentiality of salivary peptide biomark-ers for screening patients with periodontal diseases by mass spectrometry. Clin Chim Acta. 2019; 495: 278–286.https://doi.org/10.1016/j.cca.2019.04.076PMID:31026423
31. R Core Team R: A language and environment for statistical computing. R Foundation for Statistical Computing, Vienna, Austria, 2008. Available from:https://www.R-project.org/.
32. Gibb S, Strimmer K. MALDIquant: a versatile R package for the analysis of mass spectrometry data. Bioinformatics. 2012; 28(17): 2270–1.https://doi.org/10.1093/bioinformatics/bts447PMID:22796955
33. Hahsler M, Hornik K, Buchta C. Getting things in order: An introduction to the R package seriation. Jour-nal of Statistical Software. 2008; 25(3), 1–34.
34. Gibb S, Strimmer K. Differential protein expression and peak selection in mass spectrometry data by binary discriminant analysis. Bioinformatics. 2015; 31(19): 3156–62.https://doi.org/10.1093/ bioinformatics/btv334PMID:26026136
35. Gibb S, Strimmer K. Mass Spectrometry Analysis Using MALDIquant. In: Datta S, Mertens B, editors. Statistical Analysis of Proteomics, Metabolomics, and Lipidomics Data Using Mass Spectrometry. Springer International Publishing; 2017. pp. 101–124.
36. Quinlan JR. C4.5: Programs for Machine Learning. Morgan Kaufmann Publishers, 1993. 37. Loos BG, Tjoa S. Host-derived diagnostic markers for periodontitis: do they exist in gingival crevice
fluid? Periodontol 2000. 2005; 39: 53–72.https://doi.org/10.1111/j.1600-0757.2005.00129.xPMID:
16135064
38. Teles R, Sakellari D, Teles F, Konstantinidis A, Kent R, Socransky S, et al. Relationships among gingi-val crevicular fluid biomarkers, clinical parameters of periodontal disease, and the subgingigingi-val micro-biota. J Periodontol. 2010; 81(1): 89–98.https://doi.org/10.1902/jop.2009.090397PMID:20059421
39. Zhang Q, Chen B, Zhu D, Yan F. Biomarker levels in gingival crevicular fluid of subjects with different periodontal conditions: A cross-sectional study. Arch Oral Biol. 2016; 72: 92–98.https://doi.org/10. 1016/j.archoralbio.2016.08.020PMID:27565354
40. Huynh AH, Veith PD, McGregor NR, Adams GG, Chen D, Reynolds EC, et al. Gingival crevicular fluid proteomes in health, gingivitis and chronic periodontitis. J Periodontal Res. 2015; 50(5): 637–49.
https://doi.org/10.1111/jre.12244PMID:25439677
41. Ortiz-Garcı´a YM, Garcı´a-Iglesias T, Morales-Velazquez G, Lazalde-Ramos BP, Zu´ñiga-Gonza´lez GM, Ortiz-Garcı´a RG, et al. Macrophage Migration Inhibitory Factor Levels in Gingival Crevicular Fluid, Saliva, and Serum of Chronic Periodontitis Patients. Biomed Res Int. 2019; 7850392.https://doi.org/10. 1155/2019/7850392PMID:30868074
42. Sa´nchez GA, Miozza VA, Delgado A, Busch L. Relationship between salivary mucin or amylase and the periodontal status. Oral Dis. 2013; 19(6): 585–91.https://doi.org/10.1111/odi.12039PMID:23170808
43. Rabe A, Gesell Salazar M, Michalik S, Fuchs S, Welk A, Kocher T, et al. Metaproteomics analysis of microbial diversity of human saliva and tongue dorsum in young healthy individuals. J Oral Microbiol. 2019; 11(1): 1654786.https://doi.org/10.1080/20002297.2019.1654786PMID:31497257
44. Chen C, Hemme C, Beleno J, Shi ZJ, Ning D, Qin Y, et al. Oral microbiota of periodontal health and dis-ease and their changes after nonsurgical periodontal therapy. ISME J. 2018; 12(5): 1210–1224.https:// doi.org/10.1038/s41396-017-0037-1PMID:29339824
45. Chen WP, Chang SH, Tang CY, Liou ML, Tsai SJ, Lin YL. Composition Analysis and Feature Selection of the Oral Microbiota Associated with Periodontal Disease. Biomed Res Int. 2018; 3130607.https:// doi.org/10.1155/2018/3130607PMID:30581850
46. Lang NP, Suvan JE, Tonetti MS. Risk factor assessment tools for the prevention of periodontitis pro-gression a systematic review. J Clin Periodontol. 2015; 42 Suppl 16: S59–70.https://doi.org/10.1111/ jcpe.12350PMID:25496279
47. Schubert S, Kostrzewa M. MALDI-TOF MS in the Microbiology Laboratory: Current Trends. Curr Issues Mol Biol. 2017; 23: 17–20.https://doi.org/10.21775/cimb.023.017PMID:28504240
48. Albrethsen J. Reproducibility in protein profiling by MALDI-TOF mass spectrometry. Clin Chem. 2007; 53(5): 852–858.https://doi.org/10.1373/clinchem.2006.082644PMID:17395711
49. Borgaonkar SP, Hocker H, Shin H, Markey MK. Comparison of normalization methods for the identifica-tion of biomarkers using MALDI-TOF and SELDI-TOF mass spectra. OMICS. 2010; 14(1): 115–126.
https://doi.org/10.1089/omi.2009.0082PMID:20141334
50. Meuleman W, Engwegen JY, Gast MC, Beijnen JH, Reinders MJ, Wessels LF. Comparison of normali-sation methods for surface-enhanced laser desorption and ioninormali-sation (SELDI) time-of-flight (TOF) mass spectrometry data. BMC Bioinformatics. 2008; 9:88.https://doi.org/10.1186/1471-2105-9-88PMID:
18257918
51. Freiwald A, Sauer S. Phylogenetic classification and identification of bacteria by mass spectrometry. Nat Protoc. 2009; 4(5): 732–742.https://doi.org/10.1038/nprot.2009.37PMID:19390529
52. Rupf S, Breitung K, Schellenberger W, Merte K, Kneist S, Eschrich K. Differentiation of mutans strepto-cocci by intact cell matrix-assisted laser desorption/ionization time-of-flight mass spectrometry. Oral Microbiol Immunol. 2005; 20(5): 267–273.https://doi.org/10.1111/j.1399-302X.2005.00223.xPMID:
16101961
53. Lomonaco T, Ghimenti S, Piga I, Biagini D, Onor M, Fuoco R, et al. Influence of sampling on the deter-mination of warfarin and warfarin alcohols in oral fluid. PLoS One. 2014; 9(12): e114430.https://doi. org/10.1371/journal.pone.0114430PMID:25478864
54. Bellagambi FG, Degano I, Ghimenti S, Lomonaco T, Dini V, Romanelli M, et al. Determination of sali-varyα-amylase and cortisol in psoriatic subjects undergoing the Trier Social Stress Test. Microchem J. 2018: 177–184.
55. Lomonaco T, Ghimenti S, Biagini D, Bramanti E, Onor M, Bellagambi FG, et al. The effect of sampling procedures on the urate in oral fluid and lactate concentration in oral fluid. Microchem. J. 2018, 136, 255–262.
56. PreianòM, Maggisano G, Lombardo N, Montalcini T, Paduano S, Pelaia G, et al. Influence of storage conditions on MALDI-TOF MS profiling of gingival crevicular fluid: Implications on the role of S100A8 and S100A9 for clinical and proteomic based diagnostic investigations. Proteomics. 2016; 16(6): 1033– 45.https://doi.org/10.1002/pmic.201500328PMID:26711623