RESEARCH OUTPUTS / RÉSULTATS DE RECHERCHE
Author(s) - Auteur(s) :
Publication date - Date de publication :
Permanent link - Permalien :
Rights / License - Licence de droit d’auteur :
Bibliothèque Universitaire Moretus Plantin
Institutional Repository - Research Portal
Dépôt Institutionnel - Portail de la Recherche
researchportal.unamur.be
University of NamurNumidian clay deposits as raw material for ceramics tile manufacturing
Moussi, B.; Hajjaji, W.; Hachani, M.; Hatira, N.; Labrincha, J. A.; Yans, J.; Jamoussi, F.
Published in:
Journal of African Earth Sciences DOI:
10.1016/j.jafrearsci.2020.103775
Publication date: 2020
Document Version Peer reviewed version
Link to publication
Citation for pulished version (HARVARD):
Moussi, B, Hajjaji, W, Hachani, M, Hatira, N, Labrincha, JA, Yans, J & Jamoussi, F 2020, 'Numidian clay deposits as raw material for ceramics tile manufacturing', Journal of African Earth Sciences, vol. 164, 103775. https://doi.org/10.1016/j.jafrearsci.2020.103775
General rights
Copyright and moral rights for the publications made accessible in the public portal are retained by the authors and/or other copyright owners and it is a condition of accessing publications that users recognise and abide by the legal requirements associated with these rights. • Users may download and print one copy of any publication from the public portal for the purpose of private study or research. • You may not further distribute the material or use it for any profit-making activity or commercial gain
• You may freely distribute the URL identifying the publication in the public portal ? Take down policy
If you believe that this document breaches copyright please contact us providing details, and we will remove access to the work immediately and investigate your claim.
Elsevier Editorial System(tm) for Journal of African Earth Sciences
Manuscript Draft
Manuscript Number: AES7683R1
Title: Numidian clay deposits as raw material for ceramics tile manufacturing
Article Type: Research Paper
Keywords: Keywords: Clays, Tabarka, Sejnane; Ceramic tiles; Technological parameters, Tunisia.
Corresponding Author: Professor Bechir Moussi, PhD
Corresponding Author's Institution: Water Researches and Technologies Center
First Author: Bechir Moussi, PhD
Order of Authors: Bechir Moussi, PhD; Walid Hajjaji; Mondher Hachani; Nouri Hatira; Joao António Labrincha; Johan Yans; Fakher Jamoussi Abstract: We investigate the potential use in traditional ceramics of several clays collected in the Numidian Flysch Formation (Upper
Oligocene) at Tabarka, and Sejnane; Northern part of Tunisia). The
valorization of these adopts the technique of dry process, which requires a mixture of powdered clay with 7% water. This allows rapid drying of uncooked tiles. The tiles are fired at four different temperatures (1000°C, 1050°C, 1100°C and 1150°C) in order to optimize technological parameters such as shrinkage, water absorption and flexural strength. The obtained tiles show acceptable drying and firing shrinkage (not exceeding 3%), and bending strength (between 13 and 16 N/mm2) which are close to the required standards (EN ISO 10545-4, 15N/mm2 for wall tiles). The absorption ranges from 10 to 20%, which classifies these products in group BIII according to the international standards (ISO 13006 and EN ISO 10545-3). Variation of shrinkage and water absorption with the firing temperature reveals that optimal range is 1125-1150°C for the Tabarka samples, whereas the Sejnane products might be fired at lower values (~ 1025°C). The Tabarka fired pieces exhibit strong brightness. These
results suggest that these latter clays could be used for white products such as sanitary ware formulations while those from Sejnane ones are more appropriated for colored (red) applications. The X-ray diffraction on the fired tiles powders shows the formation of quartz which is initially present in the crude clays, and mullite that is present at all firing temperatures. Moreover, the presence of mullite due to the richness of Al2O3 in Tabarka clays could support their refractory properties. Research Data Related to this Submission
---
There are no linked research data sets for this submission. The following reason is given:
SUBMISSION OF PAPER
Dear editor,
We are attaching the paper entitled " Numidian clay deposits as raw material for
ceramics tile manufacturing" submitted to Journal of African Earth Science. The
authors are:
B. Moussi, W. Hajjaji, M. Hachani, N.Hatira, J.A. Labrincha, J. Yans, F.Jamoussi
The complete address of the corresponding author is:
Bechir Moussi, PhD
Water Research and Technologies Centre Borj Cedria Goressources laboratory
273 CERTE, Soliman, Tunisia 8020 Fax: +216 79 325 802 Email: [email protected] : [email protected] Sincerely yours, B. Moussi 1/10/2020 Cover letter
Reviewer #1: Main comments:
Authors refer along the text to "clay samples", but it is better to write "clayey samples". Corrected
The granulometry is coarser than in a common clay (>60% are greater than 2 microns), and the quartz content is very high.
The particle size distribution was carried out by the series of sieves on the clays and the sand and then supplemented by the laser microgranulometry on the clayey fraction lower than 63 micrometers.
With the observed value of Fe2O3 content, sample O1 can have a maximum of 11% of
siderite, and not 18%;
with the observed value of CaO content, sample RGS can have a maximum of 14% of calcite, and not 22%;
with the observed value of K2O, sample O1 cannot have 20% of illite and 7% of I-S, and only
a maximum of 2% illite is compatible with 0.16% of K2O in this sample.
Calculation of percentages of minerals was rectified using XRD and chemical analysis. New values are then given.
Sample RGS. Please describe this sample in the "Methods" section, and the reason to select it for mixtures. A similar comment can be done for "Sand" and "Feldspar" samples.
Completed and I give the reason for use
Problems in figure numbers. From figure 2, they are wrong. Please carefully revise them and place right numbers to figures along the text.
Corrected
Line 183. Sample O1 do not show higher illite content. Please revise and try to find other arguments.
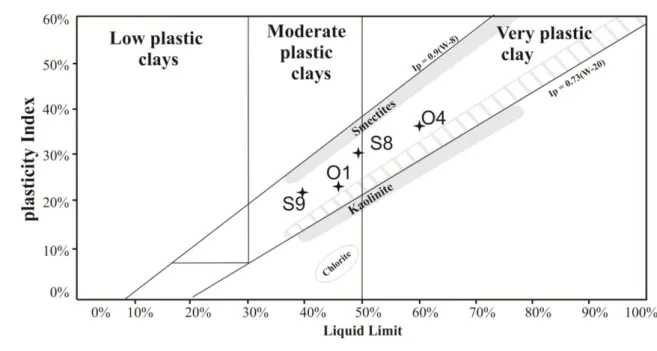
The Holtz & Kovacs (Fig. 3) classified these clays as moderate plastic, with the exception of O4 which is considered highly plastic. The large amount of clay minerals (75%) can explain this plasticity behavior of this last sample.
In fact I made a mistake, it is the sample O4 and not O1 has a highly plastic behavior
Line 187. Sample O1 includes only 0.16% of K2O. For this reason, this sentence is not true. Perhaps something is wrong with the chemical analysis.
*Revision Notes
The calculation of the percentage of the minerals has been rectified based on the chemical analyzes therefore the amount of illite is reduced and what makes the phrase right.
Line 192. The Tabarka clays do not show higher phyllosilicates content. Please rewrite the sentence.
Nevertheless, the Tabarka clays are relatively finer (Fig.4) this is probably due to the fineness of the quartz particles and the phyllosilicates richness (~ 65%).
Lines 207-209. Samples exhibited similar phyllosilicate content. So, this is not the reason. Besides, sample O4 do not include mixed-layers I-S.
A higher shrinkage is recorded on the Sejnane samples due to the richness in melting (sum Fe2O3, MgO, CaO, Na2O and K2O equal to 11%) compared to Tabarka clays (4%). These fluxes tend to promote vitrification and increase shrinkage (Tite et Maniatis, 1975, in Cultrone et al., 2001)
Please revise figure legends, and indicate on it the names of the samples. Figure 6 are not "Bigot curves of the clays samples", but only of two of them.
Corrected
Data included on Figure 9 and table 3 are the same. No need to include both, figure and table, on the manuscript. Please select only one of them. Besides, lines 216-217 repeat the same data. Please delete it.
I deleted figure 8. The table must remain in the manuscript; lines 216-217 are deleted Along the text there is confusion with the names of the samples. Sometimes Tabarka is used, and others Sidi Bader, or Sidi El Bader, and sometimes Sejnane and others Om Tebal. Please homogenize the names when referring to samples. In any case, I do not know the reason to call samples S8, S9, O1 and O4. It is better to use S1, S2, O1 and O2.
The names of samples in the text were modified (Tabarka and Sajnane)
The samples were named according to their location in the lithological log. If I change S1, S2, T1 and T2, there will then be an incompatibility with the lithological section.
I am not sure that figures including x-ray diffractograms are necessary. Figure including x-ray diffractograms are deleted
Minor comments:
Line 74. The verb "is" is lacking. Besides, "papers" must be "paper" "is" aded
Line 86. To delete the parenthesis befoe "acronym". If not, when cited Guerrera et al., 1993, there will be two of them.
Parenthesis deleted
Line 95. …to fill high density…? Something is lacking here.
Sediment density = significant thickness of sediment
The sediments were deposited in a large complex of turbidite channels to fill high sediment density observed over tens of kilometers
Line 112. Talbi, 1998 (not Talbi et al.,) Rectify
Line 134. Write greeks letters for alpha and lambda.
(Cu-Kα radiation (1,540598Ǻ),
Line 149. alfa alumina? Please revise and write greeks letter.
By using α-Al2O3
Line 179. were also (not "was also) Corrected remark
Lines 201-204. To delete. I do not know why authors include this sentence here. It adds nothing.
Deleted
Line 219. …BIII group of international standards. Please add reference here
BIII group of international standards (ISO 13006)
Lines 221-222. This must be described in the "Method" section. This part was added in method section
Line 225. A good pressure? Please indicate the value for this.
Lines 232-233. Figure 10 correlates Firing temperature and Firing shrinkage. Please revise. The numbers of the figures and their attributions have been revised.
Lines 250-251. Microstructure is not detected by X-ray diffractometry. Please rewrite
The fired ceramics tiles MS8 show a mineralogical composition formed by mullite, quartz, and diopside, detected by X-ray diffraction (Fig. 9).
Figure 12. Legends for minerals in the diffraction peaks are very close among them. It is very difficult to read.
Corrected
Figure 13. Please indicate on the microphotos the name of the samples, and the temperature (line252).
Corrected
Line 259. Addition or carbonated clay… Authors add 20% of RGB to all the mixtures. Please explain the reason to maintain this percentage in all cases.
The addition of carbonated clay reduced the firing temperatures. Carbonated clay (RGS) was added (20%) in all mixtures with the aim of increasing the CaO content and promoting the formation of a glassy phase (Kazmi et al., 2017) because these crude clays have a low CaO content (table 1). Moreover, the presence of calcite, dolomite or both can influence the formation of different minerals at high temperatures (Trindade et al., 2010). The presence of fluxing oxides including Fe2O3 tend to reduce the temperature at which a partial melt is formed (Abdelmalek et al., 2017). The iron oxide is the main colorant in clayey materials, responsible for the reddish color observed after firing (Abajo, 2000).
Line 641. Figure 67? Corrected
Reference added
Homogenize references. Sometimes the year of publication is not among brackets Please add Tunisia in keywords
Reviewer #2:
Title changed
Numidian clay deposits as raw material for ceramics tile manufacturing
INTRODUCTION: the state of the art about the use of Numidian clays, particularly those from Tabarka and Sejnane, is missing. In particular, I cannot see any reason why the previous study: Bennour, A., Mahmoudi, S., Srasra, E., Boussen, S., & Htira, N. (2015). Composition, firing behavior and ceramic properties of the Sejnène clays (Northwest Tunisia). Applied Clay Science, 115, 30-38, has been neglected. Please, define better the current level of knowledge on ceramic uses of Numidian clays (not only in Tunisia, if possible) and consequently improve the aims of the manuscript.
Rectified introduction
In this perspective, and for the purpose of researching clay deposits for ceramics, several research studies on Tunisian clay materials have been carried out (Baccour et al., (2009); Khemakhem et al., (2009). Hajjaji et al., (2010). Medhioub et al., (2010). Hachani et al., (2012). Hedfi et al., (2014, 2016); Ben M’barek Jemaï et al., (2015); Hammami-Ben Zaied et al., (2015); Bennour et al., (2015, 2017); Ben Salah et al., (2016, 2018); Boussen et al., (2016); Mahmoudi et al., (2016, 2017); Zouaoui et al., (2017); Chihi et al., (2019); Kamoun et al., (2019)).
The aim of this article is to use the Numidian clays from the Tabarka and Sejnane region, which are developing regions in the ceramic industry, compare the products obtained and provide a database that could be used by investors.
Numidian clays from Sejnane have been studied and valorised in the field of ceramics (Bennour et al., 2015; Moussi, 2012). Bennour et al. (2015) studied the composition and firing behavior of these clays as a material for ceramics. Moussi (2012) studied the suitability of the Numidian clays of Cap Serrat, Gamgoum, Om Tebal and Aouinet to be used in ceramic tiles. He proved that these clays can provide important potential raw material for the manufacture of ceramic tiles. Industrially these clays are very little used in the manufacture of ceramic tiles because of their distance from the factories which are dense in the Tunisian coastal region and Cap Bon. Some small deposits are exploited for artisanal pottery.
MATERIALS: one sample, RGS, was not described. The description of RGS was done
METHODS: standard deviation must be indicated in all tables and error bars in graphs. Added on table N1 and 3, error bar added on fig. 8
The shaping of the clay into pieces of dimension 15x15x30mm (to measure the weight and length of wet pieces) requires adding water to the raw powder until a normal paste that does not stick to fingers is acquired (until 25-30%).
RESULTS should be compared with the literature about ceramic clays in Tunisia (and other countries, if possible) in terms of chemical and mineralogical composition and particle size distribution. Othewise, the manuscript appears to be a mere technical report.
A comparison has been made
RESULTS, XRD: it should be better, since samples are just four, to show all patterns (at least as supplementary material). In fact, it is not possible to compare sample O1, which is said to contain I/S layers, with S9 that appears in Fig. 3, that apparently contains some mixed-layers as well.
The first Reviewer asked to remove the X-ray diffractograms, he assumed it was useless to show them. otherwise i have all drx and i can add them
RESULTS, XRF: all sums close far from 100%; this is despite loss on ignition is higher than expectable from mineralogical composition; any explanation? It is not related which is the source of some components: MgO (especially in samples O), Na2O in O1, Fe2O3 in all samples but O1, CaO in all samples but RGS. This will be important during discussion about firing transformations!
The total loss on ignition is relatively high in the Tabarka samples (10.78%) compared to the Sejnane samples (9.77%). This loss on ignition is dependent on the decomposition of clay minerals (kaolinite), the removal of absorbed and crystalline water and the alkali content. The high loss on ignition detected in RGS carbonate clay is 14.35%, it is due to the decomposition of kaolinite and carbonates.
RESULTS, XRD vs XRF: data unfortunately do not always match! O1: quartz seems to be in defect for available silica; illite and siderite are in excess with respect to available K2O and Fe oxide, respectively; perhaps, a (Fe,Mg)CO3 term? and a Na-rich I/S instead of illite? S8 and S9: similar chemical composition but strongly different % of kaolinite and illite; quartz % seems to be in excess.
Calculation of percentages of minerals was rectified using XRD and chemical analysis. New values are then given.
TABLE 1: decimal separator must be point. TABLE 2: % wt missing. Done
RESULTS, PARTICLE SIZE should be discussed more in detail, as from Fig. 5 there are peculiar distributions, like O clays: sand+clay fractions and practically no silt!
RESULTS, PLASTICITY should be discussed with reference to both particle size and mineralogy, particularly the occurrence of expandable clay minerals.
The discussion on plasticity is changed.
The Holtz & Kovacs (Fig. 3) classified these clays as moderate plastic, with the exception of O4 which is considered highly plastic. The large amount of clay minerals (75%) can explain this plasticity behavior of this last sample. Hajjaji et al. (2010) have shown that when the quantity of phyllosilicates increases, the limits of Atterberg also increase. This plastic
behavior of the samples is closely related to the presence of coarse grains of silts and sands as well as the mineralogical composition. Although these clays are placed above the domain of kaolinite and illite in the diagram of Holtz & Kovacs these clays are rich in kaolinite this is explained by the richness in grain of sand which decrease the index of plasticity.
RESULTS, BIGOT CURVE: which is a suitable behavior for industrial clays in Tunisia (or elsewhere?)
Result Bigot curves was rectified
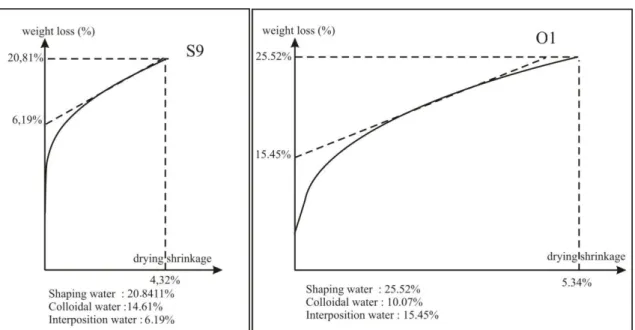
The drying behavior is a parameter used in the ceramic industry as the prime indicator for selection of the raw material (Dondi et al., 1998, Meseguer, 2010). This behavior is deduced from the Bigot curves. According to the curves, we notice a total mass loss of 20.8% for the Tabarka clays and 25.5% for the Sejnane clays. This loss of mass is characterized by two stages. The first mass loss consists of the colloidal water loss which is 14.61% for the Tabarka clays and 10.07% for that of Sejnane. This proves that the latter are characterized by a faster drying than Tabarka clays. The second loss of mass is linked to the departure of the interposition water which are 6.19% and 15.45% respectively for S9 and O1. According to these results, Tabarka clays have a slow drying behavior which suggests the addition of a degreaser.
RESULTS, MINERALOGY OF FIRED bodies: gehlenite is cited at line 202, but diopside appears in Figs 11-12, which of the two?
Gehlenite is a transient phase which does not appear in favor of the diopside. these lines 201-204 have been deleted.
Albite-anorthite-sanidine are reported at line 246, but from XRD patterns it can hardly concluded about the occurrence of three different feldspars, newly formed during firing
According to the XRD results, albite and anorthite are present but sanidine does not appear. But according to Liee et al. (2003) these three phases appear together. in this case it is necessary to delete the the sanidine formation.
"as well as potassic feldspars (sanidine)" this term was deleted
! Even the occurrence of mullite, looking in detail at XRD patterns is questionable. Suggestion: put an inset in Figs 11 and 12 with enlarged pattern, e.g. 20-40°2theta or so, to support your interpretation.
The discussion of the XRD models for the fired product is rewritten to show the formation of mullite and the other phases.
Since some figures have been deleted, the numbers of figures 11 and 12 become 9 and 10. Figures 9 and 10 of XRD are revised.
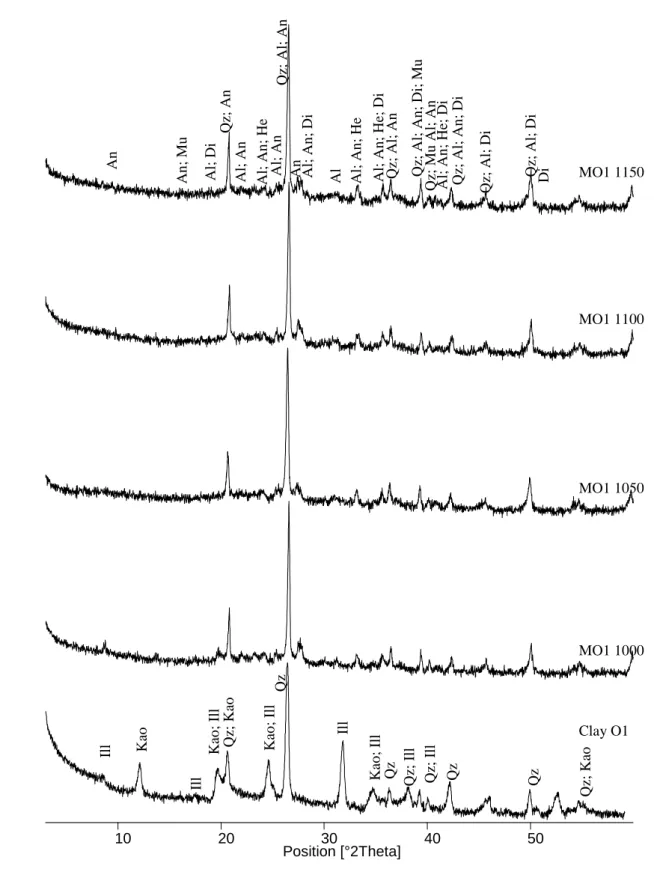
The firing transformations are represented by X-ray diffraction in figures 9 and 10. The X-ray diffractions of the raw mixtures before firing are compared with those fired at 1000, 1050, 1100 and 1150 °C. The crude mixtures show the richness in Kaolinite and in illite in the presence of quartz. According to DTA, the kaolinite disappears at 550°C, on the other hand from 1000°C (both case of MO1 1000 and S8 1000) the amount of illite decreases to disappear at 1050 ° C. From 1100 ° C, the beginning of the formation of mullite is recorded (reference code: 2-431) marked by the peak at 5.39Ǻ. Mullite is an important ceramic material because of its low density, high thermal stability, and stability in severe chemical environments (Cao et al., 2004). For a higher temperature (1150 °C), a peak at 4.06Ǻ only for fired products of Tabarka records the formation of cristobalite (reference code 1-76-939). A peak at 2.94Ǻ appears on the X-rays diiffractograms of the all fired product of Tabarka and Sejnane attributed to the formation of the diopside (reference code 1- 83-1820). The Sejnane clays are rich in iron oxide (Table 1). These iron oxides contributed to the formation of hematite (Fig.10) recorded only on fired products of Sejnane and marqued by a peak at 2.69Ǻ (code reference 1-1053) which ensures a certain rigidity of the ceramics tiles (high bending strength), due to its fluxing character. The quartz initially present in the mixtures of raw clays persists during all firing phases. The presence of silicon, alkaline and calco-alkali compounds support the formation of plagioclases (albite and anorthite) (Lee et al., 2008) which appear from 1000 ° C but their quantities increase depending on the temperature.
RESULTS, TECHNOLOGICAL DATA are compared with standard requirements for wall tiles that are usually attained by the ceramic industry using carbonate-containing clays (there are clear guidelines in the literature). Mention should be done that batches were designed to maximize the use of Numidian clays and improvements are expected by properly adjusting the recipes.
TECHNOLOGICAL DATA
In this work, we tried to popularize the quality of these Numidian clays to businessmen to invest in the northwest of Tunisia. These clays are devoid of carbonates. However, the amount of RGS carbonated clay added which contains 14% calcite is 20% in the mixtures. This means that the amount of calcite in the mixture does not exceed 3% (2.8%). The purpose of adding this clay is to create more fluxing to promote the densification and vitrification of the products, and to improve the resistance to bending.
CONCLUSIONS: I would have expected some general statement about geology > mineralogical composition > properties > possible uses (you have submitted to the J Afr Earth Sciences, not a ceramic journal!).
The Tabarka and Sejnane clays, which belong to the Numidian Flysch, whose thicknesses can reach 3000 meters, were studied in order to decipher their use in ceramic manufacturing. The characterization of the raw clays shows a mineralogy composition dominated by kaolinite and illite and relatively high quartz content for the two sites of Tabarka and Sejnane. Chemical analyzes show a significant richness in SiO2; this can be explained by the presence of clays
and silica sand. The mineralogical and chemical results are consistent. According to the particle size distribution curves, the Sejnane clays have a larger coarse particle size fraction compared to those of Tabarka which influences the percentage of sand additions as degreaser. These clays were tested in the manufacture of ceramic tiles. Technological tests show the aptitude of these raw materials to be used in the manufacture of ceramic tiles on an industrial scale. The aspect of ceramic tiles is acceptable with characteristics close to the required standards. In particular, the drying and firing shrinkages are low, the flexural strength and the water absorption are also within the standard limits. Tabarka ceramic tiles have a white color due to the richness in kaolinite and the rarity of iron oxides. These clays can be used as raw materials for ceramic tiles. Sejnane ceramic tiles have a red color due to the richness of iron oxide initially present in raw clays. These very abundant Numidian clays alternate in succession with metric, sometimes decametric, levels of consolidated sandstone. These geological outcrops extended to the northwest of Tunisia in the Tellian domain, present immense geological deposits of industrially useful raw material.
1 2 3 4 5 6 7 8 9 10 11 12 13 14 15 16 17 18 19 20 21 22 23 24 25 26 27 28 29 30 31 32 33 34 35 36 37 38 39 40 41 42 43 44 45 46 47 48 49 50 51 52 53 54 55 56 57 58 59 60 61 62 63 64 65 Highlights
Potential use in traditional ceramics of Numidian Flysch was investigated
Obtained tiles show acceptable firing shrinkage 3% and bending strength at 16 N/mm2 Shrinkage and WA optimal range is 1150°C for Tabarkaand 1025°Cfor Sejnane samples Fired tiles shows the formation mullite, especially in Tabarka clays richer in Al2O3
Abundant clayey geological raw material of Numidian can be used on ceramic industry
Numidian clay deposits as raw material for ceramics tile manufacturing
1 2
B. Moussi1*, W. Hajjaji2, M. Hachani3, N. Hatira4, J.A. Labrincha5, J. Yans6 & F.
3
Jamoussi1
4 5
1 Georessources Laboratory, CERTE, 273 - 8020 Soliman, Tunisia 6
2 Natural Water Treatment Laboratory, CERTE, 273 - 8020 Soliman, Tunisia 7
3 University of Carthage Higher Institute of Environmental Science and Technology of 8
Borj Cedria, B.P. n° 1003 2050 Hammam Lif, Tunisia 9
4 National Office of Mines 24, Street of Energy, 2035 - Charguia – Tunis, BP: 215-10
10801 Tunis Cedex – Tunisia 11
5 Materials and Ceramic Engineering Dept & CICECO. University of Aveiro. 3810-193 12
Aveiro. Portugal 13
6 Department of Geology, University of Namur, ILEE, Institute of Life, Earth and 14
Environment - 61, rue de Bruxelles, B-5000 Namur, Belgium 15
16 17
* Author to whom correspondence should be addressed; phone: +216 58 795 598; fax: +216 18 79 325 802; email: [email protected] 19 20 21 22 23 24 25 26 27
*Revised manuscript with tracked changes
2
Abstract
28 29
We investigate the potential use in traditional ceramics of several clays collected in the
30
Numidian Flysch Formation (Upper Oligocene) at Tabarka, and Sejnane; Northern part
31
of Tunisia). The valorization of these adopts the technique of dry process, which
32
requires a mixture of powdered clay with 7% water. This allows rapid drying of
33
uncooked tiles. The tiles are fired at four different temperatures (1000°C, 1050°C,
34
1100°C and 1150°C) in order to optimize technological parameters such as shrinkage,
35
water absorption and flexural strength. The obtained tiles show acceptable drying and
36
firing shrinkage (not exceeding 3%), and bending strength (between 13 and 16 N/mm2)
37
which are close to the required standards (EN ISO 10545-4, 15N/mm2 for wall tiles).
38
The absorption ranges from 10 to 20%, which classifies these products in group BIII
39
according to the international standards (ISO 13006 and EN ISO 10545-3). Variation of
40
shrinkage and water absorption with the firing temperature reveals that optimal range is
41
1125-1150°C for the Tabarka samples, whereas the Sejnane products might be fired at
42
lower values (~ 1025°C). The Tabarka fired pieces exhibit strong brightness. These
43
results suggest that these latter clays could be used for white products such as sanitary
44
ware formulations while those from Sejnane ones are more appropriated for colored
45
(red) applications. The X-ray diffraction on the fired tiles powders shows the formation
46
of quartz which is initially present in the crude clays, and mullite that is present at all
47
firing temperatures. Moreover, the presence of mullite due to the richness of Al2O3 in
48
Tabarka clays could support their refractory properties.
49 50
Keywords: Clays, Tabarka, Sejnane; Ceramic tiles; Technological parameters, Tunisia.
51 52
3
1. Introduction
53 54
The Numidian Flysch is a widespread Formation of the Tell chain located in the
55
Northern part of Tunisia. It contains successions of clayey levels and consolidated
56
sandstones. Previous works have been conducted to refine the geological knowledge of
57
the Numidian Flysch (e.g., Rouvier, 1977; Fildes et al., 2009; Yaich et al., 2000;
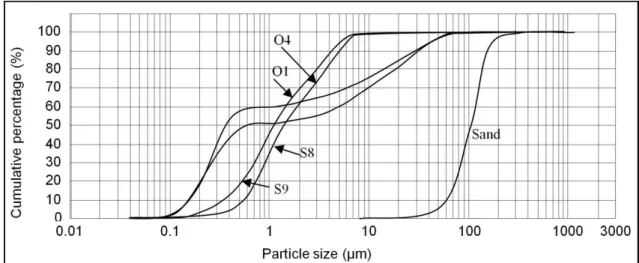
58
Bouaziz et al., 2002; Talbi et al., 2008; Riahi et al., 2010). Other studies have
59
documented Pb-Zn mineralizations associated with the Numidian Clays, structurally
60
controlled by hydrothermalism (e.g. Decree et al., 2008; Abidi et al., 2010; Jemmali et
61
al., 2011, 2013). Felhi et al. (2008) characterized the Numidian kaolinitic clays of
62
Tabarka.
63
Although Tunisia is a small country (163,610 km2), the production of ceramic tiles is
64
developing steadily (26 million m2 in 2007, growing by 12% in the last five years), due
65
to the increasing demands of national building programs and challenges created by new
66
opening markets (Moussi et al., 2011). There are approximately 94 Tunisian factories
67
specialized in ceramic manufacturing, consuming about 420.000 tons in 2011 (Jeridi et
68
al., 2014) and the development of the construction sector. Constant efforts of the
69
economic development offices are focused on exploration for new deposits to support
70
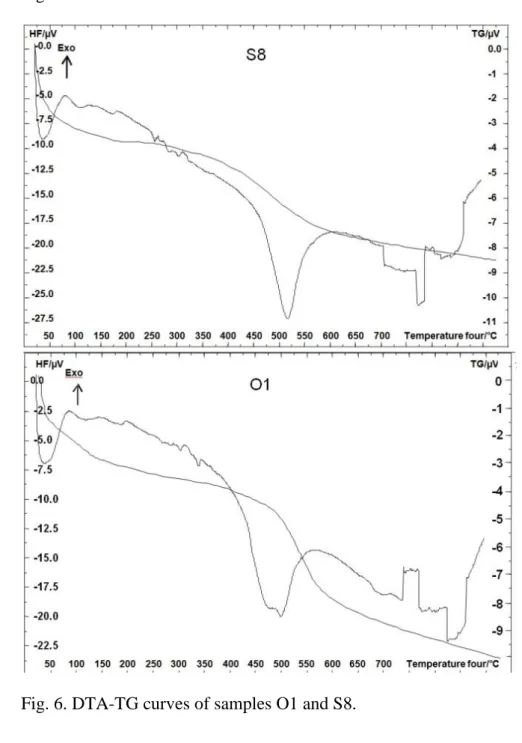
the increasing consumption needs, and the widespread ceramic production sites
71
(Medhioub et al., 2012).
72
In this perspective, and for the purpose of researching clay deposits for ceramics,
73
several research studies on Tunisian clay materials have been carried out (Baccour et
74
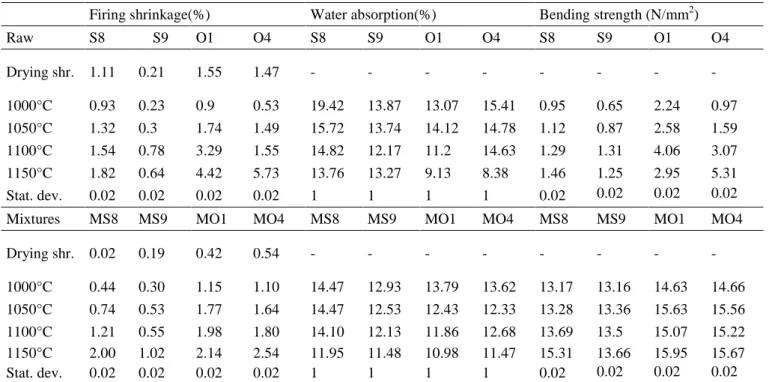
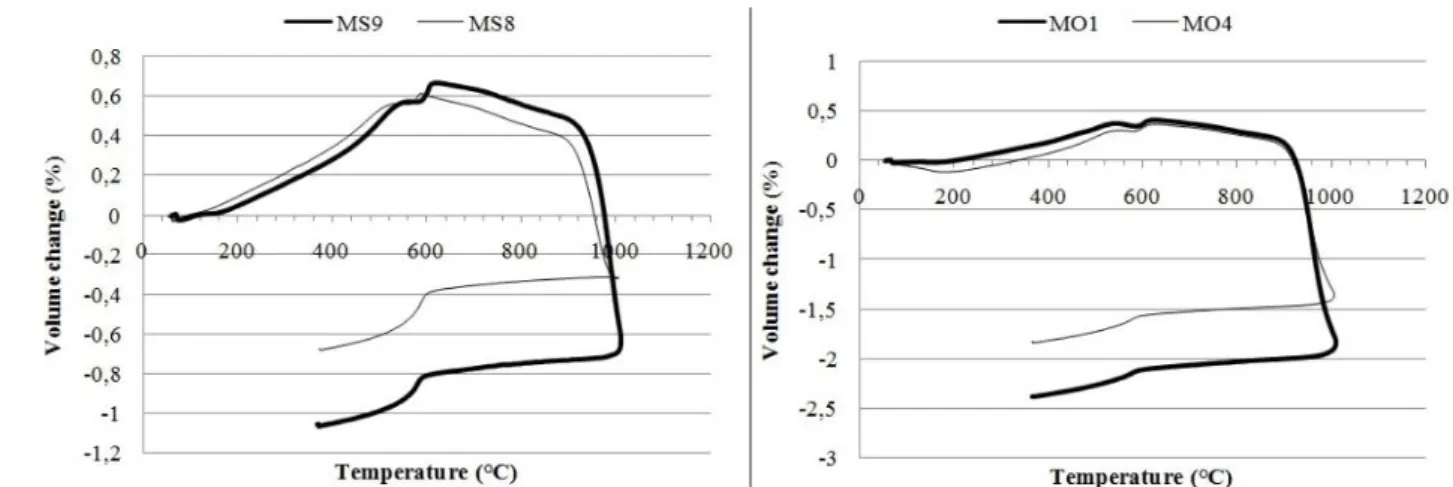
al., (2009); Khemakhem et al., (2009). Hajjaji et al., (2010); Medhioub et al., (2010).
75
Hachani et al., (2012); Hedfi et al., (2014, 2016); Ben M’barek Jemaï et al., (2015);
76
Hammami-Ben Zaied et al., (2015); Bennour et al., (2015, 2017); Ben Salah et al.,
4
(2016, 2018); Boussen et al., (2016); Mahmoudi et al., (2016, 2017); Zouaoui et al.,
78
(2017); Chihi et al., (2019); Kamoun et al., (2019)).
79
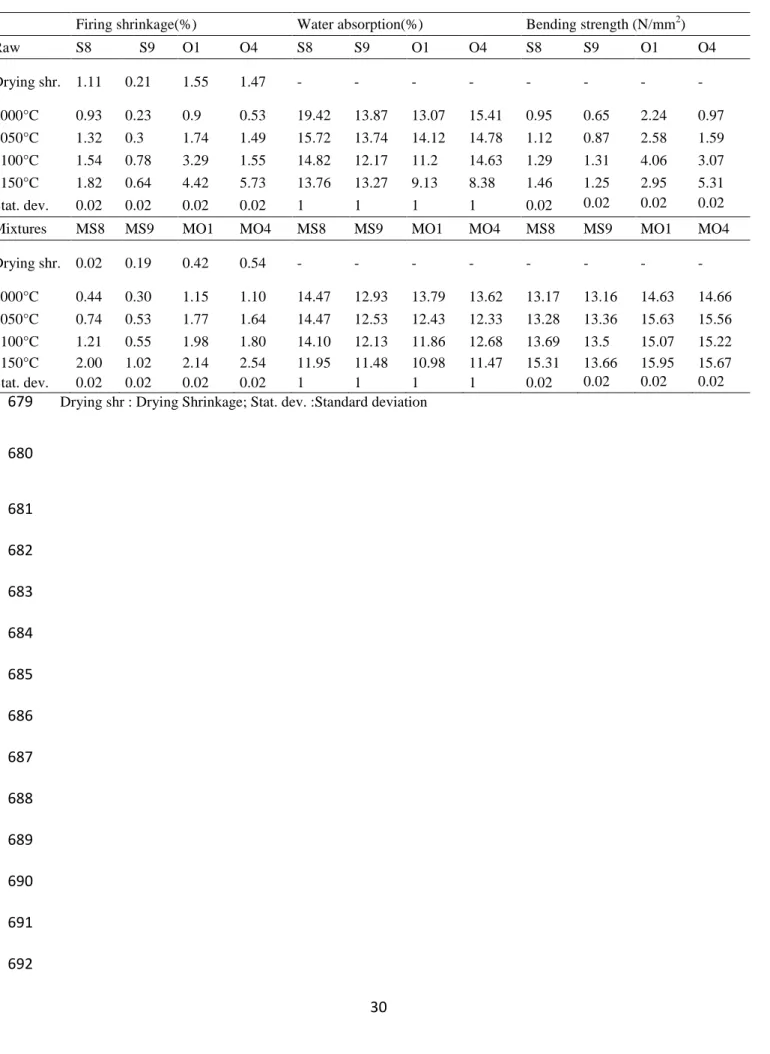
The aim of this article is to use the Numidian clays from the Tabarka and Sejnane
80
region, which are developing regions in the ceramic industry, compare the products
81
obtained and provide a database that could be used by investors.
82
Numidian clays from Sejnane have been studied and valorised in the field of ceramics
83
(Bennour et al., 2015; Moussi, 2012). Bennour et al. (2015) studied the composition and
84
firing behavior of these clays as a material for ceramics. Moussi (2012) studied the
85
suitability of the Numidian clays of Cap Serrat, Gamgoum, Om Tebal and Aouinet to be
86
used in ceramic tiles. He proved that these clays can provide important potential raw
87
material for the manufacture of ceramic tiles. Industrially these clays are very little used
88
in the manufacture of ceramic tiles because of their distance from the factories, which
89
are dense in the Tunisian coastal region and Cap Bon. Some small deposits in the
90
northwest of Tunisia were exploited for artisanal pottery.
91 92
2. Geological setting
93 94
Clays collected for this study belong to the Numidian Flysch Formation,
Oligocene-95
Miocene in age (Rouvier, 1977; Felhi et al., 2008; Riahi et al., 2010).The Numidian
96
Flysch results from the infilling of aperi-Mediterranean basin created between the two
97
main tectonic events related to the Alpine Maghrebide belt (e.g. Guerrera et al., 1993
98
and references therein; Frizon de Lamotte et al., 2000). The first event was linked to the
99
subduction of the Tethyan oceanic strip that separated Gondwana and the Alkapeca
100
acronym from “Alboran basin” and the main internal massifs, from west to east
5
Kabylian massifs in Algeria, Peloritain Mountains in Sicily and Calabria (see Guerrera
102
et al., 1993). The second is known as the Alpine phase and was formed by collision
103
between the dismembered Alkapeca region and Africa. The West Mediterranean
104
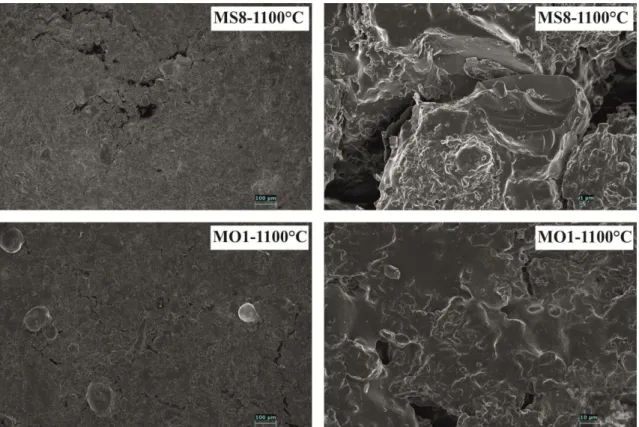
oceanic basin was created between these two main events, with an initial rifting stage
105
(30-21 Ma, i.e., late Oligocene-Aquitanian) followed by a drifting stage with the
106
Sardinia’s counterclockwise rotation during Burdigalian-Serravalian (Jolivet et
107
Faccenna, 2000).
108
The sediments were deposited in a large complex of turbidite channels to fill high
109
sediment density observed over tens of kilometers (Yaich et al., 2000). This series can
110
locally reach ~3000 m thick and consists of three lithological units (Rouvier 1977,
111
1994). The series of Zouza is the lower unit; Late Oligocene in age, and has a thickness
112
of ~1000 m in the Nefza region. It consists of a succession of sandstone lenses, clays
113
locally oxidized, and quite rare conglomeratic horizons. The middle unit is Kroumirie
114
sandstones, Late Oligocene in age. This latter is composed of layers of sandstone, clay
115
and conglomerates with pebbles of quartz. The upper unit or series Babouch, Early
116
Miocene in age, consists of gray clays. Based on planktonic foraminifera biozones,
117
Yaich et al. (2000) date the Numidian Formation in an interval comprised between
118
Early Rupelian and Early Burdigalian. Riahi et al. (2010) present a new dating
119
(Oligocene to early Miocene) for the two first units, based on new biostratigraphic data
120
from the analysis of planktonic foraminifera. Yaich et al. (2000), mean while, proposed
121
the establishment of the Numidian between Langhian and Serravallian (13 Ma),
122
corresponding to the intrusion of endogenous igneous rocks in the area (see Decrée et
123
al., 2014).
6
The origin of the sediments forming the Numidian was widely debated. The provenance
125
from the North is based on the presence of current ripples in Numidian formations
126
(Wildi, 1983; Parize et al., 1986; Talbi, 1998). This hypothesis is consistent with recent
127
studies that suggest a European Nordic sediment provenance, based on the study of
128
zircons (Fildes et al., 2009). Alternatively, Wezel (1970), based on the morphology of
129
quartz grains, proposes a Southern source of Numidian, from the Nubian Sandstone.
130
Accordingly, the analysis of sedimentary structures by Hoyez (1975) suggests that the
131
Numidian is located at the edge of Saharian zone. This hypothesis was recently
132
overturned by Yaich et al. (2000), based on biostratigraphic arguments. Anyway, the
133
origin of the kaolinitic-illitic clays would be related to the weathering/alteration of the
134
feldspars of the Numidian Flysch (Crampon, 1973). The area experienced complex
135
phases of weathering and alteration, leading to the neoformation of halloysite/kaolinite
136
in several rocks (Decree et al., 2008; Sghaier et al., 2014). The lithological succession
137
(Fig. 1 and 2) of the two studied sites provides a good estimate of the reserves of
138
kaolinitic-illitic clays in the area.
139
3. Materials and methods
140 141
Two sites were studied: Sidi El Bader close to Tabarka city and Om Tebal close to
142
Sejnane city (Fig.1). Sidi El Bader area is located east of the town of Tabarka limited by
143
the Jebel Touila at its east side. Four representative samples (50 kg each) were
144
collected: S8 and S9 from Tabarka, O1and O4 from Sejnane.
145
Mineralogical analyses of bulk samples were carried out by X-ray diffraction (XRD),
146
using an X-ray Panalytical X’Pert Pro diffractometer (Cu-Kα radiation (1,540598Ǻ), 2θ
147
range from 3º to 60º). The relative amounts of phases were estimated by measuring the
7
areas of the main peaks (Torres- Ruiz et al., 1994; López-Galindo et al., 1996) using the
149
Panalytical X'Pert HighScore Plus software. Oriented aggregates were treated with
150
ethylene glycol and heated at 550ºC for 2 h. The chemical composition of powdered
151
samples was determined by X-ray fluorescence; with a Panalytical Axios Dispersive
152
XRF Spectrometer using the conventional techniques (Meseguer et al., 2009).The
loss-153
on-ignition was evaluated from the weight difference between samples heated at 100ºC
154
and 1000ºC. The results are expressed in concentration percent of oxides. The
155
Casagrande method was selected for the determination of the Atterberg limits (LCPC,
156
1987; Grabowska-Olszewska, 2003) with an experimental error of ±3%. The grain-size
157
distribution of as-received samples was obtained by wet sieving, using an AFNOR
158
series device adopted by the French standardization system. The fraction <63 µm was
159
completed by laser diffraction using Mastersizer 2000 granulometer. Thermal analyses
160
TDA-TGA were performed using Netzsch STA409/429 equipment with a heating rate
161
of 10 K min-1 and by using α-Al2O3 as the inert marker. Dilatometric analysis was
162
conducted on a Netzsch 402E dilatometer at a maximum temperature of 1000ºC (5ºC
163
min-1 heating rate). The thermal behavior was studied by DTA-TG analyses (Setaram
164
apparatus) in air atmosphere with 10 °C min−1 heating rate. The Bigot curves were
165
obtained under room-temperature conditions by using an Adamel barelattograph. The
166
clayey material was crushed and rolled for a coarse grain size of 1mm. The shaping of
167
the clay requires certain amount of water into pieces of dimension 15x15x30mm (to
168
measure the weight and length of wet pieces). These pieces were subjected to drying in
169
open air conditions in the apparatus of Adamel Barellatograph. This device can track
170
and trace drying curve according to the mass loss. At the end of drying, the pieces were
171
weighed and oven dried for 24 hours at 110°C for measuring the final mass and dry
8
lengths. These parameters allow at measuring the drying shrinkage and water required
173
for shaping, interposition and colloidal.
174
The ceramics tiles were shaped by dry pressing and the material was dried and crushed
175
before sieving. The moisture level was adjusted to 6-7 wt% and the powders were
176
pressed (250 bars) into 50x50x100 mm pieces (Moussi et al., 2011). These tiles were
177
dried overnight at 40ºC + 8h at 110°C. Then the samples were fired at maximum
178
temperatures of 1000, 1050, 1100 and 1150ºC (15ºC/min, heating rate and 30 min dwell
179
time), approaching industrial conditions (Jeridi et al., 2008). Shrinkage on drying and
180
firing was determined manually. The bending strength of the fired bodies was
181
determined on a LCV F006 NANETTI Fleximeter and the water absorption was
182
assessed following European standards (UNI EN ISO 10545-3). Phases formed after
183
firing were characterized by XRD while the microstructure was studied by scanning
184
electron microscopy (SEM, Hitachi SU70, Bruker AXS detector, Quantax software). To
185
improve the quality of ceramic products obtained with crude clays, separate mixtures
186
were prepared by combining Tabarka and Sejnane clays with silica sand, carbonated
187
clay (RGS) and feldspars (Table 2). These mixtures have undergone the same processes
188
as shaping, drying and firing as previously described with ceramic tiles without
189
additions.
190
Carbonated clay was added to the mixtures due to the richness of calcium carbonate
191
(14%). An addition of carbonate is therefore desired in order to create a porosity. In
192
fact, these carbonates are considered to be fluxes, extending glassy phases (Kazmi et al.,
193
2017). Feldspars have been added for the same reason as a fluxing agent. Silica sand has
194
been added to enhance the hardening qualities and increase the flexural strength.
9
RGS carbonate clay is collected in the Nefza region, between Tabarka and Sejnane. It is
196
a clay of Lutetian-Bartonian age locally qualified "argile noire à boules Jaune" with
197
dolomitic concretions. These clays belong to the tellian facies (Rouvier, 1977). The
198
added sand belongs to the Beglia formation of lower Miocene age harvested from the
199
Saouaf region.
200
4. Results and discussion
201
The X- ray diffraction patterns (Table 1) show a kaolinitic-illitic content of the samples
202
collected from both studied sites. Mixed-layers I-S were also identified in O1 sample.
203
Moreover, an important quartz fraction (superior to 25%) is detected and directly
204
influences the rheological behavior of clays. The Holtz & Kovacs (Fig. 3) classified
205
these clays as moderate plastic, with the exception of O4 which is considered highly
206
plastic. The large amount of clay minerals (75%) can explain this plasticity behavior of
207
this last sample. Hajjaji et al. (2010) have shown that when the quantity of
208
phyllosilicates increases, the limits of Atterberg also increase. This plastic behavior of
209
the samples is closely related to the presence of coarse grains of silts and sands as well
210
as the mineralogical composition. Although these clays are placed above the domain of
211
kaolinite and illite in the diagram of Holtz & Kovacs these clays are rich in kaolinite
212
this is explained by the richness in grain of sand which decrease the index of plasticity.
213
This variation could lead to the appearance of cracks after drying process (Jordan et al.,
214
1999). These results are comparable to the mineralogical study by Bennour et al.,
215
(2015). they prove the existence of kaolinite, illite and I/S mixed-layers associated with
216
quartz. As for the study by Hammami-Ben Zaied et al., (2015), these authors studied
217
Miocene Gram clays. They proved an excessive richness of these clays in quartz but
10
despite these results they proved the aptitude for the use of these excessively degreaser
219
clays for the manufacture of Ceramic bricks with mixtures.
220
The silica contents (SiO2) are within the desirable range as ceramic raw material, not
221
exceeding 60wt.% (Tab.1). The concentrations of alkaline oxides (Na2O and K2O) are
222
relatively low and consistent with the contents of illite and absence of fluxing agents
223
such as feldspars. The iron oxides and hydroxides contents in the Tabarka clays are very
224
low (0.01 to 1.14 wt. %) in comparison to Sejnane clays (5.5 to 7.6 wt. % of Fe2O3).
225
This could generate white ceramic product. The total loss on ignition is relatively high
226
in the Tabarka samples (10.78%) compared to the Sejnane samples (9.77%). This loss
227
on ignition is dependent on the decomposition of clay minerals (kaolinite), the removal
228
of absorbed and crystalline water and the alkali content. The high loss on ignition
229
detected in RGS carbonate clay is 14.35%, it is due to the decomposition of kaolinite
230
and carbonates.
231
The particle size distribution curves of the clays studied show similar shapes for both
232
Tabarka and Sejnane clays. According to the particle size distribution curves, the
233
fraction less than 2 μm is large about 63 -70% for S8 and S9 while O1 and O4 are on
234
the order of 53 to 63%. The high fraction contents below 2 µm is closely related to the
235
mineralogical composition rich in kaolinite. The coarse silty and sandy fractions are
236
then important. These results are in perfect correlation with the mineralogy of clays.
237
The study of these particle size curves as well as the Bigot curves reveal the quantities
238
of sand to be added to the mixture used for the manufacture of ceramic tiles. The
239
particle size distribution curve of the added sand shows a coarse fraction not exceeding
240
300 µm. its medium sized sand fig. 4).
11
The drying behavior can be deduced from the Bigot curves (Fig. 5). These clays have a
242
relatively high drying shrinkage (around 5%) consistent with the plasticity values. The
243
drying behavior is a parameter used in the ceramic industry as the prime indicator for
244
selection of the raw material (Dondi et al., 1998, Meseguer, 2010). This behavior is
245
deduced from the Bigot curves. According to the curves, we notice a total mass loss of
246
20.8% for the Tabarka clays and 25.5% for the Sejnane clays. This loss of mass is
247
characterized by two stages. The first mass loss consists of the colloidal water loss
248
which is 14.61% for the Tabarka clays and 10.07% for that of Sejnane. This proves that
249
the latter are characterized by a faster drying than Tabarka clays. The second loss of
250
mass is linked to the departure of the interposition water which are 6.19% and 15.45%
251
respectively for S9 and O1. According to these results, Tabarka clays have a slow
252
drying behavior which suggests the addition of a degreaser.
253
According to the particle size distribution curves, Tabarka clays are finer than Sejnane
254
clays and therefore require a significant amount (15%) of sand as a degreaser. however
255
only 5% of sand has been added to Sejnane clays and this is to avoid faults during
256
drying and firing and to ensure good resistance to bending. The thermal behavior of
257
these Numidian clays is reported in Figure 6. The water of hydration in the interlayer
258
space disappeared at a temperature between 60 and 100°C. An endothermic peak on the
259
DTA curve appears around the same temperatures. At 550°C, the expulsion of
260
constitution water dehydroxylation is depicted by a second major endothermic peak. At
261
this stage, the mass loss is between 8 and 10%, which is in accordance with the LOI
262
(Table 1).
263
Formulations of the ceramic tiles are reported in Table 2. The Tabarka samples S8 and
264
S9 show the similar expansion behavior with a total shrinkage of 0.66% and 1.05% for
265
S8 and S9, respectively (Table 3, Fig. 7). A higher shrinkage is recorded on the Sejnane
12
samples due to the richness in melting (sum Fe2O3, MgO, CaO, Na2O and K2O equal to
267
11%) compared to Tabarka clays (4%). These fluxes tend to promote vitrification and
268
increase shrinkage (Tite et Maniatis, 1975, in Cultrone et al., 2001).
269 270
Concerning the bending strength, the values increase with temperature but do not
271
exceed 5.3MPa (table 3) and are below the required standards of ceramic wall tiles (ISO
272
10545-4, 2004). As a consequence, various corrections in compositional mixtures were
273
implemented to improve the mechanical strength, as discussed below.
274
The values of the drying shrinkage are of the order of 1.11% and 0.21% for ceramic
275
tiles obtained from S8 and S9, respectively, and 1.55 and 1.47 for O1 and O4. These
276
values are relatively high and should be minimized using the silica sand addition. The
277
water absorption classifies these products in the BIII group of international standards
278
(ISO 13006) with the exception of products O1 and O4 fired at 1150°C that belong to
279
the BII group.
280
Compared to previous compositions (made exclusively of crude clays), the mixture
281
products inhibited lower drying shrinkages close to 0.5 % (Table3). The firing
282
shrinkage is lower than 2.5%. A good pressure (250- 280bars) applied to the tiles at a
6-283
7% humidity rate helped to avoid the lamination problems (Padoa, 1982). The bending
284
strengths range from 13 to16 N/mm2 and are considered as close to the international
285
standards for wall tiles requirements (15MPa) (Table3). This criterion reflects a good
286
densification of the ceramics tiles. In comparison with the values of parameters of the
287
crude products (Table 3), the results of the various parameters of the ceramics tiles
288
resulting from the mixtures show an significant improvement. The water absorptions,
289
ranging from 10.98% to 14.48% (Fig.8), classify these products as group BIII (ISO
290
13006- and NF EN ISO10545-3). The Figure 9 shows the relationship between water
13
absorption and firing shrinkage. The intersection of both curves allows at choosing the
292
optimum temperatures for firing these products in order to minimize the processing
293
costs. According to these observations, it obvious that the Tabarka products require
294
higher firing temperatures (1120 to 1150°C). These temperatures are close to the
295
sanitary ware ceramic firing temperatures, and consequently these clays can constitute a
296
good raw material for these applications. For Sejnane based products, the firing
297
temperature should be lower (about 1020°C). These ceramic tiles are dark red colored
298
and present a good quality aspect.
299
The firing transformations are represented by X-ray diffraction in figures 9 and 10. The
300
X-ray diffractions of the raw mixtures before firing are compared with those fired at
301
1000, 1050, 1100 and 1150 °C. The crude mixtures show the richness in Kaolinite and
302
in illite in the presence of quartz. According to DTA, the kaolinite disappears at 550°C,
303
on the other hand from 1000°C (both case of MO1 1000 and S8 1000) the amount of
304
illite decreases to disappear at 1050 ° C. From 1100 ° C, the beginning of the formation
305
of mullite is recorded (reference code: 2-431) marked by the peak at 5.39Ǻ. Mullite is
306
an important ceramic material because of its low density, high thermal stability, and
307
stability in severe chemical environments (Cao et al., 2004). For a higher temperature
308
(1150 °C), a peak at 4.06Ǻ only for fired products of Tabarka records the formation of
309
cristobalite (reference code 1-76-939). A peak at 2.94Ǻ appears on the X-rays
310
diffractograms of the all fired product of Tabarka and Sejnane attributed to the
311
formation of the diopside (reference code 1-83-1820). The Sejnane clays are rich in iron
312
oxide (Table 1). These iron oxides contributed to the formation of hematite (Fig.10)
313
recorded only on fired products of Sejnane and marqued by a peak at 2.69Ǻ (code
314
reference 1-1053) which ensures a certain rigidity of the ceramics tiles (high bending
315
strength), due to its fluxing character. The quartz initially present in the mixtures of raw
14
clays persists during all firing phases. The presence of silicon, alkaline and calco-alkali
317
compounds support the formation of plagioclases (albite and anorthite) (Lee et al.,
318
2008) which appear from 1000 ° C but their quantities increase depending on the
319
temperature.
320
Few pores are visible on the SEM observations (Fig.11). At the temperature of 1050°C
321
and 1100°C, these materials show the same crystalline structure with the presence of
322
siliceous glass. The SEM observation of ceramic tiles MO1 reveal the presence of
323
significant amount of glassy phase. The quartz occupies the voids between the particles.
324
These products can be judged of good quality because of their good technological
325
characteristics and appearance. There are no major defects detected during drying and
326
firing. Defects revealed upon the use of raw clay were corrected by the addition of sand
327
and feldspar. The addition of carbonated clay reduced the firing temperatures.
328
Carbonated clay (RGS) was added (20%) in all mixtures with the aim of increasing the
329
CaO content and promoting the formation of a glassy phase (Kazmi et al., 2017)
330
because these crude clays have a low CaO content (table 1). Moreover, the presence of
331
calcite, dolomite or both can influence the formation of different minerals at high
332
temperatures (Trindade et al., 2010). The presence of fluxing oxides including Fe2O3
333
tend to reduce the temperature at which a partial melt is formed (Abdelmalek et al.,
334
2017). The iron oxide is the main colorant in clayey materials, responsible for the
335
reddish color observed after firing (Abajo, 2000 in Abdelmalek et al., 2017).
336
These materials can be considered as refractory because of its high content in kaolinite
337
and sand (Hachani et al., 2012). Therefore, these Oligocene clays of northern Tunisia
338
can be a good raw material for the manufacture of ceramic tiles. The clays of Tabarka
339
can be used in the production of sanitary ceramics due to their fine clay particles and
15
their good densification during firing at high temperatures. These trials made in the
341
laboratory must be supplemented with other mixtures of clays and on an industrial scale
342
to confirm their ability to be a good raw material for ceramics.
343
Conclusion
344
The Tabarka and Sejnane clays, which belong to the Numidian Flysch, whose
345
thicknesses can reach 3000 meters, were studied in order to decipher their use in
346
ceramic manufacturing. The characterization of the raw clays shows a mineralogy
347
composition dominated by kaolinite and illite and relatively high quartz content for the
348
two sites of Tabarka and Sejnane. Chemical analyzes show a significant richness in
349
SiO2; this can be explained by the presence of clays and silica sand. The mineralogical
350
and chemical results are consistent. According to the particle size distribution curves,
351
the Sejnane clays have a larger coarse particle size fraction compared to those of
352
Tabarka which influences the percentage of sand additions as degreaser. These clays
353
were tested in the manufacture of ceramic tiles. Technological tests show the aptitude of
354
these raw materials to be used in the manufacture of ceramic tiles on an industrial scale.
355
The aspect of ceramic tiles is acceptable with characteristics close to the required
356
standards. In particular, the drying and firing shrinkages are low, the flexural strength
357
and the water absorption are also within the standard limits. Tabarka ceramic tiles have
358
a white color due to the richness in kaolinite and the rarity of iron oxides. These clays
359
can be used as raw materials for ceramic tiles. Sejnane ceramic tiles have a red color
360
due to the richness of iron oxide initially present in raw clays. These very abundant
361
Numidian clays alternate in succession with metric, sometimes decametric, levels of
362
consolidated sandstone. These geological outcrops extended to the northwest of Tunisia
16
in the Tellian domain, present immense geological deposits of industrially useful raw
364 material. 365 366 Acknowledgment 367 368
This research was financed by the Ministry of Higher Education, Scientific Research
369
and Technology (Tunisia), and the Belgian-Tunisian project “Valorisation des argiles”
370
of the Wallonie-Bruxelles International (WBI). Thanks are due for the support of the
371
CTMCCV (Centre Techniques de Matériaux de Construction de Céramique et du Verre
372 Tunis - Tunisie). 373 374 375 376 377 378 379 380 381 382 383 384 385 386 387
17
References
388
Abajo, M.F., 2000. Manual sobre fabricación de baldosas, tejas y ladrillos. Ed.
389
Beralmar S. A., (Barcelona).
390
Abdelmalek, B., Rekia, B., Youcef, B., Lakhdar, B., Nathalie, F., (2017). Mineralogical
391
characterization of Neogene clay areas from the Jijel basin for ceramic purposes
392
(NE Algeria -Africa). Applied Clay Science, 136, 176–
393
183. doi:10.1016/j.clay.2016.11.025.
394
Abidi R., Slim-Shimi N., Somarin A., Henchiri M., (2010). Mineralogy and fluid
395
inclusions study of carbonate-hosted Mississippi valley-type Ain AllegaPb–Zn–Sr–
396
Ba ore deposit, Northern Tunisia. Journal of African Earth Sciences 57, (2010) 262–
397
272. https://doi.org/10.1016/j.jafrearsci.2009.08.006
398
Baccour H., Medhioub M., Jamoussi F., & Mhiri T. (2009). Influence of firing
399
temperature on the ceramic properties of Triassic clays from Tunisia. Journal of
400
Materials Processing Technology, 209(6), 2812–2817.
401
doi:10.1016/j.jmatprotec.2008.06.055
402
Ben M’barek Jemaï M., Sdiri A., Errais E., Duplay J., Ben Saleh I., Zagrarni M. F., &
403
Bouaziz S. (2015). Characterization of the Ain Khemouda halloysite (western
404
Tunisia) for ceramic industry. Journal of African Earth Sciences, 111, 194–201.
405
doi:10.1016/j.jafrearsci.2015.07.014
406
Ben Salah I., M’barek Jemaï M. B., Sdiri A., Boughdiri M., & Karoui N. (2016).
407
Chemical and technological characterization and beneficiation of Jezza sand (North
408
West of Tunisia): Potentialities of use in industrial fields. International Journal of
409
Mineral Processing, 148, 128–136. doi:10.1016/j.minpro.2016.01.016
18
Ben Salah I., Sdiri A., Ben M’barek Jemai M., & Boughdiri M. (2018). Potential use of
411
the lower cretaceous clay (Kef area, Northwestern Tunisia) as raw material to
412
supply ceramic industry. Applied Clay Science, 161, 151–162.
413
doi:10.1016/j.clay.2018.04.015
414
Bennour A., Mahmoudi S., & Srasra E. (2017). Physico-chemical and geotechnical
415
characterization of Bargou clays (Northwestern Tunisia): application on traditional
416
ceramics. Journal of the Australian Ceramic Society, 54(1), 149–159.
417
doi:10.1007/s41779-017-0136-5
418
Bennour A., Mahmoudi S., Srasra E., Boussen S., & Htira N. (2015). Composition,
419
firing behavior and ceramic properties of the Sejnène clays (Northwest Tunisia).
420
Applied Clay Science, 115, 30–38. https://doi.org/10.1016/j.clay.2015.07.025
421
Bouaziz S., Barrier E., Soussi M., Turki M. M., Zouari H., (2002). Tectonic evolution
422
of the northern African margin in Tunisia from paleostress data and sedimentary
423
record. Tectonophysics, 357, (2002) 227-253.
https://doi.org/10.1016/S0040-424
1951(02)00370-0
425
Boussen S., Sghaier D., Chaabani F., Jamoussi B., & Bennour A. (2016).
426
Characteristics and industrial application of the Lower Cretaceous clay deposits
427
(Bouhedma Formation), Southeast Tunisia: Potential use for the manufacturing of
428
ceramic tiles and bricks. Applied Clay Science, 123, 210–221.
429
doi:10.1016/j.clay.2016.01.027
430
Cao X. Q., Vassen R., Stoever D., (2004). Ceramic materials for thermal barrier
431
coatings. Journal of the European Ceramic Society 24, (2004) 1–10.
432
https://doi.org/10.1016/S0955-2219(03)00129-8
19
Chihi R., Blidi I., Trabelsi-Ayadi M., & Ayari F. (2019). Elaboration and
434
characterization of a low-cost porous ceramic support from natural Tunisian
435
bentonite clay. Comptes Rendus Chimie. doi:10.1016/j.crci.2018.12.002
436
Crampon N., (1973). L’extrême nord tunisien. Aperçu stratigraphique, pétrologie et
437
structural. Livre jubilaire M. Solignac. Ann. Min. et Géol. Tunis.; 26, pp. 49–85.
438
Decrée S., De Putter T., Yans J., Moussi B., Recourt P., Jamoussi F., Bruyère D. &
439
Dupuis C., (2008). Iron mineralization in marginal basins surrounding Fe-Pb-Zn
440
sulphide deposits (Neogene Tunisian Tell, Nefza district): mixed influence of
441
pedogenesis and hydrothermal alteration. Ore Geology Reviews 33, 3-4, 397-410.
442
https://doi.org/10.1016/j.clay.2018.07.007
443
Decrée S., Marignac C., Liégeois J. P., De Putter T., Yans J., Ben Abdallah R.,
444
Demaiffe D., (2014). Miocene magmatic evolution in the Nefza District (Northern
445
Tunisia). Lithos 192-195, 240-258. https://doi.org/10.1016/j.lithos.2014.02.001
446
Dondi, M., Marsigli, M., Ventura, I., 1998. Sensibilità all'es siccamento e caratteristiche
447
porosimetriche delle argille italiane per laterizi. Ceramurgia 28, 1–8.
448
Felhi M., Tlili A., Gaied M. E., Montacer M., (2008). Mineralogical study of kaolinitic
449
clays from Sidi El Bader in the far north of Tunisia. Applied Clay Science 39 p208–
450
217.
451
Fildes C., Stow D.A.V., Riahi S., Soussi M., Patel U., Milton J.A., Marsh S., (2009).
452
European Provenance of the Numidian Flysch in northern Tunisia. Terra Nova, Vol
453
22, No. 2, 94–102. https://doi.org/10.1111/j.1365-3121.2009.00921.x
20
Frizon de Lamotte D., Saint-Bezar B., Bracene R., Mercier E., (2000). The two main
455
steps of the Atlas building and geodynamics of the western Mediterranean.
456
Tectonics, 19, 740–761. https://doi.org/10.1029/2000TC900003
457
Grabowska-Olszewska B., (2003). Modelling physical properties of mixtures of clays:
458
example of two component mixture of kaolinite and montmorillonite. Applied Clay
459
Science, 22, 251-259. https://doi.org/10.1016/S0169-1317(03)00078-4
460
Guerrera F., Martin-Algarra A., Perrone V., (1993). Late Oligocene-Miocene
syn-late-461
orogenic successions in western and central Mediterranean chains from the Betic
462
Cordillera to the Southern Apennines: Terra, Nova, 5, 525–544.
463
https://doi.org/10.1111/j.1365-3121.1993.tb00302.x
464
Hachani M., Hajjaji W., Moussi B., Medhioub M., Rocha F., Labrincha J. A., &
465
Jamoussi F. (2012). Production of ceramic bodies from Tunisian Cretaceous clays.
466
Clay Minerals, 47(01), 59–68. doi:10.1180/claymin.2012.047.1.59
467
Hajjaji W., Moussi B., Hachani M., Medhioub M., Lopez-Galindo A., Rocha F.,
468
Jamoussi F. (2010). The potential use of Tithonian–Barremian detrital deposits from
469
central Tunisia as raw materials for ceramic tiles and pigments. Applied Clay
470
Science, 48(4), 552–560. doi:10.1016/j.clay.2010.03.003
471
Hammami-Ben Zaied F., Abidi R., Slim-Shimi N., & Somarin A. K. (2015). Potentiality
472
of clay raw materials from Gram area (Northern Tunisia) in the ceramic industry.
473
Applied Clay Science, 112-113, 1–9. doi:10.1016/j.clay.2015.03.027
474
Hedfi I., Hamdi N., Rodriguez M. A., & Srasra E. (2016). Development of a low cost
475
micro-porous ceramic membrane from kaolin and Alumina, using the lignite as
21
porogen agent. Ceramics International, 42(4), 5089–5093.
477
doi:10.1016/j.ceramint.2015.12.023
478
Hedfi I., Hamdi N., Srasra E., & Rodríguez M. A. (2014). The preparation of
micro-479
porous membrane from a Tunisian kaolin. Applied Clay Science, 101, 574–578.
480
doi:10.1016/j.clay.2014.09.021
481
Holtz, R.D., Kovacs, W.D., 1981. An Introduction to Geotechnical Engineering.
482
Prentice-Hall, Englewood Cliffs, New Jersey.
483
Hoyez, B., (1975). Dispersion du matériel quartzeux dans les formations aquitaniennes
484
de Tunisie septentrionale et d’Algérie nord-orientale. Bull. Soc. Géol. Fr., XVII :
485
1147-1156.
486
ISO 10545-3, (1995). Ceramic tiles. Part 3: Determination of water absorption, apparent
487
porosity, apparent relative density and bulk density. Edition 1.
488
ISO 10545-4, (2004). Ceramic tiles. Part 4: Determination of modulus of rupture and
489
breaking strength. Edition 2.
490
ISO 13006, (2012). Carreaux et dalles céramiques — Définitions, classification,
491
caractéristiques et marquage.
492
Jemmali N., Souissi F., Carranza E. J. M., Vennemann T. W., (2013). Mineralogical and
493
Geochemical Constraints on the Genesis of the Carbonate-Hosted Jebel Ghozlane
494
Pb-Zn Deposit (Nappe Zone, Northern Tunisia). Resource Geology Volume 63,
495
Issue 1, January 2013, Pages 27-41. doi: 10.1111/j.1751-3928.2012.00208.x
496
Jemmali N., SouissiF., Villa I. M., Vennemann T. W., (2011). Ore genesis of Pb-Zn
497
deposits in the Nappe zone of Northern Tunisia: Constraints from Pb-S-C-O isotopic