HAL Id: tel-03207612
https://tel.archives-ouvertes.fr/tel-03207612
Submitted on 26 Apr 2021HAL is a multi-disciplinary open access
archive for the deposit and dissemination of sci-entific research documents, whether they are pub-lished or not. The documents may come from teaching and research institutions in France or abroad, or from public or private research centers.
L’archive ouverte pluridisciplinaire HAL, est destinée au dépôt et à la diffusion de documents scientifiques de niveau recherche, publiés ou non, émanant des établissements d’enseignement et de recherche français ou étrangers, des laboratoires publics ou privés.
electrodes
Guillaume Braesch
To cite this version:
Guillaume Braesch. Electrocatalysts for the Borohydride Oxidation Reaction : From model surfaces to non-noble fuel cell electrodes. Materials Science [cond-mat.mtrl-sci]. Université Grenoble Alpes [2020-..], 2020. English. �NNT : 2020GRALI059�. �tel-03207612�
Pour obtenir le grade de
DOCTEUR DE L’UNIVERSITE GRENOBLE ALPES
Spécialité : Matériaux, Mécanique, Génie Civil, Électrochimie
Arrêté ministériel : 25 mai 2016
Présentée par
Guillaume BRAESCH
Thèse dirigée par Marian CHATENET
et codirigée par Antoine BONNEFONT et Elena SAVINOVA,
préparée au sein du Laboratoire d’Electrochimie et de Physicochimie des
Matériaux et des Interfaces (LEPMI)
dans l'École Doctorale I-MEP 2
Electrocatalyseurs pour la Réaction
d'Oxydation des Borohydrures : des surfaces
modèles aux électrodes non-nobles de piles à
combustible
Electrocatalysts for the Borohydride
Oxidation Reaction: From model surfaces to
non-noble fuel cell electrodes
Thèse soutenue publiquement le « 24 Novembre 2020 », devant le jury composé de :
Monsieur Christophe COUTANCEAU
Professeur, Université de Poitiers, Rapporteur (Président du jury)
Madame Elena BARANOVA
Professeure, Université d’Ottawa, Rapporteure
Madame Laëtitia DUBAU
Chargée de recherche, CNRS, Examinatrice
Monsieur Renaut MOSDALE
Docteur, Pragma Industries, Examinateur
Monsieur Gaël MARANZANA
Professeur, Université de Lorraine, Invité
Madame Elena SAVINOVA
Professeure, Université de Strasbourg, Invitée
Monsieur Marian CHATENET
Professeur, Université Grenoble-Alpes, Directeur de thèse
Monsieur Antoine BONNEFONT
iii The saddest aspect of life right now is that science gathers knowledge faster than society gathers wisdom. Isaac Asimov
v
Table of contents
Table of contents ... v
List of symbols and abbreviations ... ix
CHAPTER I:
Why the Direct Borohydride Fuel Cell ... 1
I.1 Global warming and climate change ... 3
Emission of greenhouse gases by energy and transportation sectors ... 4
Consequences of the global warming ... 6
Renewable energy and technological locks... 7
I.2 Hydrogen: a major energy vector... 11
Is hydrogen really a green fuel? ... 12
Storage and transportation of hydrogen ... 13
I.3 Development of fuel cells ... 15
Stationary applications ... 16
Transport application ... 17
Towards portable and mobile systems ... 19
I.4 The Direct Borohydride Fuel Cell ... 20
Borohydride as a fuel ... 20
I.4.1.1 Production of borohydride ... 21
I.4.1.2 Properties of borohydride ... 22
Operation principles of a DBFC ... 24
I.4.2.1 Anode materials ... 27
I.4.2.2 Cathode materials ... 29
I.4.2.3 Different membrane configurations ... 29
I.5 Conclusion and context and objectives of the PhD ... 31
CHAPTER II:
Materials and methods ... 35
II.1 Electrochemical measurements ... 37
Rotating Disk Electrode in alkaline medium ... 37
vi
II.1.2.1 Bulk polycrystalline electrodes ... 40
II.1.2.2 Nanoparticles ink preparation and deposition ... 40
Rotating Ring-Disk Electrode ... 41
II.2 Metallic nickel catalyst preparation ... 43
Nickel nanoparticles electrodeposition on carbon support ... 43
Electrochemical Surface Area Determination ... 44
Intentional oxidation of Ni surfaces ... 46
Surface treatments on 3D structured Ni supports ... 47
II.2.4.1 Hydrogen reduction treatment ... 47
II.2.4.2 Acid Etching procedures ... 47
II.2.4.3 Ni electrodeposition on etched Ni support ... 49
II.3 Characterization techniques ... 49
Microscopy methods ... 49
II.3.1.1 Transmission Electron Microscopy ... 49
II.3.1.2 Scanning Electron Microscopy ... 50
Structural and compositional characterization ... 51
II.3.2.1 X-Ray Energy Dispersive Spectroscopy ... 51
II.3.2.2 X-Ray Diffraction Spectroscopy ... 54
II.3.2.3 Inductively coupled plasma atomic emission spectrometry ... 55
Coupled spectroscopic methods ... 56
II.3.3.1 Differential Electrochemical Mass Spectrometry ... 56
II.3.3.2 In situ Fourier Transform Infra-Red spectroscopy ... 59
II.4 Fuel Cell tests ... 61
Anode preparation ... 61
II.4.1.1 NiED/GDE anode elaboration procedure ... 61
II.4.1.2 NiED-based anodeselaboration using Ni support... 62
II.4.1.3 Pt/GDL anode elaboration... 63
II.4.1.4 Preparation of the SEBS55 polymer and deposition on Ni-based anodes. 63 Unit Direct Borohydride Fuel Cell characteristics ... 64
II.4.2.1 BH4-/O2 DBFC setup... 64
vii
II.5 Computational methods ... 67
Density Functional Theory calculations ... 67
Microkinetic model calculations ... 67
CHAPTER III:
BOR mechanism on noble and model surfaces ... 73
III.1 Current understanding of the BOR on Pt electrodes ... 75
III.2 Influence of the NaBH4 concentration on the reactions pathway ... 79
Poisoning effects of surface at different borohydride concentration ... 79
Existence of additional reaction pathways ... 88
III.2.2.1 Hydrogen escape at different borohydride concentrations ... 88
III.2.2.2 Detection of BH3OH- species using RRDE ... 92
III.2.2.3 Adapting the proposed BOR model ... 98
III.3 Towards a kinetic model of the BOR on Pd surfaces ... 103
BOR on Pd: Differences with Pt and Au ... 103
Tentative explanation of the BOR mechanism on Pd ... 109
The effect of Pd structure modification ... 111
III.4 Conclusion and moving to non-noble BOR catalysts ... 121
CHAPTER IV:
Towards efficient Ni based BOR catalysts ... 125
IV.1 Importance of the state of surface of Ni ... 127
Electrochemical behavior of Ni in alkaline medium ... 127
Activity of polycrystalline Ni for the BOR ... 134
IV.2 Bimetallic “NixM” BOR catalysts ... 141
BOR activity of NixM catalysts ... 142
Is there an effect of the co-element? ... 146
IV.3 Metallic NiED/C: the best BOR catalysts? ... 149
Electrodeposited Ni nanoparticles for BOR ... 149
BOR activity compared to most used catalysts ... 156
IV.4 Tentative BOR mechanism on Ni ... 159
RDE and RRDE measurements ... 159
Coupled spectroscopic characterization on metallic Ni ... 161
IV.4.2.1 Hydrogen escape measurements using DEMS ... 162
IV.4.2.2 Fourier Transform Infra-Red spectroscopy ... 165
viii
IV.4.3.1 Binding energy of intermediate species by DFT calculations ...167
IV.4.3.2 Kinetic simulation of the BOR on metallic Ni ...169
IV.5 Conclusions ... 173
CHAPTER V:
Integration of Ni electrodes and optimization of
DBFC parameters ... 175
V.1 Elaboration of NiED/C anodes ... 177
Upscaling the NiED/C electrodes ...177
V.1.1.1 Adapting the electrodeposition procedure ...177
V.1.1.2 DBFC performance using NiED/GDE anodes ...182
Stability of NiED/GDE anode in DBFC conditions ...186
V.2 Optimization of the anode properties ... 192
Towards open nickel structures as NiED support ...192
V.2.1.1 Nickel structure characterization ...192
V.2.1.2 Tuning of the state of surface of the NFM and NFT. ...195
V.2.1.3 Nickel nanoparticle electrodeposition on etched Ni felt ...199
DBFC tests using NiED/eNFT anodes ...201
V.3 Improving the DBFC system ... 204
Integration of bipolar interfaces with Ni-based anodes ...204
Towards efficient anion exchange DBFCs ...209
V.3.2.1 Investigating anion exchange membranes ...210
V.3.2.2 DBFC tests using only non-noble catalysts ...212
V.4 Conclusions ... 214
GENERAL CONCLUSION & PERSPECTIVES ... 219
REFERENCES ... 225
ix
List of symbols and abbreviations
List of symbols:
A Geometric Surface Area
C Concentration (mol.L-1)
D Diffusion coefficient (cm².s-1)
E Potential (V vs Reference) E° Standard potential (V vs SHE) F Faraday constant (~96485 C.mol-1)
I Current (mA or A)
j Current density (mA.cm-2 or A.cm-2)
l Catalysts loading (µg.cm-2)
m Mass (g)
M Molar mass (g.mol-1)
n Number of exchanged electrons
ν Kinematic viscosity of the electrolyte (cm².s-1)
P Power density (mW.cm-2) S Surface area (cm²) T Temperature (°C or K) t Time (s or h) V Volume (L or m3) vs Scanning rate (mV.s-1) ω Rotation rate (rpm) List of abbreviations:
AFC Alkaline Fuel Cell
x
AEM Anion Exchange Membrane
AEI Anion Exchange Ionomer
AST Accelerated Stress Test
BOR Borohydride Oxidation Reaction BHR Borohydride Hydrolysis Reaction
CCM Catalyst Coated Membrane
CA Chronoamperometry
CE Counter electrode
CEM Cation Exchange Membrane
CEI Cation Exchange Ionomer
CV Cyclic Voltammetry
DBFC Direct Borohydride Fuel Cell
DEMS Differential Electrochemical Mass Spectrometry DFT Density Functional Theory
DLFAFC Direct Liquid Fed AFC
ECSA Electrochemical Surface Area ED Electrodeposition / Electrodeposited EDS Energy Dispersive Spectroscopy
FC Fuel Cell
FCEV Fuel Cell Electric Vehicle
FTIRS Fourier Transform Infra-Red Spectroscopy
GC Glassy Carbon
GDL Gas Diffusion Layer
GDE Gas Diffusion Electrode
GHG Greenhous Gas
HER Hydrogen Evolution Reaction HOR Hydrogen Oxidation Reaction
xi KL Koutecký-Levich (plots)
NFM Nickel Foam
NFT Nickel Felt
NP Nanoparticles
OCP Open Circuit Potential OCV Open Circuit Voltage OER Oxygen Evolution Reaction ORR Oxygen Reduction Reaction
PEMFC Proton Exchange Membrane Fuel Cell PTCFE Polychlorotrifluoroethylene (Kel-F®) PTFE Polytetrafluoroethylene (Teflon®) RDE Rotating Disk Electrode
RHE Reversible Hydrogen Electrode RRDE Rotating Ring-Disk Electrode SEM Scanning Electron Microscopy TEM Transmission Electron Microscopy
WE Working electrode
1
CHAPTER I: Why the Direct Borohydride
3 The first chapter of this manuscript is devoted to a brief literature review of the current ecological and economic situation we are facing. First of all, the causes and consequences of the global warming will be identified, and a possible solution to dampen this global issue through the use of renewable energies and hydrogen as an energetic vector will be presented. Then, the Direct Borohydride Fuel Cell (DBFC) will be presented as a potential technology for portable and mobile applications. Lastly, the context and objectives of this PhD will be detailed.
.
I.1 Global warming and climate change
For several years now, each summer is accompanied with several heatwaves. Their frequency, intensity and duration noticeably increased [1], resulting in high averaged temperatures in 2019 all around the world [2](Figure I.1) and new highest historic temperature recorded in more than 35 countries since 2015. Especially alarming temperatures above T = 20°C and 38°C were recorded in Antarctica and Arctic Siberia, respectively, in the first half of 2020. In 2019, the global temperature was estimated at around + 1.29°C above the temperature of the 19th century.
Figure I.1. Local temperatures, averaged over the whole 2019 year, recorded around the world and compared to the average temperature of 1951 – 1980. Reprinted from Ref [2]
4
Emission of greenhouse gases by energy and transportation sectors
Even if Earth’s climate naturally cycles between colder and warmer periods, due to several effects such as small orbital variations [3], these cycles last for millennia and the transition from one to the other is often accompanied with shorter climate change period. However, the amplitude and the rate of the warming since the last century is too large to be natural and must be due to human activities, as reported by scientists for more than thirty years [4–8]
The increase of greenhouse gas (GHG) concentration in the atmosphere is considered as the main origin of the global warming. These gases originate from various sources and applications in different proportions (given for US emissions in 2018) [9]: carbon dioxide (81%) mainly comes from the burning of fossil fuels; methane (10%) is a by-product of fossil fuel by-production and transportation and is also emitted by livestock; nitrous oxides (7%) are generated by combustion of fossil fuels, solid waste and treatment of wastewater; fluorinated gases (3%) are produced by industrial processes and present the highest global warming potential [9]. Overall, the generation of GHG is mainly driven by the production of electricity (27% in 2018 in the US [10]), using fossil resources (coal, natural gas, oil), and by the transportation sector (28% [10]), mainly due to combustion of fossil fuels in thermal engines.
Figure I.2. Annual total CO2 emissions by world region. Reprinted from [11].
Because of the constant growth of fossil fuel consumption, the annual CO2 emission has
5 community and conventions of parties (COP), gathered by the United Nations regarding the climate change since 1995 (COP1 held in Berlin), no strict actions to reduce the emissions of GHG were considered by governments so far. Because of this lack of decision, the peak emission of CO2 was not yet reached in 2018 (Figure I.2) and will not
until, at the latest, 2030 according to the Paris agreement (COP 21). Indeed, numerous countries, part of the biggest GHG emitter, ratified this agreement in 2015 with the main objective to limit the global warming to +1.5°C for the year 2100 (but such target was already proposed in 2009 [12]). Unfortunately, as shown by Figure I.3, the current policies applied to reduce the climate change impact are not sufficient to reach such goal [11]. This means that the policies voted at the COP 21 are not yet (fully) applied and are sometimes discarded, a famous example being the US government decision to withdraw from their engagement in 2019 [13] (the decision was taken in 2017 only 2 years after the ratification).
Figure I.3. Global greenhouse gas emissions and warming scenarios. Reprinted from Ref. [11].
The sanitary crisis of 2020 (SARS CoV2 pandemic) directly impacted the emission of CO2 at the world scale: because of national lockdowns and international borders closing,
transportation and energy consumption habits were modified, resulting in ca. 17% decrease of produced CO2 from January to April 2020 (compared the same period in
2019) as presented by Le Quéré et al. [14]. Unfortunately, this habits modification was only temporary and by the time of the article publication the emission levels were already back to “normal”. Another study by Zambrano-Monserrate et al. [15] showed that this pandemic will also have negative effects on the environment, such as the
6
reduced amount of waste recycled, but most importantly that decreasing GHG emissions on such short periods is not a sustainable way to reach the Paris agreement targets.
Consequences of the global warming
Going back to the pre-industrial era average temperature is not achievable with the actual development of the human society: the important population growth (1.6 billion in 1900, 7 billion in 2011, 7.7 billion in 2019 [16] requires the equivalent (or even superior) energy demand, accompanied by proportional GHG emissions as presented above. This will surely have a major impact result in direct and indirect consequences. Direct consequences are events caused by the global warming that are experienced already to this day and will aggravate in the upcoming years:
Increased probability of extreme weather events
As mentioned above, the probability and frequency of heat waves is directly increased with the global warming. Ironically, this encourages the usage of air conditioning to live and work in acceptable conditions, but in return directly amplifies the global warming by generating heat [17,18]. Less intuitively, both ends of the extreme events scale are concerned, with rising minimum temperature as well as cold waves also recorded more frequently over the past decades [19–22]. Other weather events are induced by climate changes such as droughts [23,24], heavy rains and river flooding [25–27], wildfires [28,29], storms and cyclones [27,30], and will intensify depending on the amplitude of the global warming.
Rise of the sea level
The overall increasing temperature induces melting of sea ice and glaciers [31–33] as well as a significant warming of the oceans [34,35], which all contribute to the rise of the sea level. It is possible to find small beneficial aspects from this situation, with for example new maritime routes opening that will reduce the distance of shipment between Europe and Asia [36], but its arising overall consequences will most likely be more catastrophic. According to new estimates, the sea level will rise by 1.3 meter by 2100, and more than 5 meters by 2300 if the current climate policies are maintained [37], inducing major migration crisis of coastal population (around 10% of the current total population lives below the 5 m altitude line), which already started [38]. An additional effect of the ice melting is the diminution of the ice-albedo of the planet, which will result in solar radiations being less reflected and thus more absorbed by the surface of the earth, accelerating even more its overall warming.
7
Indirect consequences of climate change
The indirect consequences are the products of all the effects described previously and will affect directly our society and environment: water and hunger crisis will be amplified as a direct repercussion of more frequent droughts; important biodiversity losses will be induced by climate change [39–42]; the propagation and behavior of infectious diseases might also be modified [43–45]; what is certain is the thawing of the permafrost, which will result in resurfacing extinct diseases from past centuries [46] or even unknown ones from past eras [47,48].
In order to limit such consequences and fall in the COP 21 “+1.5°C scenario”, it is of paramount importance to drastically reduce the overall GHG emissions. This means that the two main sources of GHG emissions (electricity production and transportation) must be addressed in priority.
Renewable energy and technological locks
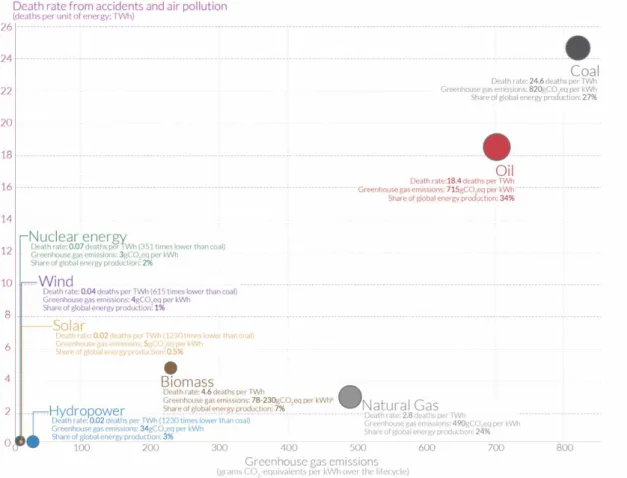
The best way to decrease the energy contribution to global warming would be to produce less and diminish the overall demand by changing our consumption habits, similarly as what was observed during the sanitary crisis of 2020. However, such drastic modifications will take years or decades to be established and in the end energy would still be required. This means that a more direct approach must be taken to decrease the GHG emissions: developing new energy technologies with no or a lesser impact on the climate change. These technologies are called renewable energies and rely on principles emitting no GHG. They are regrouped in four main sources: hydropower; wind; solar; and biomass energy technologies, and as presented on Figure I.4, generate small to no GHG. They are also presented as safer energy sources, since the death rate used on this chart is calculated from air pollution and other related accidents [49].
8
Figure I.4. The safety of the different sources of energy compared to their respective GHG emissions. Reprinted from Ref [49].
This really encourages the deployment of such technologies on a global scale. Figure I.5a shows the evolution of energy production originating from these renewable energies. Hydropower is a source well exploited since the early 1960 and the technology is pretty much mature, which explains why almost no investments are made in this sector since 2004 (Figure I.5b), and why the energy produced increases linearly: more hydropower sites are being deployed but their energy output is always the same. This is not the case for the technology exploiting other renewable resources. Biomass is slowly developed overtime but at a relatively slow pace, proportional to the dedicated small investment. On the contrary, wind and solar sources are being thoroughly investigated since the early 2000’s (Figure I.5b), which directly translates into a significant energy production increase over the last decade. In 2019, wind and solar energies produced around 19% and 13% of the total renewable electricity, which corresponded itself to 11% of the global energy production [50]. This could appear as a low percentage, but they will keep increasing in future years and reach significant portion of our energy production as made in Sweden, where more than 50% of electricity was produced from renewable resources in 2018 [51].
9 Figure I.5. (a) Global renewable energy generation by technology. Reprinted from Ref [50]. (b) Global investment in renewable energy by technology highlighting wind and solar as the main development focuses. Reprinted from Ref [49]
The nuclear energy production also proved to be an interesting source emitting no CO2
(Figure I.4). However, because it runs on radioactive minerals, it can however not be considered as a renewable energy source. Its main issue is the important quantities of radioactive waste generated that are, for now, hardly treatable. In addition, the dismantling of nuclear plants is expensive and time consuming. Moreover, major incidents such as the Chernobyl or Fukushima events made this technology the most dangerous one by common beliefs (but is in fact much safer than GHG emitting ones [49] in terms of short term effects). It was actually estimated that the use of nuclear
10
energy has prevented more than 1.8 million air pollution-related deaths and the emission of 64 Gt of CO2 [52]. The nuclear energy should therefore be used as a
transition help to greatly reduce emissions until the renewables energies reach their full potential and replace it. Unfortunately, as presented by Figure I.6, all the progress made with renewable energies is only used to decrease the production part of nuclear while the GHG emitting production is almost untouched [53]. On a more hopeful and positive note, nuclear energy production could see a major milestone achieved in the next decades with the nuclear fusion technology. It should produce great amount of energy, with no GHG emission nor radioactive wastes, and is under development in France through the ITER project [54].
Figure I.6. The share of nuclear and renewables in total electricity production. Reprinted from Ref [53].
In addition, renewable energies are not all green and several aspects limit their development. First of all, each technology is dependent on the environment, meaning it cannot be used everywhere. This basic but really important notion means that each country must adapt its energy production at a regional scale, in function of the renewable sources available and that it is primordial to continue the developments of several technologies and not focus on one system. The development of renewable sources was also accompanied by major impact on the environment regarding local populations or biodiversity, as for the main example the important negative effects of dams over their surroundings [55–57]. The hydroelectric source is the oldest one that became practical, so more research has been conducted regarding its impacts. However, studies already reveal that wind [58,59], biomass [59] and marine [60] energy productions also have negative effects on the environment. Such effects must be
11 considered and minimized to avoid making renewable sources more harmful then beneficial to the environment. Solar power appears to be the less negatively impactful technology [61] but it is important to keep in mind that human-made installations will always affect their surroundings.
Moreover, by their nature, most of the renewable sources are intermittent and will thus produce energy in a discontinued manner. Such intermittency is provoked by predictable events, such as the day/night cycle for solar or the tides for marine power, and the production can therefore be adjusted in consequence. However, clouds and winds are more complex to predict and could result in unplanned production drops. This technical barrier has been used as a break to renewable energy development because of their “unreliable nature” [62]. However, it must now be addressed: the best answer to such discontinued production is to exceed to total energy demand when possible and store this surplus to be reused when needed [63,64]. The best manner to do so it to convert the exceeding electrical energy in chemical energy via the use of electrochemical systems. Currently the most developed technologies for stationary conversion are battery systems [64–66]. However, their closed nature and the upcoming increase of renewable energy production will require to deploy fields of battery to obtain suitable storage capacity, where other open technologies, such as redox flow batteries or fuel cell/electrolyzer systems, would only require larger storage reservoir. Redox flow batteries are promising for such applications [67] but present the inconvenience of being only devoted to management of the electrical grid.
I.2 Hydrogen: a major energy vector
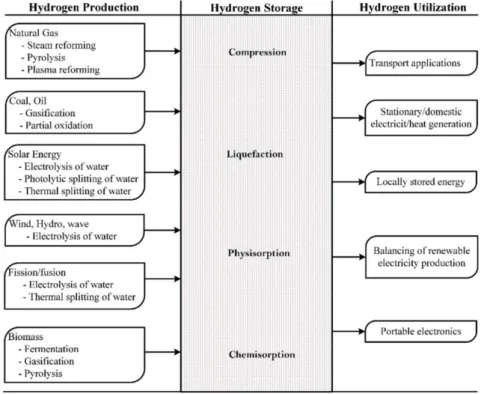
In opposition to batteries, the hydrogen produced by the renewable production surplus, using water splitting electrolyzers, is not limited to be converted back to electricity in the power grid and could be instead used as a fuel in fuel cell powered portable and mobile devices and vehicles. A recent review has fully described all the different processes involved in the hydrogen energy vector, which can be summarized by Figure I.7, from the available sources, generation and storage options and the several hydrogen fueled final applications [68].
12
Figure I.7. The hydrogen vector: sources, generation options, storage options and end-uses. Reprinted from [68]
Is hydrogen really a green fuel?
In the last decade, hydrogen was often described as (near) future fuel [69–71] because of its important energy density per unit mass (three times the one of common fossil fuels). As presented on Figure I.7, the production methods can be separated in two distinct categories: fossil fuel based, and sustainable water electrolysis. Unfortunately, around 96% of the hydrogen is produced from fossil resources today (49% from natural gas, 29% from liquid hydrocarbons, and ca. 18% from coal) [68], which contribute to significant GHG and other chemicals emission in the atmosphere [70]. The main reason is obviously economic: because of the important energy demand of water electrolysis, the resulting hydrogen production cost is high (around 4 – 8 $/kg-1 versus 1 – 2 $.kg-1
for non-sustainable production, in 2019 [72,73]). The sustainability of hydrogen is thus still questionable nowadays, but current important investments and a real trend in the “green hydrogen production”, induced by the global warming targets discussed above, can already be observed from the amount of studies published recently in this domain [74]. Such development is strongly required to reach the sustainable production target, from 0.04 Mt.y-1 in 2010 to almost 8 Mt.y-1 in 2030 [75] and the recent H2 plan in France
(7000 M€) goes in this direction.
The different utilization of hydrogen also shows highly disparate proportions. Indeed, most of the produced hydrogen is used in chemical refinery: more than 50% is used for
13 chemical reactions in Europe and over 95% for ammonia synthesis in Japan. Overall the large majority of the world hydrogen is used for petroleum refining and ammonia and methanol synthesis [68], which will also contribute to the pollution of the atmosphere with GHG or other chemicals. Again, carbon-free transportation, other mobile devices and stationary electric generation are under consequent investigations and will be presented in more detail in the following section. However, to this day, the technologies are only emerging and this energy vector is a non-negligible part of the overall GHG emissions and several years or decades will be necessary for the hydrogen vector to be fully “green”.
Storage and transportation of hydrogen
In addition to the current issues just described, it is also necessary to store the produced hydrogen and then transport it from the production to utilization sites. The large energy density of hydrogen was mentioned previously as one of the main property to consider it as an energy carrier. However, when converted to volume, this energy density is only 5.6 MJ.L-1 for a given pressure of 700 bar at 25°C (which is now three times lower than
hydrocarbon fuels). This value obtained only at high pressure asserts the difficulty to store hydrogen compared to natural gas or other liquid fuel. Several methods were developed to such end, where the state of hydrogen varies from gaseous to liquid or even solid.
Gaseous hydrogen
The main storage system is the compression of gaseous hydrogen, since it is relatively easy and straightforward. It allows to reach acceptable densities for several applications: 23.3 kg.m-3 at 350 bar and 39.2 kg.m-3 at 700 bar, which corresponds to the common
pressures of fuel cell buses and commercial fuel-cell cars respectively. It is also possible to perform cryo-compression at T = 100 K to reach a density of 39.5 kg.m-3 at relatively
low pressure of 200 bar [76]. Standardized tanks are already commercialized following strict norms to limit safety issues. This storage method presents the main drawback to require an energy-consuming compression system that decreases the overall energy efficiency of the hydrogen cycle. In addition, the high pressure most often considered is too high for standard fuel cell and electrolyzer and it must be adapted. Moreover, even after compression, the volumetric energy density of pressurized hydrogen is still low compare to gasoline, thereby increasing the transportation costs [68].
Liquid hydrogen
Another method to obtain a higher volumetric energy density is to change the state of hydrogen from gaseous to liquid (10.1 MJ.L-1). However, this process requires even more
14
point (20.2 K). It was investigated for small scale storage and even considered for fueling vehicles. However, this technology is, to this day, not viable compared to pressurized hydrogen [68].
Solid hydrogen
Because it is already complex to obtain liquid hydrogen, the methods to obtain a solid storage of hydrogen involve inserting it in other materials using physisorption or chemisorption (Figure I.7). It was proven to be an efficient method in addition to be much safer than commonly-used compressed hydrogen. Several materials can be used as insertion matrix to hydrogen such as metal hydrides [77], magnesium-based alloys [78], carbon based materials [79] or boron-based compounds [80], such as the sodium borohydride (NaBH4). This specific molecule will be thoroughly discussed in the rest of
the manuscript but as a fuel and not as a hydrogen storage medium. This method presents the advantage of being the easiest way to transport hydrogen.
Indeed, as briefly evoked above, the transportation of pressurized hydrogen is a real challenge. It is possible to distribute it to the user using either trucks or pipelines. It is also possible to use trucks with adapted tanks to deliver liquefied hydrogen. These three options present both advantages and disadvantages related to the delivery cost and also the deployment time required. Pipelines are more suited for very large transport capacity, but will be very expensive and difficult to deploy. The cheapest method is obviously to use a network of trucks, but it is not suited to handle a large production [68]. Because of the development of hydrogen related technologies and quantities produced in the upcoming years, it is mandatory to address this issue. In fact, it is nowadays one of the main barriers to the development of hydrogen vehicles in Europe: the hydrogen network is not sufficiently developed to motivate vehicle manufacturers to invest in the hydrogen technology and in return, governments do not develop the hydrogen distribution network because the demand is not important enough [81]. However, significant funding is now unlocked and numerous hydrogen stations are now under development [81,82].
To conclude on hydrogen, it is a really promising energy vector that would unlock low GHG energy production and transportation due to its interesting energetic properties and its possible sustainable production. However, much efforts are still required to reach such a sustainable network since the main sources and utilization of hydrogen are currently directly contributing to the atmosphere pollution by either GHG or other chemicals. Nonetheless, the recent governmental engagements and technology developments are encouraging to see the hydrogen vector potential correctly used in a near future.
15
I.3 Development of fuel cells
Hydrogen can be converted back to electrical energy using systems called fuel cells (FC). There exist several families of FCs which are used for different purposes ranging from homogenization of the renewable energy production, electricity and heat generator for domestic purposes, transportation applications and powering portable or mobile electronic devices (Figure I.7), that can be more generally separated in stationary and portable systems. Overall, all FCs operate with the same operation principle: a fuel (a gas or liquid) is injected in a system composed of two electrodes separated by an electrolyte. This fuel is oxidized at the anode (negative electrode), while an oxidant (O2
in most cases) is being reduced at the cathode. In order to have an operating FC, the electrolyte, which also serves as the separator (except for liquid FC) must provide a high ionic conduction (to transport the charge carriers from one electrode to the other) but be an electronic insulator, otherwise the system will be short-circuited. The six families of FC: Proton Exchange Membrane Fuel Cell (PEMFC); Solid Oxide Fuel Cell (SOFC); Molten Carbonate Fuel Cell (MCFC); Direct FC like the Direct Methanol Fuel Cell (DMFC); Alkaline Fuel Cell (AFC); Phosphoric Acid Fuel Cell (PEFC), are operating with different characteristics. The primary ones of each FC family are regrouped in Table I.1.
Table I.1: Primary characteristics of the different FC families [83–85].
Fuel cell
type Fuel Electrolyte
Operating temperature Electric efficiency Power range Application PEMFC Pure H2 Solid polymer (proton conductor) 50 – 100°C 34 – 45% 5 – 250 kW Portable/ Stationary/ Automotive SOFC H2, CO, CH4 Solid ceramic ≈ 1000°C > 50% 2 kW – MW Stationary: Combine Heat and Power (CHP) MCFC H2, CO, CH4 Molten carbonate salt ≈ 650°C > 50% 200 kW – MW Stationary: CHP DMFC CH3OH Solid polymer (proton conductor) 20 – 90°C ≈ 50% mW – 1 kW Portable: electronic systems AFC Pure H2 Alkaline
solutions 60 – 90°C 35 – 55% 1 – 250 kW Stationary/ Portable: marine, space PAFC Pure H2 Phosphoric
acid 160 – 220°C 40%
20 – 200 kW
Stationary: CHP
16
Stationary applications
Stationary applications are those requiring the highest power and can be separated again into three subcategories: electricity and heat generator for domestic or industrial uses; backup power sources; power generation for off-grid sites. Figure I.8 presents the evolution of large scale (P > 200 kW) stationary systems deployed worldwide in the last decade. It appears that this market is largely dominated by high-temperature operating FC (MCFC, SOFC, PAFC) because of their important power density and high electric efficiency. In addition, these technologies are also used at smaller scale for domestic usage. They present the advantage of generating both heat and electricity (CHP) and are thus more practical for water heating in houses, compared to a traditional heater that will not produce any electrical energy. In 2019, 80 MW of SOFC capacity and around 100 MW of PAFC capacity, although with a lower number of systems suggesting that the technology is preferred for larger power, were deployed worldwide [85].
Figure I.8. Cumulative global deployment of large scale stationary fuel cells shown from 2007 onwards, displayed per technology. Reprinted from Ref [86].
Even if only few P > 200 kW PEMFC systems are deployed, this technology is actually well developed in the stationary market, especially for small power applications. It is also widely used for CHP domestic production (i.e. Ene-Farm) and can replace traditional power generator (fueled with fossil fuels) for supplying backup power in case of grid failure. Such systems are used in industries, hospitals or even data centers and are usually in the 1 to 10 kW range [87]. In addition, PEMFCs also cover the last
17 stationary application with the development of off-grid systems (i.e. Axane, Air Liquide’s group, in France) for providing reliable electricity production in remote places (i.e. telecom relays) or developing countries. Overall, the PEMFC is the most developed and deployed FC technology, because of its versatility. Its stationary applications only cover a small portion of the total PEMFC capacity deployed, since the major part is dedicated to transports [85].
Transport application
Indeed, the transport applications are almost completely covered by PEM systems, with few DMFC or SOFC systems under development in 2019, with a total capacity of 900 MW in 2019 [85]. Transportation is one of the main GHG emission source, as explained in section I.1, and is a key market in our society: everyone relies on cars, public transports and shipments. It is therefore a primary focus to convert these applications to non-emitting technology. The PEMFC has played an essential role in that matter, with its emergence on every sector of the transportation spectrum.
Domestic cars
There are three main vehicle constructors which commercialized Fuel Cell Electric Vehicles (FCEVs): Hyundai with the ix35 Fuel Cell and more recent NEXO SUV (2018) models, Toyota with the Mirai model and Honda with the Clarity FC model, and several other under development (Nissan, GM, Ford, Mercedez, etc.) using around 100 kW PEMFC systems. They were first commercialized in the first half of the 2010’s and received continuous development with, for example, the range of the Clarity going up from 380 km upon release to 590 km with the 2016 model. In France, only few FCEV are circulating; however, Symbio (Michelin/Faurecia group) is developing a FC version of the Renault Kangoo, with 150 models delivered in 2016 [88]. The main advantages of FCEV compared to battery EV are the overall mass of the embedded power system and the refill vs reload time. Indeed, as Li-ion batteries progressively reach their maximum theoretical capacity [89], the only way to increase the overall energy density, and thus the range of the vehicle, is to increase the dimensions of the overall system, whereas only the hydrogen tank and/or its refill frequency must be addressed regarding FCEV. In addition, it only takes minutes to refill the hydrogen tank (generally 4-5 kg at 700 bar), where several hours are required to fully reload a car battery. The present deployment of hydrogen stations worldwide tends to facilitate the development of the overall FCEV fleet, mainly present in Asia and California today [85]. In addition, to prove their competitive aspect in comparison to other EV or even thermic vehicles, hydrogen race cars are being developed, like the Forze model or the MissionH24 project (GreenGT, Symbio).
18
Shipment and handling vehicles
A large part of the transport emissions originates from merchandise transportation with cargo ships or heavy goods vehicles (HGV). The requirements for powering freighters solely by hydrogen is beyond the reach of FCs for now, but HGV are under development. Constructor like Nikola or Hyundai should deploy a fleet of several thousands of vehicles in Europe in 2020, with a 400 km range [85]. The main issue regarding hydrogen fueled trucks is the refueling of their tanks, and dedicated stations must thus be deployed: because a larger quantity of hydrogen is embedded, the hydrogen flow rates must be increased 5 to 6 times in order to limit the refueling time to 10 – 15 min and maintain a competitive cost of operation. The low refilling time, low maintenance and high energy density of PEMFC systems (compared to batteries) motivated the development of hydrogen fed forklift for materials handling: in 2013, more than 4000 PEMFC equipped forklifts were operating the USA. In France, HyPulsion and then PlugPower develop such forklift since 2012
Passenger transport
Like other sectors, hydrogen fueled vehicles dedicated to public transports are under development and start to be deployed, like buses or even river shuttle. To prepare for the 2020 Olympics, 100 hydrogen buses were supposed to be in service in Tokyo and more than 1200 in 2023. Overall, FC-powered buses start to emerge in several countries and a significant portion of the total fleet should be fed by hydrogen by the next decade. Similarly, trains follow the same development with the priority in France to convert the remaining TER (Regional Express Trains) operating with diesel engine. Even if freighters are still out of the FC reach, small river shuttles have also been deployed with for example the Hydra, operating from 2000 to 2001 in Bonn (Germany) or the Navibus since 2018 in Nantes (France) powered by Symbio [90].
Marine
In addition to river shuttles, other systems are developed for larger ships. To start the transition towards GHG free ships, Norway should deploy a hybrid (hydrogen/diesel) ferry with a 100 – 300 passenger capacity in 2020, as well as a first cargo with a 200 containers holding capacity fueled with diesel, batteries and hydrogen planned for 2026 using Hyon FCs. Moreover, a pusher barge will be tested in 2021 in Lyon (France) with 460 kg of hydrogen stored to fuel a 2 × 200 kW PEMFC system. The FC application in marine market is extended with Toyota announcing to power fishing ships by 2022 [85]. FC are also being investigated for submarine applications. However, because of the highly pressurized hydrogen being too dangerous for such conditions, fully liquid AFC systems will be preferred. This is true for all applications in a confined environment, like spacecraft.
19
Towards portable and mobile systems
Portable or mobile systems are defined by individual transportation or electronic devices that require smaller a power density (from hundreds of W to few kW) than other applications presented above and will focus more on a large energy density to operates for longer periods before needing refueling. For this reason, the PEMFC is not always the go to technology in this sector and DMFC are often considered. Examples of such applications bikes fueled by hydrogen such as the “αlpha” model commercialized by Pragma Industries in France (Figure I.9) powered by a 150 W PEMFC with a 150 km range and a low refueling time of 2 min (compared to hours for battery assisted bikes of the same power).
Figure I.9. The hydrogen fueled bike “αlpha” commercialized by Pragma Industries. FC can also be used as portable power sources for military applications, such as the JENNY cell from SFC Energy, weighing from 1.7 to 3.3 kg with a corresponding energy density of 600 W.h to 1200 W.h. They operate using 25 W DMFC with fuel cartridges. However, because the focus in this sector is still turned on batteries, the development of small scale FC is more difficult and leading companies such as MyFC are forced to leave the market [85]. The next promising market might be Unmanned Aerial Vehicles (UAVs). Indeed, this market is largely growing for material handling and recreational uses, and drones present similar characteristics to forklift (where FC outperform batteries). Companies like Intelligent Energy commercialize power modules up to 2.4 kW for drones. In 2019 a drone flew for 70 min carrying a 5 kg load [85]. They also showcased in 2016 an embedded PEMFC system for powering laptops (Figure I.10). The interesting aspect of this system is the hydrogen source. Instead of standard pressurized tanks, sodium borohydride is used as the storage and hydrogen is realized to the FC through hydrolysis of the boron-based compound.
20
Figure I.10. Prototype of a fuel cell system for powering portable laptop developed by Intelligent Energy.
This system could be called an indirect borohydride FC, because borohydride is only used as a hydrogen carrier, in contrast to the Direct Borohydride Fuel Cell (DBFC) that will be investigated in detail throughout the whole manuscript. Such system is indeed well suited for portable applications, in particular because of its important energy density. It will be presented in more detail in the following section. It was also demonstrated with a prototype of van powered by PEMFC and sodium borohydride as hydrogen storage developed by Daimler-Chrysler in 2001 [91]
Overall, the fuel cell industry is in large expansion since the last decade and the current trend toward zero emission energy production and transportation will likely contribute to expand it even more over the next years/decades. The PEMFC is the most mature FC technology, because of its versatile characteristics and numerous advantages. However, in some applications, like high power stationary energy production, SOFC, PAFC or MCFC will often be preferred. Other technologies can present themselves more suited for niche applications such as the AFC for confined spaces (under-water or space) and the DMFC or even FC using exotic fuels (notably DBFC) for portable and mobile applications.
I.4 The Direct Borohydride Fuel Cell
Borohydride as a fuel
Boron-based compounds were mentioned above as a possible medium for solid hydrogen storage. However, they can also be considered as fuel in direct liquid FC, if dissolved in anolytes in the appropriate conditions. Several compounds such as
21 ammonia borane (NH3BH3), hydrazine borane (N2H4BH3) or the sodium borohydride
(NaBH4) can be classified as “exotic fuels”. Even if they all present interesting properties,
the focus will now be placed on NaBH4 and especially on its use directly as a fuel and
not as a storage medium. Indeed, borohydride can be used for several applications, in particular in the chemical industry as a reducing agent, and can be electro-oxidized to generate electricity.
I.4.1.1 Production of borohydride
Borohydride in itself is not stable and must be associated to another compounds to form a salt: most commonly sodium borohydride NaBH4. This molecule is not a naturally
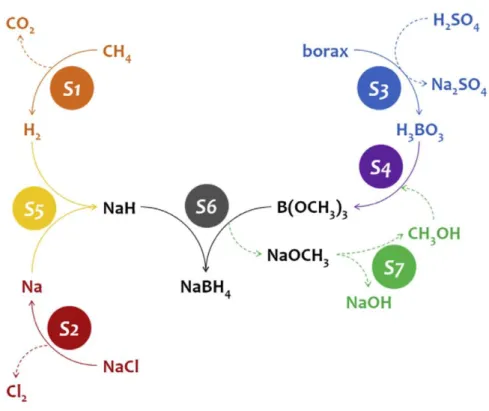
occurring material and was discovered by Schlesinger and Brown in 1940. Because their work was classified, the first study was however published in 1953 [92]. This chemical is now massively produced mainly through two different processes. The first one is the synthesis procedure developed by Schlesinger and Brown, and is still relevant. A schematic representation of the different steps involved is presented on Figure I.11. The figure is reprinted from Ref [93] with the following description of each step:
“There are 7 steps such as: S1 as steam reforming of methane CH4 to produce H2; S2 as
electrolysis of sodium chloride NaCl to produce metallic sodium Na; S3 as refining of borax to make boric acid H3BO3; S4 as reaction of H3BO3with methanol CH3OH to form trimethylborate
B(OCH3)3; S5 as reaction of Na and H2 to make sodium hydride NaH; S6 as reaction of NaH and
B(OCH3)3 towards NaBH4; S7 as recycling sodium methoxide NaOCH3 to CH3OH.”
Figure I.11. Simplified scheme of the synthesis of NaBH4 via the so-called
22
The overall reaction can be described by equation 1.1:
4 NaH + B(OCH3)3 → NaBH4+ 3 NaOCH3 (Brown-Schlesinger process, 1.1) This process presents the advantage of operating at atmospheric pressure and relatively low temperature (T = 250 – 270°C) Even though the reaction requires trimethylborates as precursor, it is directly obtained from borax (Na2B4O7), a naturally occurring mineral.
However, the other precursor, sodium hydride, requires the production of metallic sodium, a process highly inefficient with an electrical efficiency estimated around 50% [94]. The second main industrial process to produce borohydride was developed by Bayer and consists of a one-pot synthesis where borax, metallic sodium, hydrogen and silica are combined at high temperature (400 – 500°C) following equation 1.2:
Na2B4O7+ 16 Na + 8 H2+ 7 SiO2 → 4 NaBH4+ 7 Na2SiO3 (Bayer process, 1.2) This one-pot method simplifies the overall production process. However, metallic sodium is still required, inducing the same inefficiency as the previous process. Moreover, the higher temperature required also reduces the overall energetic efficiency. With the increasing interest of sodium borohydride for hydrogen storage, the scientific community restarted to develop new synthesis procedures since 2000, accompanied with related patents [95]. One of the promising methods is to produce NaBH4 from
sodium metaborate (NaBO2), via electro-synthesis [96] or using reducing agents [97,98],
which would create a circular and sustainable production route since this precursor is the final product of the oxidation of borohydride (as detailed in the next sections).
Overall, these new synthesis procedures still require much work and development to become competitive to the two main industrial ones. They are both based on the restructuration of borax, which can raise the question about the sustainability of using borohydride. Borax is found in evaporate deposits produced during the evaporation of seasonal lake and salted lakes. The main deposits are localized in Turkey and California, but borax is also found all around the world, and even if the production increases every year the world reserve is still largely abundant [99].
I.4.1.2 Properties of borohydride
Sodium borohydride is a white odorless and non-toxic powder with a high melting point of T = 505°C, it will however start to decompose at T = 400°C. It presents the advantage of having the second highest gravimetric hydrogen density in the hydride family (behind LiBH4), due to the low mass of the boron atom [95]. This induces an important
energy density notably because of the presence of 4 hydrogen atoms per molecule. Besides the hydrogen storage application, which is rather recent [100,101], its main usage is as a reducing agent in organic reactions [102–104], and in industry for the
23 manufacture of pharmaceuticals, synthesis of other fine chemicals, or more recently, in synthesis of nano-scaled objects by reducing metallic salts to from nanoparticles supported on carbon [105–107], even though this property was already reported in 1956 by Brown et al. [108]. Such materials are the typical electrocatalysts used as active layers in a FC system. For all these applications, the borohydride is used in its ionic form (BH
4-) and therefore must be dissolved. NaBH4 is highly soluble in water (solubility limit: 550
g per 100 g of H2O [109]), however, the BH4- ion is unstable in water and will decompose
into a stable borate species and release its contained hydrogen atoms following the hydrolysis reaction described by equation 1.3.
BH4−+ 2 H2O → BO2−+ 4 H2 (equation 1.3)
This reaction, producing gaseous hydrogen, is the main process occurring when borohydride is used as a hydrogen storage medium and its rate must thus be enhanced using metallic catalysts in order to reach significant H2 generation [101,110]. One of the
beneficial aspect of this hydrolysis reaction is that 50% of the produced hydrogen originates from water. However, for utilization as a fuel in a DBFC, borohydride must maintain the highest chemical stability possible once fed into a FC, in order to be oxidized through the Borohydride Oxidation Reaction (BOR) (equation 1.4).
BH4−+ 8 OH− → BO 2
−+ 6 H
2O + 8 e− 𝐸BH4−/BO2−
𝑜 = −1.24 V 𝑣𝑠 SHE (equation 1.4)
This stability was determined to be dependent on both the pH of the solution and its temperature [111,112], and a strongly alkaline electrolyte will significantly slow down the rate of the hydrolysis reaction. The half-life of BH4- is estimated at 6.1 min, 10.2 h,
42.6 days and 426.2 days at respective pH of 9, 11, 13 and 14 [113]. It is commonly accepted that borohydride is stable for pH > 12 [114] and in general the OH
-concentration used in anolytes utilized for the BOR ranges from 0.1 M to 4 M, depending on the application (i.e. from laboratory to FC scale).
This anodic reaction (equation 1.4) is the core of a DBFC and what differentiates this FC from standard PEMFCs (or AFCs in this case because of the alkalinity of the electrolyte). It was first reported in 1962 by Indig and Snyder [115] that borohydride could be used as a fuel by electro-oxidizing it using metallic anodes (in their case Ni). Interestingly, they already reported that the oxidation of borohydride is accompanied by a strong hydrogen generation and that “The gassing rate increased with the electrochemical oxidation, and at a rate of 775 mA.cm-2 much hydrogen was evolved. This indicated that
hydrogen was formed as a product of the electrochemical oxidation.” Olu later assigned this generation mainly to hydrolysis [113] but it will be demonstrated in detail later in this manuscript (Chapter 4 and 5) that the first intuition of Indig and Snyder was in fact correct and H2 is a reaction product on a Ni electrode.
24
The BOR presents several interesting properties, such as its really low theoretical standard potential of 𝐸BH4−/BO2−
𝑜 = -1.24 V vs NHE at pH = 14 (or -0.41 V vs RHE) and 8
electrons produced per BH4- species fully oxidized (compared to 2 per H2 oxidized for
the Hydrogen Oxidation Reaction, HOR). However, this high number of electrons also induces a much more complex reaction, with a lot of elementary steps and intermediate species. Numerous studies have been performed to understand the mechanism of this reaction, and its current understanding by our group will be detailed later in Chapter III. The low theoretical standard potential is a promising property towards FC application, since it could provide a 400 mV increase of voltage per cell compared to standard H2 based technologies. However, because the anolyte is aqueous, it means that
for potentials below 0 V vs RHE, the evolution of hydrogen, a reduction reaction, will be thermodynamically favored and will result in the emergence of a mixed potential affecting the real onset of the oxidation reaction. Again, this issue will be discussed in detail in the following Chapters.
Operation principles of a DBFC
As mentioned above, the BOR is the main difference between an AFCs operating on H2
and a DBFC, as it replaces the HOR as the anodic reaction. To close the circuit and generate power, the Oxygen Reduction Reaction (ORR in alkaline medium, equation 1.5) is most often considered (it is the most common cathodic reaction in conventional FCs). However, because the anode is already fueled with a liquid anolyte, it is also possible to use liquid catholyte with the Hydrogen Peroxide Reduction Reaction (HPRR, equation 1.6):
O2+2 H2O+4 e− → 4 OH− (E0 = 0.40 V vs. SHE, pH = 14) (equation 1.5)
H2O2+2 H++2 e− → 2 H2O (E0= 1.76 V vs. SHE, pH = 0) (equation 1.6)
That way, a fully liquid-fed FC system is obtained, which is of great interest for applications in confined spaces such as submarines, and has been investigated for several years [116–118] because of theoretical better performance than the O2 DBFC.
Indeed, by using the HPRR a theoretical Open Circuit Voltage (OCV) of 3.01 V could be reached for a single cell compared to 1.64 V for the O2 DBFC. This value is very
impressive for a system operating in aqueous medium. However, because H2O2 is only
stable in highly acid medium, a huge pH gradient exists between the two electrodes (pH = pHanode – pHcathode ≈ 14). If this gradient is stably maintained during operation of
the cell (this requires specific conditions detailed later in the paragraph dedicated to the use of different membranes), a junction voltage appears (830 mV) from water protolysis, to provide both H+ and OH- ions, and results in a decrease of the theoretical OCV down
25 to 2.18 V. The overall reaction for O2 DBFC and H2O2 DBFC systems are detailed by
equation 1.7 and 1.8 respectively:
BH4−+ 2 O2 → BO2−+ 2 H2O (𝑈cellth = 1.64 V) (equation 1.7)
BH4−+ 4 H
2O2 → BO2−+ 6 H2O (𝑈cellth = 2.18 V) (equation 1.8)
The structure of both DBFC unit cells is however the same and is schematically described by Figure I.12. The composition of the cell is actually similar to a standard PEMFC or other FC technologies and can be separated in three main layers:
Figure I.12. Structural composition of a BH4-/O2 DBFC unit cell. Reprinted from Ref
[119].
An anode that is the main seat of the anodic reaction, in this case the BOR (equation 1.4). It can itself be separated into two sub layers: the diffusion layer that serves to bring the active species to the active layer, where they are catalyzed by the electrocatalysts materials (detailed in “Anode materials” section). The produced electrons are then conducted to the current collector through the diffusion layer: it must thus be electrically conductive and present a large porosity to limit mass-transport related issues in the cell. Most commonly commercial carbon papers are used to fulfil this role.
26
A cathode that is structured similarly as the previous electrode, with a diffusion layer (carbon paper) and an active layer with electrocatalysts, specifically designed for the cathodic reaction (see the “Cathode materials” section for more details).
A membrane is used as a separator between the two electrodes and electrolytes to hinder short-circuits. However, to close the electrical circuit, it is necessary for this membrane to conduct ionic charge carriers from one electrode to the other. In a DBFC system, both Cation Exchange Membranes (CEMs) or Anion Exchange Membrane (AEMs) can be used, resulting in the conduction of Na+ or OH- carrier, respectively.
The benefits and drawbacks of each membrane will be discussed further in the next sections and in Chapter V. Because of the liquid nature of the anolyte, no additional ionomer is required at the active layer for the ion conduction to the membrane. Nevertheless, such polymer is still used in commercial and standard anode design to bind the electrocatalyst nanoparticles to the carbon support. (This statement applies to the cathode if fed by liquid catholyte).
The different variables involved in the DBFC operation were reviewed by Olu et al. [120] in 2016. The geometric surface area of the anode was presented as highly affecting the overall DBFC performance with smaller electrodes displaying higher power densities in similar conditions [121,122]. It is then reported that the anolyte flow rate might contribute to largely improve the performance of the cell [123,124] or have little influence [122,125,126]. These different observations all suggest that the reactant transport conditions must be carefully studied for a given DBFC configuration in order to maximize its resulting power density, as recently confirmed by Prof. Ramani’s group [127,128]. The morphology of the anodic active layer was also demonstrated by Olu et al. [129] to be a major variable to reach high power. This will be discussed in detail in Chapter V of this manuscript.
In 2014, the advantages and drawbacks of the DBFC were listed by Sharaf et al. [130], compared to other FC technologies: they are reported in Table I.2. At first sight, this list of drawbacks appears detrimental towards the development of DBFC for real applications compared to the advantages presented. However, its high OCV is not mentioned as well as its good theoretical specific energy which is 50% higher than the one of a DMFC, a commercialized system (9 kWh.kg-1 and 6 kWh.kg-1 respectively). In
addition, several of the hindrances listed are not so true to this day: promising power densities over P = 800 mW.cm-2 were reached recently with a H2O2 DBFC unit cell [128];
the BOR mechanism has been thoroughly investigated by Olu on Pt and Pd electrodes [113,129,131] and with the additions of this manuscript, a satisfying model of the reaction is obtained; to cover the cost of the catalysts, a global effort is made to move towards non-Platinum Group Metal (PGM) electrodes (see section III.4). Similarly, the stability of membranes, especially AEM has largely been improved in the last years (see
27 the “Different membrane configurations” section). The inefficiency of the cathodic reaction is enhanced by the fuel crossover and will be discussed in the section dedicated to the membranes however, this issue is present in all FC systems relying on ORR. Major progress has been made that will profit the DBFC. However, its commercialization is still hindered by the remaining issues: (i) the high cost, mainly due to the borohydride production and the use of PGM-based electrodes and (ii) the hydrogen released during operation, directly translated in an efficiency loss because electrons stored in BH4-are
not fully valorized but partly lost in the form of molecular hydrogen.
Table I.2. Specific advantaged and drawbacks of a DBFC system compared to other
FC technologies. Adapted from Ref [130].
Specific advantages Specific drawbacks
Compact size Fuel crossover
High fuel gravimetric hydrogen density High cost
No CO2 produced Low power density
Low-toxicity and environmentally-friendly operation
Lack of analytical modelling due to unknown BOR mechanism
Expensive catalyst
Chemical instability of membrane and catalysts
Inefficient Cathodic reduction reaction Inefficient anodic oxidation reaction due
to significant hydrogen evolution
I.4.2.1 Anode materials
The electrocatalyst materials used in DBFC anodes were reviewed by Olu et al. [120]. What arises from this study is that noble metals are the most widely used and most active electrocatalysts towards the BOR. Non-noble electrocatalysts have been investigated with an increasing attention over the years, but with overall low performance. A more detailed description of these materials will be presented in section III.4. A brief list of the most commonly used noble metals and their respective advantages and drawbacks toward the BOR is presented below:
Platinum
Platinum is considered as the best and most commonly used electrocatalyst for the BOR, so far. The mechanism of the reaction as it was understood at the start of this PhD will be detailed for Pt and Au surfaces in the section “III.1. Current understanding of the BOR on Pt electrodes”. This noble metal is also the most active for the hydrogen reactions in alkaline medium [132–134], resulting in a good valorization of the
28
hydrogen formed during the BOR and thus 8 electrons produced at relatively low potentials. Such activity has also a downside since the Hydrogen Evolution Reaction (HER) will quickly become predominant at potentials below E = 0 V vs RHE, resulting in a BOR onset potential close to E = 0 V vs RHE. The 400 mV negative shift theoretically forecast by the standard potential of the BH4-/BO2- couple is thus not obtained in
practice. Moreover, Pt is also a good catalyst for the heterogeneous hydrolysis of borohydride, which is detrimental for long-term operation in DBFC configuration [135,136]. Furthermore, a detrimental self-poisoning effect was reported by Finkelstein et al. [137]. It is still (one of) the best electrocatalysts for the BOR but the presented issues indicate that the full potential of the borohydride as a fuel cannot be exploited with a Pt-based anode. In addition, the high cost and low availability of Pt motivate the search of other BOR electrocatalysts.
Gold
Gold is historically the second most investigated BOR catalysts. It was actually the main constituent (97% Au, 3% Pt) in the first DBFC anode reported in the literature, by Amendola et al. [138]. It was presented as an efficient electrocatalyst towards this reaction [125,139–141] because of its low BH4- heterogeneous hydrolysis activity
(compared to Pt [135]). However, this metal is not an efficient electrocatalyst towards this anodic reaction, as reported by Chatenet et al. in 2010 [142], mainly because of too high activation potentials translating in a high onset potential (Eonset = 0.3 V vs RHE)
[143]. It is now mostly studied for fundamental purposes, in particular to understand the BOR mechanism [143,144]. However, it is still common to observe new studies emerging using Au-based anodes with poor to average activity [145–147].
Palladium
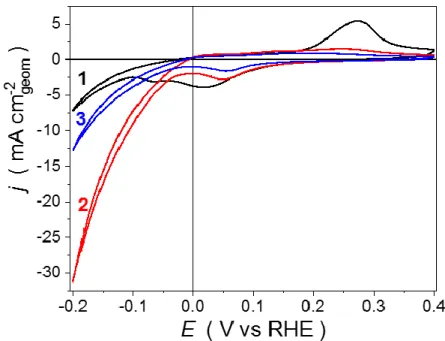
Palladium is nowadays as much investigated as Pt as an electrocatalyst for the BOR because of their similar activity in DBFC configuration [129,148,149]. Actually, the highest DBFC power densities reported were obtained using Pd-based anodes instead of Pt in both O2 [150] and H2O2 configurations [128,151]. The reasons behind this good
activity are yet not understood, since the behavior of the BOR on Pd surfaces appears largely different from the one occurring on Pt in a half-cell configuration [129,152]. BOR on Pd displays low onset potential (-0.2 V vs RHE) with a number of electron exchanged varying from 4 to 8 [152,153]. Indeed, the reaction starts with a first partial reaction wave (hence the 4 e-). However, few mechanistic studies published so far do not provide


![Figure I.12. Structural composition of a BH 4 - /O 2 DBFC unit cell. Reprinted from Ref [119]](https://thumb-eu.123doks.com/thumbv2/123doknet/14560850.726396/38.892.174.745.356.802/figure-structural-composition-dbfc-unit-cell-reprinted-ref.webp)