HAL Id: tel-03218628
https://tel.archives-ouvertes.fr/tel-03218628
Submitted on 5 May 2021HAL is a multi-disciplinary open access archive for the deposit and dissemination of sci-entific research documents, whether they are pub-lished or not. The documents may come from teaching and research institutions in France or
L’archive ouverte pluridisciplinaire HAL, est destinée au dépôt et à la diffusion de documents scientifiques de niveau recherche, publiés ou non, émanant des établissements d’enseignement et de recherche français ou étrangers, des laboratoires
Detection of atypical events for security in critical
infrastructure
van Khoa Le
To cite this version:
van Khoa Le. Detection of atypical events for security in critical infrastructure. Signal and Image Processing. Université de Technologie de Troyes, 2018. English. �NNT : 2018TROY0033�. �tel-03218628�
THESE
pour l’obtention du grade deD
OCTEUR
de l’U
NIVERSITE
DE
T
ECHNOLOGIE DE
T
ROYES
Spécialité : OPTIMISATION ET SÛRETÉ DES SYSTÈMES
présentée et soutenue par
Van Khoa LE
le 17 octobre 2018
Detection of Atypical Events
for Security in Critical Infrastructure
JURY
M. I. NIKIFOROV PROFESSEUR DES UNIVERSITES Président
M. P. BEAUSEROY PROFESSEUR DES UNIVERSITES Directeur de thèse M. D. TOMASSI PROFESOR ADJUNTO Examinateur M. V. VRABIE MAITRE DE CONFERENCES - HDR Rapporteur Mme S. LELANDAIS-BONADE PROFESSEURE DES UNIVERSITES Rapporteur Mme E. GRALL-MAËS MAITRE DE CONFERENCES - HDR Directeur de thèse
Acknowledgement
I sincerely like to thank my honorable Ph.D. advisor, Professor Pierre BEAUSEROY for giving me the opportunity to work with him. I must have to express that he is an amazing Ph.D. supervisor and I am extremely fortunate to be one of his Ph.D. students. My words are powerless to express my gratitude to him. His patient guidance, encouragement, carefulness, advice, and prompt replies to questions and queries have played the important key role in this thesis. He has always provided very concrete ideas and comments throughout my Ph.D. research. I am extremely grateful to him for his enormous support during my Ph.D. study.
I would also like to express my sincere appreciation and my sincere gratitude to my Ph.D. co-advisors Edith GRALL-MAES for guiding me during my Ph.D. research. I am very grateful for her valuable contributions to the publications. Her reviews and comments on the articles were very constructive. I have to say that without her help this thesis would not be a reality.
I would like to thank all my friends and colleagues at the Troyes University of Technology. They were always ready to help me whenever I was in need. They were very talented as well as very friendly, and I had a great time in the group. Thanks also to administrative staff Denise PASCALE and the secretaries of the LM2S laboratory for their valuable supports regarding administrative issues. I also do not want to miss the opportunity to thank my colleagues Ngoc-Tan NGUYEN and Nhan-Quy NGUYEN for whom I spent a big part of my department life as well as social life during my Ph.D.
I express my gratitude to my amazing family, especially my parents, who encouraged me throughout my studies. Everything I have today is because of you. You always be there for me, provide help. Despite the distance, I feel like you are always by my side. Finally, I would like to give special thanks to my girlfriend, Thi-Kim-Ngan LE. Her love, patience, encouragement, supports, and understanding helped me to work better.
Contents
1 Introduction 15 1.1 Critical infrastructure . . . 15 1.2 Problematic . . . 17 1.3 VIRTUALIS project . . . 18 1.3.1 Overview . . . 18 1.3.2 Demonstration scenario . . . 19 1.4 Thesis contribution . . . 201.5 Organization of the document . . . 20
2 Project and dataset 23 2.1 Introduction . . . 23
2.2 VIRTUALIS project . . . 23
2.2.1 Virtualis consortium . . . 24
2.2.2 Analysis of global risk - SP3 . . . 27
2.2.3 Context . . . 28
2.2.4 Sensor system . . . 30
2.2.5 Raw data processing . . . 32
2.2.6 Simulated dataset . . . 35 2.2.7 Real dataset . . . 37 2.2.8 Attacking scenarios . . . 39 2.3 ATC case . . . 41 2.3.1 Context . . . 41 2.3.2 Sensor system . . . 42 2.3.3 Real dataset . . . 44 2.4 Conclusion . . . 45
Contents
3 Anomaly detection for trajectory data 47
3.1 Introduction . . . 47
3.2 Anomaly detection method . . . 48
3.2.1 Density-based method . . . 51
3.2.2 Boundary-based method . . . 54
3.2.3 Dissimilarity measure . . . 58
3.2.4 Kernel method . . . 62
3.3 Issue related to trajectory data . . . 69
3.3.1 Trajectory . . . 70
3.3.2 Identifying anomalous events using trajectories . . . 71
3.3.3 Detecting outlier trajectories . . . 72
3.4 Conclusion . . . 73
4 Abnormal events detection using key metrics 75 4.1 Introduction . . . 75
4.2 Methodology . . . 75
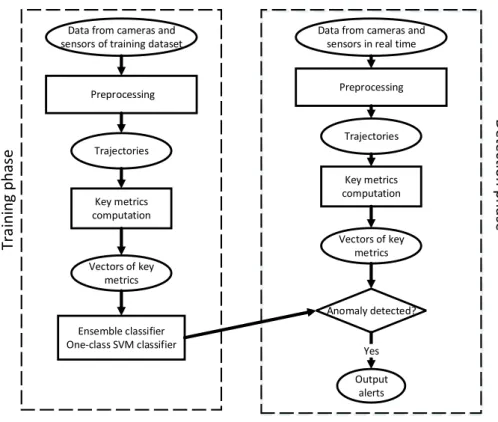
4.2.1 Training and detection stage . . . 76
4.2.2 General description . . . 78
4.3 VIRTUALIS - office environment . . . 83
4.3.1 Description . . . 83
4.3.2 Zone partition . . . 84
4.3.3 Key metrics . . . 84
4.3.4 Experimental results . . . 85
4.4 ATC - shopping center environment . . . 93
4.4.1 Description . . . 93
4.4.2 Zone partition . . . 94
4.4.3 Key metrics . . . 94
4.4.4 Experimental results . . . 95
4.5 Conclusion . . . 99
5 Abnormal trajectories detection using One-class SVM model 101 5.1 Introduction . . . 101
Contents
5.2 Methodology . . . 102
5.3 VIRTUALIS . . . 104
5.3.1 Description . . . 104
5.3.2 Sequence construction . . . 104
5.3.3 Custom dissimilarity measure and kernel method . . . 108
5.3.4 Experimental results . . . 111
5.4 ATC . . . 115
5.4.1 Description . . . 115
5.4.2 Sequence construction . . . 116
5.4.3 Custom dissimilarity measure and kernel method . . . 118
5.4.4 Experimental results . . . 120
5.5 Conclusion . . . 125
6 Conclusion and Perspectives 127 6.1 Conclusion . . . 127
6.2 Perspective . . . 129
7 La détection des événements atypiques pour la sécurité infrastructures critiques 131 7.1 Introduction générales . . . 131
7.2 Les projets et les données . . . 135
7.2.1 Le projet VIRTUALIS . . . 136
7.2.2 Le cas ATC . . . 141
7.3 La détection des anomalies pour les trajectoires . . . 143
7.3.1 L’enquête . . . 143
7.3.2 La méthode . . . 144
7.3.3 L’issue avec les trajectoires . . . 146
7.4 La détection des événements atypiques . . . 147
7.4.1 L’introduction . . . 147
7.4.2 La méthodologie . . . 148
7.4.3 Le cas d’usage VIRTUALIS . . . 152
Contents
7.5 La détection des trajectoires atypiques . . . 156
7.5.1 L’introduction . . . 156
7.5.2 La méthodologie . . . 157
7.5.3 Le cas d’usage VIRTUALIS . . . 158
7.5.4 Le cas d’usage ATC . . . 161
7.6 La conclusion et la perspectives . . . 164
7.6.1 La conclusion . . . 164
List of Figures
1-1 Critical infrastructure . . . 16
2-1 Plan of project VIRTUALIS . . . 26
2-2 Thales TRT site in Palaiseau, an example of office building. . . 29
2-3 Diagram of Thales TRT site installations . . . 30
2-4 System of sensors on Thales site . . . 31
2-5 Camera’s FOV in ThereSIS laboratory. . . 32
2-6 Simulation of Thales site. . . 36
2-7 Sensor setup plan in the ATC shopping mall center. . . 42
3-1 Methodology of detection anomaly . . . 48
3-2 Clustering based methods . . . 51
3-3 Standard normal distribution . . . 53
3-4 Support Vector Machine . . . 56
3-5 One class SVM in feature space. . . 57
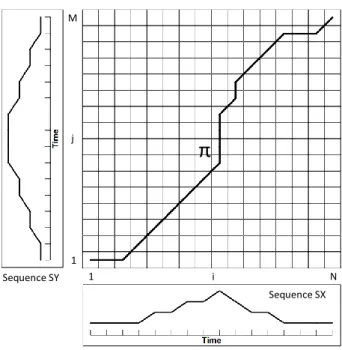
3-6 Dynamic time warping alignment. . . 61
4-1 Training and detection stages of the AED method. . . 77
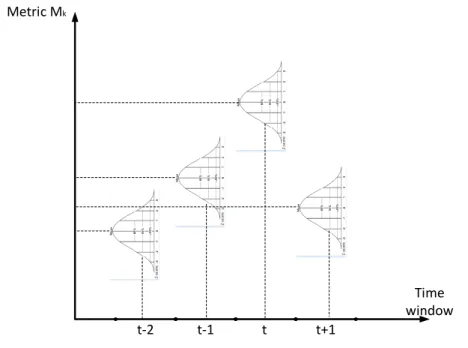
4-2 Normal distribution of key metrics 𝑀𝑘 at each time window. . . 81
4-3 Modelization of the Thales site. . . 84
4-4 Training results at the Server room. . . 86
4-5 Training results at printer 1. . . 86
4-6 Training results at printer 2. . . 87
4-7 Detection results in server room for the first attacking day. . . 88
List of Figures
4-9 ROC curve of the one-class SVM’s performance on the simulated dataset. . 90
4-10 Training result of the ensemble classifier on the real dataset. . . 91
4-11 Detection result of the ensemble classifier on the real dataset. . . 92
4-12 ROC curve of one-class SVM classifier on the real dataset. . . 92
4-13 Mean of key metrics on Wednesday (blue) and Sunday(red) at the corridor. 95 4-14 Mean of key metrics on Wednesday (blue) and Sunday(red) at the square. . 96
4-15 The training and detection result of the ensemble classifier on the ATC dataset. 97 4-16 ROC curve of the one-class SVM classifier using vector of key metrics. . . . 98
5-1 Methodology of the ATD technique. . . 103
5-2 Graph representation of Thales building . . . 105
5-3 Distance function. . . 109
5-5 Zone division using K-means clustering. . . 116
5-6 Trajectory (red) and sequence of activity (sequence of green sub-areas). . . 117
7-1 La détection dans la salle serveur. . . 153
7-2 Le courbe ROC de la détection dans la salle serveur. . . 153
7-3 Les métrique clés en Mercredi (bleu) et Dimanche(roux). . . 155
7-4 La détection de l’ensemble classificateur pour le cas d’usage ATC. . . 156
7-5 La division des zones dans le bâtiment de Thalès. . . 159
7-6 La division par K-means clustering. . . 161
List of Tables
2.1 Raw trajectory of the simulated dataset. . . 36
2.2 Simulated data: card readers record. . . 37
2.3 Raw trajectory of ATC dataset. . . 45
4.1 Example of vector of key metrics at time window 𝑡. . . . 79
5.1 Example of an activity . . . 106
5.2 Example of a sequence of activities . . . 107
5.3 Performance of different kernels of the One-class SVM classifier. . . 113
5.4 Attacking sequences at the printer. . . 113
5.5 Attacking sequence in the server room. . . 114
5.6 False negative. . . 114
5.7 False alarm. . . 114
5.8 Example of a sequence of activities in ATC dataset. . . 117
5.9 Optimal cost of kernel alignment for different kernels. . . 121
5.10 Performance of different kernels of the SVM classifier. . . 122
7.1 Le donnée simulé brut. . . 138
7.2 Les trajectoires brut de donnée ATC. . . 142
7.3 L’enquête des méthodes pour la détection des anomalies. . . 144
7.4 Performance of different kernels of seul classe SVM classifier. . . 160
Abreviations
AED Abnormal Event Detection using key metrics. AP Activity Path.
ATD Abnormal Trajectory Detection.
DBSCAN Density-based spatial clustering of applications with noise. DTA Dynamic Time Alignment.
DTW Dynamic Time Warping. ED Euclidean Distance.
FOV Field Of View. FPR False Positive Rate. GA Global Alignment.
GDTW Global Dynamic Time Warping. k-Means k-Means clustering.
KA Kernel Alignment. LOO Leave One Out.
one-class SVM One-class Support Vector Machine. POI Point of Interest.
RBF Radial Basis Function.
ROC Receiver Operation Characteristic. SVM Support Vector Machine.
Abbréviations en Français
CdV Champ de vision.
DEA La détection des événements atypiques en utilisant la métrique clé. DTA La détection des trajectoires atypiques.
DTW Dynamic Time Warping.
Dynamic Time Alignment Dynamic Time Alignment. GA Global Alignment.
GDTW Global Dynamic Time Warping.
seul-classe SVM Seul-classe Machine à vecteurs de support. SVM Machine à vecteurs de support.
Chapter 1
Introduction
This thesis aims to develop approaches for anomaly detection in systems of critical infrastructures. It was carried out in the context of the VIRTUALIS project as part of the FUI15 program. VIRTUALIS gathered ten partners among which the System Modeling and Dependability team (M2S) of ICD laboratory. The objective of this project was to develop an automatic security system for critical infrastructure. Our primary contribution to the project was to propose detection methods for security applications, using data from cameras and sensors. The VIRTUALIS project lasted for three years and started in July 2014, about a year before the beginning of the thesis. The work was mainly done on the base of the project. However, due to a lack of data from the VIRTUALIS project, public data of a project named ATC were also used.
This introduction begins with a brief description of critical infrastructure followed by a description of the current security issues and the motivation of VIRTUALIS. A brief introduction of the ATC project is also mentioned. It ends with a short presentation of our main contribution to the VIRTUALIS project and the outline of the manuscript.
1.1
Critical infrastructure
Critical infrastructures are defined as a network of independent, mostly private sys-tems and processes that function collaboratively and systematically to produce and
dis-1.1. Critical infrastructure
tribute a continuous flow of essential goods and services [48]. The definition of essential infrastructure is similar throughout the world.
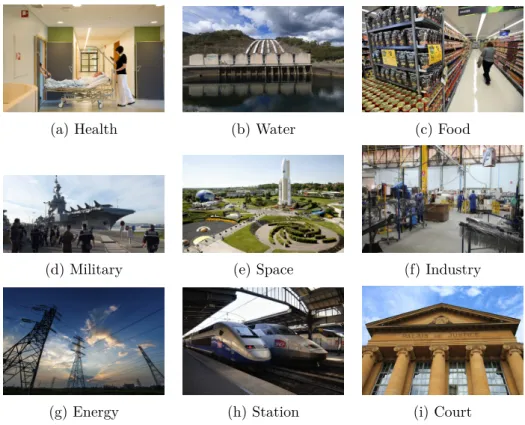
Critical infrastructures are complex systems [30], and each component of infrastruc-ture constitutes a small part of the intricate web that forms the overall infrastrucinfrastruc-ture. The state of one infrastructure is correlated to the state of the other which create an interde-pendency network between infrastructures in an extensive system. Critical infrastructure covers public buildings such as airports, train and metro stations, administrations, tertiary buildings (banks, offices) and industrial sites (refineries, nuclear power plants, water purifi-cation plants). Nation’s critical infrastructures provide the essential services that underpin the society and serve as the backbone of the nation’s economy, security, and health. These infrastructures provide people the power which is used in homes, the water to drink, the transportation, the stores to shop, and the communication systems. Some examples of critical infrastructures are presented in Figure 1-1.
(a) Health (b) Water (c) Food
(d) Military (e) Space (f) Industry
(g) Energy (h) Station (i) Court
Chapter 1. Introduction
1.2
Problematic
The risk analysis of the critical infrastructures has drawn much attention from gov-ernments due to its vital importance. Both physical and cyber security are equally crucial for risk management of any contemporary critical infrastructure. Physical security aims to protect property and people by ensuring that only authorized persons and materials are allowed to enter various parts of the premises, using video-monitored, physical barrier equipment, access control, etc. All these devices send their data to a monitoring center, where security operators are managing risk at a macroscopic level using a set of procedures. Physical security, although extremely important, is a relatively mature field in which the threats and preventive measures are well understood [96]. Cybersecurity aims to protect the infrastructure information system from intrusions and leaks, using the notion of role management: access to data is authorized according to entitlements related to people by roles. Cybersecurity, however, is relatively new and represents a particular challenge to interdependent infrastructures.
Since 2015, there were 26 attacks in France, which cause more than 200 deaths and 800 injuries. The attacks that caused the most damage are the shooting in the Charlie Hebdo magazine’s office in Paris on 7-9 January 2015, the massive shooting on November 13, 2015 at Bataclan during the Eagles of Death Metal concert, and the vehicle ramming on 14 July 2016 in Nice. Those numbers show that France is a target for terrorists and that security threats are real. Beside terrorist activities, data of citizen are also a target of spying activities, a specific example is the Edward Snowden scandal in 2013, where US National Security Agency (NSA) was accused of collecting telephone records by touching the server of big companies like Facebook or Google [114].
Due to the current critical situation of politics and terrorism, the French President, François Hollande, declared the State of Emergency until July 2017 to help keep residents and visitors to France safe. This decision involves more security checks and greater police power and presence. Despite the enhancement of police’s force and security protocol, the ability to detect and prevent attacks of police and special forces is still limited. The difficulty comes from different reasons such as the number of threats (hostile troops, terrorist) or the various number of vulnerabilities of critical infrastructure. More than one countermeasure
1.3. VIRTUALIS project
may exist for a particular infrastructure, or one countermeasure may reduce the risk for many infrastructures. The bottleneck of new security policies are the overwhelming task of human (i.e., operator’s longtime working), result in the unreliability of the security system. So an automatic surveillance system is a particular countermeasure that can be applied to many critical infrastructures to reduce security risk. Therefore, the development of such systems is important in the current situation.
The French government has invested in many projects to create a global road-map for the automatic security systems ([15], [40]). The target of these investments is to create different technological bricks developed for the security of infrastructures. The project VIRTUALIS is one of the key bricks.
1.3
VIRTUALIS project
1.3.1 Overview
The VIRTUALIS project is part of a global approach aiming to propose a system of primary management of the physical and logical security of critical infrastructures. The key issues of VIRTUALIS are to make it possible to optimize and to facilitate the risk management for the security system’s installation and operation [32].
The objective of VIRTUALIS project is to create an automatic security system for critical infrastructures such as commercial buildings, metro station. This system can mon-itor the activities of every people on the site, based on information gathered by a large number of sensors, among which are cameras [31], then analyzes the data and gives an alert to prevent the attack before it happens. Such system can assist operators to detect abnormal events more efficiently, therefore increase the effectiveness of a security system.
VIRTUALIS brought together three major industrial groups, an EPIC, two academic laboratories, an association and three SMEs located mainly in Ile de France but also ac-tive in Europe. This consortium was made up of known partners in the world of critical infrastructure security. It grouped the various skills needed to carry out the project based on their complementary.
Chapter 1. Introduction
The project was divided into multiple sub-projects, grouped in packages concerned with administration, law, technical tasks. A particular consortium handled each sub-project. The research work presented in the manuscript is related to sub-project 3 - Analysis of global risk (SP3). It is an intermediate step, which contains multiple detection models developed by the SP3 consortium members. Each model uses preprocessed data from multiple types of sensors, prepared by previous sub-projects as the input, and outputs the detected anomalies. An anomaly could be an abnormal event or unusual behavior.
1.3.2 Demonstration scenario
By default, two types of infrastructures, a metro exchange station, and a working office building were chosen as the scenarios for the VIRTUALIS project. Thales site hosts the working office scenario and the Chatelet metro station in Paris hosts the metro station scenario. Due to the plan, systems of sensors were supposed to be set up at Thales site and Chatelet metro station which correspond to two scenarios to collect data in these environments. Then each member trained their detection models on the same dataset and these models would be integrated into an automatic system of security. The result of the project would be displayed at a demonstration technique. Unfortunately, the data acquisition process of the metro station ran into some administrative issues, which led to an abandon of the metro station scenario. As a result, in the final demonstration of the VIRTUALIS project, the proposed system performed in the scenario of the Thales site.
So as mentioned before, the VIRTUALIS project was finished one year before the thesis. So after the VIRTUALIS project, we still have time to experiment our methods in a second case. We looked for a rich, robust dataset which can replace the metro station case. We finally retained the public dataset from the ATC project and use it as a second experimental case.
The ATC project [19] was conducted in Japan, a sensor system was installed in the ATC shopping center in Osaka Bay. The detail information of the ATC project will be presented in section 2.3.
1.4. Thesis contribution
1.4
Thesis contribution
The main contribution of this work consists of two methods for anomaly detection us-ing trajectory data. The two proposed methods are different and somehow complementary. They can be applied together in a security system. These methods are called Abnormal Event Detection using key metrics (AED) and Abnormal Trajectory Detection (ATD). The methods were applied to the VIRTUALIS case (office building) and the ATC case (shopping center). Since each case is different, the methods were adapted to the specific characteristics of each environment.
• AED is a parametric method, based on extracted features. This method analyzes multiple sub-trajectories which are observed in a critical area of the building. It con-siders the sub-trajectories as events which happen in the area and extracts key metrics from these events. A training step enables to learn the key metrics distribution and to choose the detection thresholds according to operational demand. The thresholds are applied in the detection stage to classify abnormal situations in the area.
• ATD is a method that detects the abnormal sequences of activities. It processes the data to produce sequences of activities, where each activity is inferred from the gathered data. The detection function is trained based on available data. Depending on the available dataset, the classifier training could be supervised using normal data and attack data, or unsupervised using normal data only. The classifier is then applied to predict the label of new sequences.
These methods has been published as two articles ([69],[70]).
1.5
Organization of the document
The manuscript is organized as follow. In chapter 1, we pointed out the definition and the importance of critical infrastructure for a nation. The risk and limitation of current security system give the motivation for the VIRTUALIS project and this work.
Chapter 1. Introduction
Chapter 2 describes the project behind this work and the data used in this manuscript. The description of the project VIRTUALIS includes the consortium, the sensor system, the development of the dataset in relation to a particular abnormal scenario. In addition to these data, the public dataset of the ATC project will be presented.
To provide a theoretical background for our scientific developments, chapter 3 out-lines the problem formulation, which is the anomaly detection for trajectory data, and categorize the methods used by other researchers to respond to that problem. We review some existing works, identify the key research gap in order to position our contributions.
Chapter 4 presents the first contribution named Abnormal Events Detection using key
metric. Chapter 5 presents the second contribution named Abnormal Trajectory Detection.
In both chapters, the methodology is presented, and the implementation of the two test cases VIRTUALIS and ATC are explained respectively.
The conclusion of this work and the perspective for future development of automatic security systems are presented in chapter 6.
Chapter 2
Project and dataset
2.1
Introduction
This chapter presents the VIRTUALIS project and the application context where we consider to challenge the proposed methods. One of the key points is related to the data, so special attention is put on presenting each dataset. This chapter is organized into two main sections. The first one presents the VIRTUALIS project, its objective, the consortium, the sensor system and the data. In the case of VIRTUALIS, we have two datasets, a simulated one and a real one. Attacking scenarios were prepared by security experts to test the proposed methods. The second section presents the ATC case: the context, the sensor system, and the dataset. Although we did not participate in this project, the sensor system was described very carefully in the papers.
2.2
VIRTUALIS project
With the technology evolution in recent years, the numerical system is more and more important in all applications, organizations and human systems. It implies a specific challenge for security system where physical devices are usually built on one side, and information system security is designed on the other side. There are many reasons to organize the work this way, but it may lead to security leaks, incoherence in processes. So
2.2. VIRTUALIS project
the main idea of VIRTUALIS project is to propose a global approach aiming to manage the physical and logical security of critical infrastructure. Such an approach makes it possible to optimize and facilitate the risk management for the installation and the use of the security system. This system provides alerts, verifies and validates security procedures. The VIRTUALIS project aims primarily to overcome the following technological limitation of existing system [32]:
1. Heterogeneity and mono-functionality of sensors and their interfaces.
The physical security management of infrastructure now relies on several heteroge-neous networks of sensors [11] (e.g., biometric access control or badges, video surveil-lance, perimeter protection, smoke detectors, etc.) in which a sensor typically provides a single function (e.g., smoke detection).
2. Existing real-time risk analysis tools not suitable for combining physical and logical security data.
Many risk analysis tools are now available in various fields [9], for example, the man-agement of the security of information systems (e.g., attack graphs) or in the analysis of industrial risks [122]. However, most of them are not suitable for the project’s goal of conducting a joint risk analysis of the physical security and logical security of the in-frastructure. In fact, risk analysis is not yet thought globally, while threats combining physical and logical security already exist. For example, the computer worm "Stuxnet" discovered in 2010 by a Belarusian company developing antivirus [44]. Stuxnet was used as part of an Advanced Persistent Threat (APT) and aimed at compromising industrial control systems. In particular, Stuxnet has been able to infect physical infrastructures such as SCADA (Supervisory Control and Data Acquisition).
2.2.1 Virtualis consortium
The VIRTUALIS project consortium grouped companies and organizations which bring expertise in different domains. The project leader was Thales, it had gathered part-ners with a rich history of collaborations. As part of its critical infrastructure security activities, Thales regularly meets with partners involved in related projects (CEA, RATP,
Chapter 2. Project and dataset
etc.). The committee in charge of the administrative and technical follow-up of VIRTUALIS consisted of the entire consortium and was chaired by Thales Services SAS. Nevertheless, an Administrative and Technical Steering Committee (CPAT) was set up to monitor specific critical activities and critical decisions. The CPAT was composed of the partners responsible for the primary sub-projects:
• Thales services SAS: Thales is a world leader in critical information systems. It has a global workforce of 68,000 people and a presence in 50 countries. Regarding R&D, Thales invests 2.2 billion euros in total (18% of activity), employing 25,000 researchers in cutting-edge fields that produce more than 300 inventions.
• Sispia SARL: SISPIA is an innovative company created in 2003, with an activ-ity focused on analysis, algorithms and data processing and knowledge for risk and performance management. The major axes of SISPIA cover the interaction between the components, the divergence of the results and the parameters with particular incidence.
• EGIDIUM Technologies: Egidium Technologies provides global safety-security and incident management solutions for sensitive sites and infrastructures. Addressing industrial sites, events, transport infrastructures or urban safety, its solutions manage the data fusion of all security sensors and allow intuitive supervision adapted to the management of incidents and crises.
• Regie Autonome des Transports Parisiens (RATP): The RATP Group is the world’s fifth largest public transport operator with a presence in all modes of collective mobility: metro, rail, tramway, and bus. In Ile-de-France, RATP operates, maintains, modernizes and develops one of the densest multimodal networks in the world.
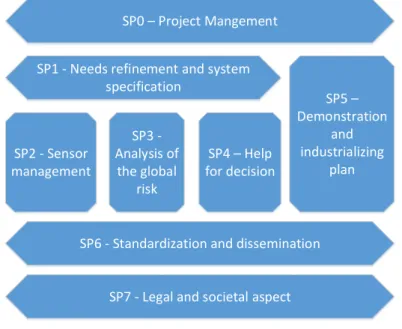
As introduced in chapter 1, the VIRTUALIS project is a project within a road-map to create a unified technological framework for the security of the infrastructure. In this project, different people from several cooperations and companies worked together to achieve this mission. Multiple tasks are divided for the appropriate members who are specialists in their field. The project VIRTUALIS was divided into eight sub-projects as illustrated by the diagram in Figure 2-1.
2.2. VIRTUALIS project
SP0 – Project Mangement SP1 - Needs refinement and system
specification SP2 - Sensor management SP3 - Analysis of the global risk SP4 – Help for decision SP5 – Demonstration and industrializing plan
SP6 - Standardization and dissemination
SP7 - Legal and societal aspect
Figure 2-1 – Plan of project VIRTUALIS
The objective of each sub-project is briefly described as following:
1. The sub-project project management (SP0), aims to ensure the administrative and technical management of the project.
2. The sub-project needs refinement and system specification (SP1) carries out an anal-ysis of the vulnerability risks incurred in the critical infrastructures selected in the project.
3. The sub-project sensor management (SP2) aims to enable the system to manage physical sensors according to a multi-tasking approach, by removing the lock of the heterogeneity of sensors and interfaces.
4. The sub-project analysis of the global risk (SP3) identifies existing data mining and risk analysis techniques that are best suited to the needs of the convergence of physical security and logical security.
5. The sub-project help for decision (SP4) completes the integration of the system to have a functional prototype for the physical and logical security of critical infrastructures.
Chapter 2. Project and dataset
6. The sub-project demonstration and industrializing plan (SP5) demonstrates the ca-pabilities of the VIRTUALIS prototype in a real environment.
7. The sub-project standardization and dissemination (SP6) ensures outward communi-cation about the project and the dissemination of results obtained during the project.
8. The sub-project legal and societal aspect (SP7) has a mission to integrate the VIR-TUALIS project in a global approach of legal and regulatory compliance.
The Systems Modeling and Safety laboratory (M2S) is one of the team members of the Charles Delaunay Institute, the research laboratory of the Troyes University of Technol-ogy (UTT). The M2S researchers whose specialist areas cover decision, diagnostic reliability and maintenance by essentially statistical approaches. In the VIRTUALIS project, M2S re-searchers participated mostly in SP3 sub-project.
2.2.2 Analysis of global risk - SP3
This work was part of the SP3 sub-project. This sub-project, led by SISPIA, aimed to conduct a risk analysis for global security (physical and logical) by dealing with the issue of the inadequacy and the incompatibility of existing tools in the field of security. The aim was to develop the ability to combine data from different security systems to treat them in a comprehensive and unified way. The objectives of this task are:
• Identify risk analysis methods for security systems that are adaptable to the issues of physical and logical security.
• Adapt these methods to the context of physical and logical security.
• Develop a dual physical/logical risk analysis software module.
More specifically, the mission of the consortium of the SP3 task was to propose different methods that analyze data from multiple types of source such as camera, card reader, iris sensor, etc. The output of each method was collected, and a fusion technique, in the final stage, decides if the system should raise the alarm or not. According to the
2.2. VIRTUALIS project
study provided by the SP1 sub-project, the VIRTUALIS project should be tested on two real cases: office building and metro station. Therefore, the SP3 task was also divided into two experimental cases.
In the first case, the system of sensors and security protocol were set up in an area inside Thales building in Palaiseau by the SP2 consortium, and SP3 consortium proposed their methods for this scenario. The second case of the project VIRTUALIS was defined as a metro station scenario. The dataset of this case was supposed to be provided by RATP, and a system of sensors should have been installed in the Chatelet metro station in Paris. However, during the development period, only data from the Thales building was available, mainly because of data privacy issue and problems of getting anonymous data. So the security system of the VIRTUALIS project only performs on the office scenario at Thales. So the VIRTUALIS dataset considered in this work is restricted to the dataset of the office scenario created in relation to Thales building.
Due to the constraint, LM2S researchers came up with four methods in the project, two of them belong to this thesis. Two methods have been proposed within this thesis. They are called AED and ATD.
2.2.3 Context
In this section, we present the environment of the working office scenario and its characteristic. Office buildings are private and closed to the public. Beyond the terrorist risk, the main risks that companies seek to reduce are acts of sabotage and espionage that jeopardize the assets of the company. Therefore, every person present in the infrastructure or connected to the information system must be authorized. These tertiary buildings are mostly equipped with security systems providing access control, perimeter protection, fire detection and card reader to the information system. These security systems operate inde-pendently and are therefore not adapted to the convergence of the two physical and logical worlds.
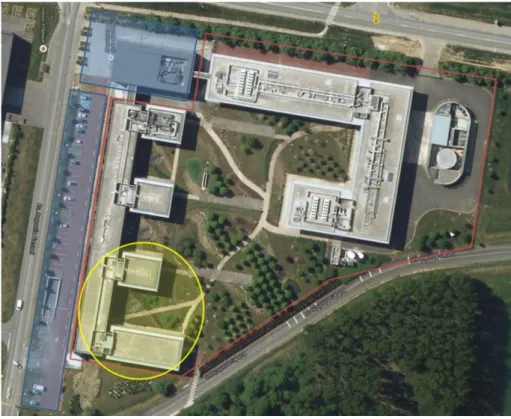
The Thales site in Palaiseau hosts Thales Research & Technology France as the main occupant. This is an example of the office building context. Several types of technical
Chapter 2. Project and dataset
Figure 2-2 – Thales TRT site in Palaiseau, an example of office building.
installations are present on the site: laboratories, offices and other zones in an operational state of support to the objectives of the Research Center. The experiments of the office scenario in VIRTUALIS project was executed at this location.
A view of the studied site is shown in Figure 2-2, where three different areas are highlighted. The areas in blue represent semi-public zones, in particular, the reception of the site and the visitor parking, under the responsibility of Thales, but open to the public; the zones in the red polygon represent the private spaces, accessible by authentication; the yellow circle bypasses part of the site, hosting the ThereSIS laboratory, which is the heart of the vulnerability analysis. This area is the place where the security system of the VIRTUALIS case was installed.
The essential activities of the Thales site include scientific activities, commercial and infrastructure supported activities. Supported services are parallel activities, which were not considered, except for the case of the security service. The scientific activity includes all the technical work done in the infrastructure. The commercial activity refers to the outward communication of the progress of the research activity (demonstrations to
2.2. VIRTUALIS project
customers, journalists, partners). The security service is responsible for monitoring the site’s facilities and premises.
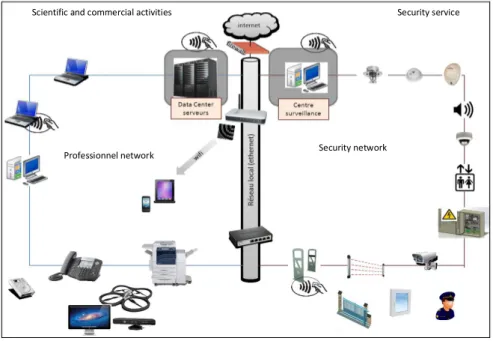
Scientific and commercial activities Security service
Professionnel network Security network
Figure 2-3 – Diagram of Thales TRT site installations
Two categories of activities are supported by two network systems: professional network and security network as in Figure 2-3. The professional network is used to connect multiple types of equipment in the building, for different tasks such as phone call, file transfer, server access. The security network is separated, which is used to control and receive information from security equipment such as gates, elevators, cameras or fire alarm.
2.2.4 Sensor system
According to the project roadmap, the sensor system was developed by the sub-project SP2, the aim was to provide some processed data so that the sub-sub-project SP3 is able to detect abnormal events.
The sensor system composed of camera and sensors was installed in the ThereSIS area as in Figure 2-4. Multiple types of sensor such as card reader, iris detector, movement detector control every activity in the ThereSIS area. All employees has to scan their card each time they enter and leave the area. There are two gates in ThereSIS area named
Chapter 2. Project and dataset
Card reader A3_out
Card reader A3_in
Sensor IRIS Card reader
Server room Movement detector Exit door Server door Card reader A4_out Elevator door Printer Card reader A4_in
(a) System of sensors installed on Thales TRT site
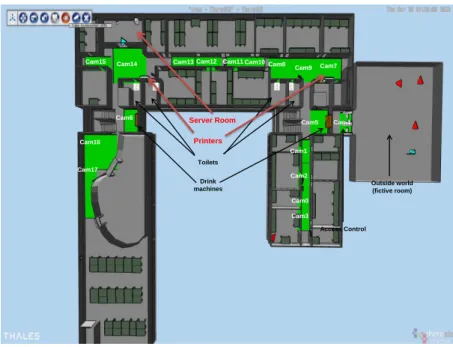
(b) System of camera installed on Thales TRT site
Figure 2-4 – System of sensors on Thales site
A3 and A4 entrance in Figure 2-4. Other card reader control are put at the server door, and at the printer. Only authorized employees are allowed to access these areas. Along with cameras, other sensors were installed to monitor the area. Cameras’s distribution is
2.2. VIRTUALIS project
presented in Figure 2-4b. The camera’s Field Of View (FOV) were concentrated on the printer zone (Figure 2-5).
Figure 2-5 – Camera’s FOV in ThereSIS laboratory.
2.2.5 Raw data processing
With the sensor system described as above, many issues can be solved, including physical and logical points. We can perform multiple tasks with the sensor system in Figure 2-4. The aim is to produce so called ’virtualization data’ from raw data captured from cameras and sensors. The physical issues are presented first:
• Visual presence detection and tracking [91]: The visual tracking system makes it possible to locate the pedestrians in critical infrastructure by the analysis of the video streams provided by a camera network. The algorithm is supposed to detect and track the pedestrians seen by the cameras, in real time. The visual tracking function is used to locate moving objects in the infrastructure when it is not provided with a specific localization device. It can be used to report potential intrusions into unauthorized areas.
• Face detection and recognition [38]: Face detection is a video analysis function that allows the system to determine the presence of a face in a video stream. Face
Chapter 2. Project and dataset
recognition uses the frame of the face detected, extracts the features of the face and compares with face patterns stored in a database to identify the person. The fact that in the real scenario, cameras cannot always capture human face because of different reasons such as the pose of the camera, pose of the head, illumination, resolution of the image... The solution of SP2 is to associate a 3D range sensor to each camera. With the 3D silhouette tracker, the person’s tracking is more robust. The 3D information (position and speed) allows to predict the position of the person and thus obtain less fragmented tracks. The combination of 2D images by camera and 3D silhouette tracks can perform the tracking and recognition task together.
• Fusion of multi-camera trajectories [14]: The multi-camera trajectory merge system makes it possible to associate the different trajectories given by the visual tracking system. This module implements a semi-global optimization algorithm for a graph that searches on a sliding time window for the paths connecting the most likely trajectories. One of the advantages of this method is to optimize the graph very quickly to meet real-time needs. Different criteria can be used to make the association. For example, trajectories can be matched using their appearance but also with geometric criteria such as their geographical proximity.
• Iris extraction and recognition [82]: Iris recognition is used to provide accurate identity authentication without a PIN number, passwords, or card numbers. Authen-tication process takes less than two seconds. This technology is video-based. Although "iris scanning" terminology is often used to refer to iris recognition technology, there is no sweeping involved. This technology is based on pattern recognition. With a proximity sensor-enabled device, a subject positioned 10 to 30 centimeters away is guided by a mirror, audio-assisted, and interactive interface to allow an autofocus camera to take a digital video from the camera iris. Individual images from the live video are captured using a capture card. The innovative iris recognition algorithm analyzes patterns in the iris that are visible between the pupil and the sclera (white of the eye) and converts them into a digital signature. This value is stored in a database and is communicated to the identification control units.
• Non-visual presence detection [45]: Perimeter detection systems detect the cross-ing of a light curtain by an individual. The infrared barriers can do such task. It
2.2. VIRTUALIS project
consists of emitters generating infrared beams of light and receivers that detect the cleavage of the beams. This sensor allows to analyze the distance of the optical return in order to detect the passage of a person and his direction.
• Card readers control [66]: Each staff member of the company is provided with an identification card. The entrances and exits of the staff are recorded by card readers using this card. These recordings are composed of the identifier of the card, the date and time of the passage, the direction of passage and the location of the card reader. The analysis of its cross-recordings with other data (example: staff planning) can be used to identify abnormal behavior and extract information related to the possible misuse of cards.
• Unauthorized usage of the printer: Detection of unauthorized usage is based on the principle that a person who sends a print request cannot be in front of the printer at the same time. So the person presents in front of the printer at the time of printing and get the document is, therefore, a person stealing documents or photocopier for industrial espionage purposes. This task is done by combining the presence detection by camera and printing command signals. Therefore a card reader control is attached to the printer, so only the owner of the printing command can withdraw his document.
Unlike the physical aspects, the logical issues in security do not require many equip-ments. Most of the task is done by software installed on the computer, some of the tasks are listed below:
• Intrusion detection system [20]: this issue is solved by implying that any access from an employee’s computer to the network means he is inside the infrastructure. A network connection of a computer of a person who has not badged his entry is therefore suspect and potentially falls under the usurpation of access rights.
• Phishing detection [61]: Several types of tools can be used to detect a phishing attempt by a site. These include tools that scan all visited URLs and connect to a centralized database that lists all known URLs for hosting phishing sites. Other tools analyze in real time the http content visited and apply heuristics to deduce suspicious sites (invalid certificates, complex URLs, ...). Finally, some tools analyze the emails
Chapter 2. Project and dataset
received to detect it from the source, emails containing suspicious links to phishing sites.
• Network Access Controller The network access control (NAC) is often provided by an appliance mechanism to prevent connection to a corporate network unidentified equipment, or not being in a condition deemed "healthy" (e.g., not having updated antivirus rules for several days).
• Virus detection: Virus detection is performed by a Host Intrusion Detection System (HIDS) that works in the same way as network intrusion detection systems, but on a machine. The detection of viruses is done by comparing the files and executables present on a machine to a database of known virus signatures. It can also be done by analyzing the suspicious behavior of applications (repeated system calls, adding new drivers, ...).
The VIRTUALIS project has proposed solutions to perform many tasks in a secu-rity system. The physical system installed in the ThereSIS laboratory and the raw data processing step allowed to collect ’virtualization data’ considered as an input for the risk analysis methods, which are the key point of SP3.
It has to be noticed that all the sub-projects started at the same time. So while the SP2 encountered many problems in installing the sensor system at ThereSIS to collect real data, or in making agreement on the format of the data, the proposed methods of SP3 were developed. The SP3 consortium needed data to train and validate the models. Therefore, a temporary dataset was required to test the methods, this was mainly the motivation to create the simulated dataset.
2.2.6 Simulated dataset
The simulated dataset was created using software by the Thales services SAS. The simulation system used a building similar to the real one (Figure 2-6). The timestamp of people’s activity follows Thales’s schedule (starting around 8 a.m, leaving around 18 p.m, lunchtime between 12 p.m and 14 p.m). Some versions of simulated dataset have been
2.2. VIRTUALIS project
built. The latest version was available in Juin 2016 and covers nine days. The experiments described in this manuscript used the latest version of data.
Cam4 Cam5 Cam1 Cam2 Cam0 Cam3 Cam7 Cam9 Cam8 Cam10 Cam11 Cam12 Cam13 Cam14 Cam15 Cam6 Cam16 Cam17 Toilets Drink machines Printers Server Room Outside world (fictive room) Access Control
Figure 2-6 – Simulation of Thales site.
Table 2.1 – Raw trajectory of the simulated dataset.
ID Time X Y
101 9:20:01 4.5 -5 101 9:20:02 4.6 -4.8 101 9:20:03 4.7 -4.6 101 9:20:04 4.8 -4.3
The simulated dataset and the real dataset are both composed of two parts: envi-ronmental information describing the position of the offices, elements in the building, and the operational records which contains trajectories from camera and sensor records. These information simulates the data that camera and sensor provide after the processing task. The simulated dataset is very complete. Since the data are generated, the tracking and recognition tasks are assumed to be perfect. In addition, it is assumed that the cameras cover perfectly the monitored area. It means that the precise position of every people in the building at any moment. The simulated environmental information described the camera’s field of view and the coordinates of the critical elements. The zone covered by the camera is given in green polygons in Figure 2-6.
Chapter 2. Project and dataset
coordinate, person ID. It corresponds to each observation at each time stamp for each person. Table 2.1 gives an example of a trajectory of an employee with ID 101.
Also, the simulated dataset also contains additional information such as the log from card readers at many locations like entrance, printer. An example of a sample is shown in Table 2.2. It has to be noticed that the coordinates can be found since the location of the card readers are known. Two supplemental information in this log is the type of action in each location and the functionality of the employee.
Table 2.2 – Simulated data: card readers record.
ID Time Action Location Function
101 9:20:01 pass A3 IN ENGINEER
301 9:25:21 pass A4 IN ADMIN
102 10:01:01 print PRINTER ENGINEER 103 10:20:01 withdraw PRINTER ENGINEER
This dataset allows to test many methods to analyze and detect abnormal events.
2.2.7 Real dataset
Two data acquisition campaigns were organized at Thales Research & Technology’s building in Palaiseau, in the ThereSIS area. The first campaign was done from February 22 to 26, 2016 and the second campaign was carried out from November 7 to 10, 2016. The second version of real dataset is used in our experiments.
Environmental information
The real environmental information is different from the simulated one, it is described as below:
• ID reference: registered unique ID for each employee in the Thales site and their personal information.
• Element’s position: coordinate of every element inside the building, from the sen-sors, doors, elevator to the printer, etc..
2.2. VIRTUALIS project
• Surveillance’s boundary: the polygon of camera’s FOV in the building. However, the FOV does not cover all areas of the building such as inside the office, and some ’dead’ corners on the corridor. On the contrary, the Printer area is covered by many camera’s FOV (Figure 2-5).
Operational records
The real operational record holds the records of each activity in the building. It is an enormous dataset with growing amount of data. This dataset includes the raw data of sensors and data after the preprocessing step which is called the virtualization data. These datasets were created by the SP2 members. Since we work on the SP3 sub-project, we are only interested in the virtualization data and our methods are developed based on this dataset. There are four categories of the virtualization data, they are presented as:
• Access control: Each observation in this category is created after a login by a card reader or Iris sensor. This category contains the output of the Iris recognition, double authentication iris/card, double identification face/card.
• Localization: the localization information is the largest category. It contains the Iris verification results and the trajectories captured from all cameras. This category contains the output of the multi-camera fusion module, visual tracking, face and iris recognition task.
• Correlation: the correlation category provides the information to connect discrete events of localization. It connects two instances of localization type that are possi-bly linked to the same person. It is the most important information to construct a complete trajectory. It contains the output of several modules of the sub-project SP2, includes the multi-camera fusion module, the face and iris recognition, the double authentication iris/card, and face/card.
• Intrusion: The intrusion category gathers the information from the infrared door sensor (non-visual presence detection), which captures every event linked to an en-trance and an exit for the doors of the server room and of the building.
Chapter 2. Project and dataset
Characteristics of the virtualized information
The virtualized information is the result of the data acquisition process. The infor-mation of the virtualization data is decided by the raw data collection and the preprocessing step. However, the face recognition can only be done when the person stands steadily in front of the camera. On the contrary, when a person passes through the camera’s field of view, only the trajectory is recorded. Therefore, there are two types of localization obser-vations produced by the camera. The first type is when the person’s face is captured by the camera, this observation return the person’s true ID (ID reference), but there is no trajectory (there is only one captured location, the camera’s location, because the person has to hold position in front of the camera). The second type is when the person passes through, the trajectory is captured, but the person’s identity is not known. The observation in this case stores the trajectory, and a new person ID is given for this person. The SP2 members have faced a difficult issue to correlate these two types of trajectories. So the real dataset contains two types of trajectories: sequences of camera’s location of a known user, or small discrete anonymous trajectories. Thus in the real dataset, the re-identification was not done perfectly. It leads to the fact that several trajectories which should have been associated were not.
The re-identification issue is one of the most complicated problems in a surveillance system. The re-identification requires that a person previously seen by a camera is seen later by another camera and is identified as the same. The difficulty of this task comes from the appearance changes across camera views due to the high difference in illumination, viewpoint or camera characteristics. Most of the current approaches rely on the appearance-based similarity between images to establish correspondences ([12], [27]) but the result is still limited.
2.2.8 Attacking scenarios
As the system of sensors captures activities in the building, data were collected to train the proposed methods. These data contain the normal activities of every people in the Thales building. However, the proposed methods cannot be tested with only normal
2.2. VIRTUALIS project
activities in the dataset. Therefore, attacking scenarios were prepared by security experts to test and evaluate the performance of the proposed methods in the SP3 sub-project for the abnormal detection task.
These scenarios simulate attacks from concurrents or enemies who want to steal confidential information from Thales’s database. Attackers could take advantage of the equipment connected to the professional network (Figure 2-3) like printers, telephone or PC to access the server. So the attacking scenarios were created, by standing on the attacker’s perspective, trying to access the critical elements such as a printer and a server room. These attacking scenarios were built for both simulated and real datasets with a small difference between them.
For the simulated dataset, the attack was carried out along in two days. In the first day, a competitor was invited by Thales to a meeting. This person approached the printer, plugged in a USB with malware and stick a note "Do not touch". In the afternoon the same day, another hacker disguised as a printer maintenance engineer and accessed to the information system through the printer. In the second day, a hacker used a card copied from an administrator to access the server room, stole the information and left the building.
The real dataset provided the same attack but with more details. Some actors in the consortium were chosen to play the role of the attackers. In the first day, things happen the same way as in simulated dataset, where attacker attached a USB into the printer to hack into the system. In the second day, a hacker stole a card from an administrator, made a copy and returned the real card. Then he waited for the administrator to leave the building, he used the copy card to access the server room, but the authentication failed due to the double card/Iris check. He returned there for the third day, waited for an administrator to leave the server room, hold the door and entered the server room. After staying in the server room for 5 minutes, he left the room and exited the building.
Until this point, this chapter has described the result of the first two sub-projects SP1 and SP2 of the VIRTUALIS project, including the sensor system in ThereSIS laboratory, the simulated datasets, real datasets and attacking scenarios. These results were transferred to the SP3 consortium to develop abnormal detection methods. The next part of this chapter introduces the ATC project, corresponds to the shopping center scenario.
Chapter 2. Project and dataset
2.3
ATC case
The VIRTUALIS project started in July 2014 and lasted for three years. During this project, the dataset from RATP was not provided as planned, so we lacked resource and support to achieve our thesis’s objective and to evaluate the proposed methods. In that situation, we searched for a dataset that provides real data of pedestrian trajectories in public place. After many days of searching and analyzing different available public datasets ([81], [103], [127]), we selected the ATC dataset [19]. This dataset came from the ATC project that took place at the ATC shopping center in Osaka, Japan. It is large because authors have set up a sensor system to collect data for 92 days, two days a week, spreading in one year from October 2012 to November 2013. As part of a project on enabling mobile social robots to work in public spaces [18] (project homepage in Japanese, founded by JST/CREST), a tracking sensor system was set up in the ATC shopping center. The system consists of multiple 3D range sensors, covering an area of about 900𝑚2.
The ATC shopping mall is characterized as a wide surveillance area, large diversity of visitors and is an open environment. Unlike the office scenario in the Thales building, where cameras are only installed in the corridor and camera’s field of view is limited inside the office, most of the area in the ATC building is covered by the camera’s system, and pedestrians’ trajectory is fully captured from the moment they enter until they leave. Al-though the objective of this dataset is not security, the quantity and quality of trajectories in this dataset attracted our attention, and we have decided to use this dataset to evaluate our proposed methods.
2.3.1 Context
The Asia & Pacific Trade Center, located within the Cosmo Square area on Sak-ishima (Nanko) Island, is both a business and a pleasant venue. A world-class international wholesale trade complex filled with shops and extensive business information.
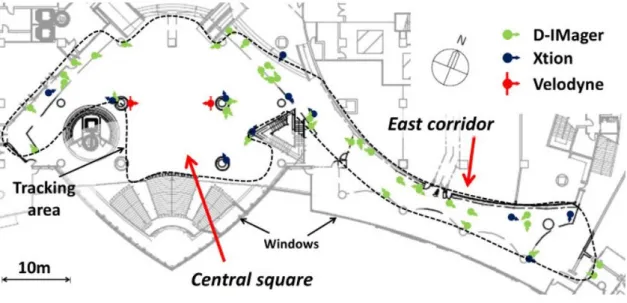
In the ATC site, the setup plan of three types of sensors is described in Figure 2-7. This building is a crowded place, and connects a train station, commercial buildings, and a dock. So the pedestrians in this building have different purposes and destinations. In
2.3. ATC case
Figure 2-7 – Sensor setup plan in the ATC shopping mall center.
general, the building is divided into a central square and a corridor as in Figure 2-7. The central square is where people stay to wait for the train or ship, and is also a place for exhibition. On the other hand, the corridor is narrow, and people mostly pass through this area.
Unlike the VIRTUALIS project where multiple security tasks are performed in the ThereSIS laboratory, the sensor system in the ATC project focused on pedestrian detection and tracking task. Thus, the two projects are different in their original objective, and in their environment. It is difficult to deploy card readers at the entrances in such context, and there are no critical elements like printers or server.
2.3.2 Sensor system
The sensor system of the ATC project was described by the authors in [19]. The objective was to observe the motion of all the pedestrians in the building, using multiple stationary sensors distributed in the environment. In other words, authors tried to find a practical way to track people in wide public environments automatically for a long period. The proposed requirements of a tracking sensor system are that it needs good tracking accuracy for a varying number of people in the surveillance area, and it is scalable to wide areas and could be connected easily.
Chapter 2. Project and dataset
The current technology for the tracking task includes the camera, laser range finder, and 3D range sensor. The camera was used in most of the surveillance application [77], as in the VIRTUALIS project. However, there exist the limitation in tracking the position of the pedestrian and the body direction estimation problem [90]. In addition, the implementation of the camera for a wide public place is limited, due to the changing illumination issue. Laser range finder, which uses a laser ray to scan the area has been used for human position tracking in public space ([51], [47]). However, This kind of sensor only perform well in a situation with a small number of people, and it can lead to increasing errors in a wide environment. Many works have applied 3D range sensors for detecting and tracking task ([117], [104]). This kind of sensor can detect the position of the person and the angle of the body and the head.
Due to the environment of wide public space of the ATC shopping center, authors preferred the range sensor over the color camera. The advantage of the range sensor is that it is not affected by the change of illumination, and it is more suitable for the wide and crowded area. However, it contains less information than the color image which leads to a limitation in the recognition task. However, in the ATC case where the research had to respect the privacy issues of the pedestrian. Combining the discussed reasons, authors chose 3D range sensors for the solution of tracking issue in the ATC project. Three types of 3D range sensors were chosen for the experiment:
• Time-of-Flight cameras: ToF cameras measure the time a projected light needs to travel to an object to determine the distance. Their usable range is similar to those of structured light cameras, but they, in general, have much noisier measurements, with the level of noise increases with the distance. There is also a substantial interference between sensors which can result in unstable distance measurements. However, the influence of external light for some of the commercially available ToF cameras is much smaller. The price is in the mid-low range, usually several tens of times more expensive than the available structured light cameras. The sensor used here is Panasonic D-IMager EKL31053.
• Structured light cameras: This type of sensor measures ranges based on camera views of a projected light pattern. From installation in wide public spaces, these
2.3. ATC case
sensors have a relatively small usable range: the maximum range at which correct and stable measurements can still be obtained is around 5 meters. The measurements are accurate with low noise, especially for close ranges. However, they suffer from a strong influence of external light and from interference between sensors, which can cause missing measurements. The number of missing measurements increases with distance, especially for dark objects like dark hair. The current market price of this type of sensor is very affordable. In this work, authors used Microsoft Kinect1 and Asus Xtion PRO2 models.
• Multi-layer laser scanners: These sensors use multiple laser scanning units rotating together to obtain a 3D range measurement. The maximum measurement distance for these sensors is much larger than for above types. They are also very accurate with low levels of noise, and virtually no influence from external light or other sensors. Their main weakness is the low resolution of the measurements in the vertical direction as defined by the number of sensing units, which gives a limit on the range up to which they can be used for tracking. The cost of the sensor is considerably higher than for the above two types. The Velodyne HDL-32E4 were used in the implementation.
These types of 3D range sensors were distributed in the ATC building at the position described in Figure 2-7. They were used to collect data on pedestrians in this location.
2.3.3 Real dataset
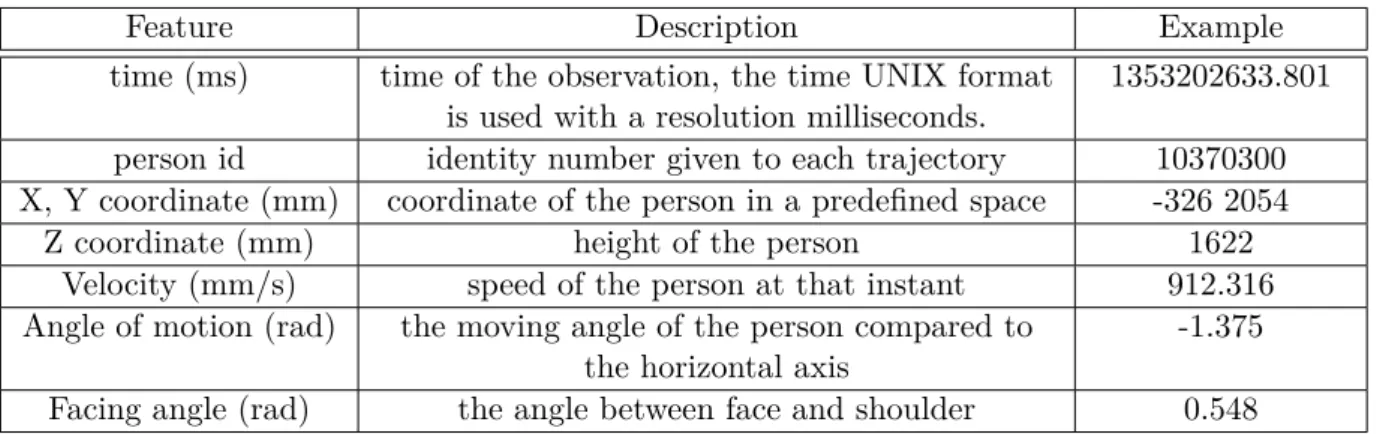
The data acquisition was done every week on Wednesday and Sunday, from morning until evening (9:40-20:20). The objective is taking a sample working day and a weekend, to limit the volume of the dataset but keep the information. The dataset was provided as CSV files, each row corresponds to a single observation of a person. An observation is described in Table 2.3. The precise environmental dataset is not available in the papers. Thus, the boundary of the ATC building was estimated from the boundary of the cloud movement points.
The ATC dataset has more features from tracking task than the VIRTUALIS dataset due to the ability of the 3D range sensors. The height of pedestrian is estimated so it
Chapter 2. Project and dataset
Table 2.3 – Raw trajectory of ATC dataset.
Feature Description Example
time (ms) time of the observation, the time UNIX format is used with a resolution milliseconds.
1353202633.801
person id identity number given to each trajectory 10370300 X, Y coordinate (mm) coordinate of the person in a predefined space -326 2054
Z coordinate (mm) height of the person 1622
Velocity (mm/s) speed of the person at that instant 912.316 Angle of motion (rad) the moving angle of the person compared to
the horizontal axis
-1.375
Facing angle (rad) the angle between face and shoulder 0.548
is possible to predict if this person is a child or a matured person. The speed at each observation is also kept. The angle of motion feature keeps the moving angle of the person compares to a predefined axis. Moreover, the facing angle is the angle between the face and the body, it can tell if a person is looking around or going straight. Although the dataset is only stored for two days a week, its volume is enormous and can be difficult to import and process on a personal computer. The ATC dataset corresponds to approximately 40 gigabytes of compressed files, which takes a lot of space in the memory. So in the experiments, we usually process on a subset of this dataset.
There is a small labeled dataset which was made for an experiment in [18]. It includes trajectories of 29 people who were labeled as atypical by a human coder, as well as 29 people who were labeled as typical. The labeled dataset contains trajectories from two days: 11 and 18 November 2012. In this context, the meaning of anomaly is a person who seems to get lost and need help.
2.4
Conclusion
This chapter presented the sensor system, the environment and the dataset of two studied cases VIRTUALIS and ATC. The thesis is a part of the project VIRTUALIS, in which we proposed the methods to detect abnormal behaviors for security infrastructure. The ATC dataset was chosen as an additional experiment case to apply our proposed methods. This is a public dataset which contains several pedestrian trajectories captured in one year. Although the objective of the ATC project is not for security, the ATC dataset
2.4. Conclusion
is still a perfect case to apply our detection methods due to its open space environment and the complicated flow of pedestrians.
The VIRTUALIS project uses various types of sensors and camera to capture all types of activities in a building, from physical to logical. On the other hand, the ATC project performed a robust solution for the tracking task using 3D range sensors. These two projects create an overall view of the security solution for critical infrastructure.
The provided datasets thanks to these sensor systems are spacial-temporal sequence data. The main objective of the VIRTUALIS project, was to develop anomaly detection methods for security in infrastructures. In the next chapter, the state of the art of the anomaly detection problem, when dealing with sequence data is introduced.
Chapter 3
Anomaly detection for trajectory
data
3.1
Introduction
The detection of abnormal trajectory is the core issue of this thesis. Different from trajectory patterns mining where the patterns that frequently occur in trajectory data are searched, trajectory outliers detection consists to isolate trajectories or segments of trajectory that are significantly different from others regarding some similarity metrics. One can also be interested in events or numbers of observation that share same properties that do not conform to expected patterns (e.g., traffic congestion caused by a car accident). Discovering abnormal trajectories in a large-scale dataset also has remarkable meaning and practical value and can be associated to the same group of problem.
This chapter aims to introduce the methods and application of the anomaly detection that were mainly applied to sequences. Section 3.2 presents first the general definition of anomaly detection problem, and second, some popular methods for anomaly detection. We categorize the anomaly detection methods into two groups: density-based methods and boundary-based methods. In section 3.3, the definition and approaches using trajectory as input, as well as the methods to process this type of data are described. These approaches motivated us to propose new methods for the VIRTUALIS project.