HAL Id: tel-01597061
https://tel.archives-ouvertes.fr/tel-01597061
Submitted on 28 Sep 2017
HAL is a multi-disciplinary open access
archive for the deposit and dissemination of sci-entific research documents, whether they are pub-lished or not. The documents may come from
L’archive ouverte pluridisciplinaire HAL, est destinée au dépôt et à la diffusion de documents scientifiques de niveau recherche, publiés ou non, émanant des établissements d’enseignement et de
Marwa Ammar
To cite this version:
Marwa Ammar. Visual saliency extraction from compressed streams. Image Processing [eess.IV]. Institut National des Télécommunications, 2017. English. �NNT : 2017TELE0012�. �tel-01597061�
THESE DE DOCTORAT CONJOINT TELECOM SUDPARIS
et L’UNIVERSITE PIERRE ET MARIE CURIE
Thèse n° 2017TELE0012
Spécialité : Informatique et Télécommunications
Ecole doctorale : Informatique, Télécommunications et Electronique de Paris
Présentée par Marwa AMMAR
Pour obtenir le grade de DOCTEUR DE TELECOM SUDPARIS
Visual saliency extraction from compressed streams
Soutenue le 15 juin 2017 devant le jury composé de :
Pr. Patrick GALLINARI, Université Pierre et Marie Curie Président Pr. Jenny BENOIS-PINEAU, Université de Bordeaux Rapporteur MdC. HDR Claude DELPHA, Université ParisSud Rapporteur
Pr. Faouzi GHORBEL, ENSI Tunis Examinateur
Dr. Matei MANCAS, Université de Mons Examinateur Pr. Patrick LE CALLET, Université de Nantes Invité
MdC HDR. Mihai MITREA, IMT-TSP Directeur de thèse
3
This thesis becomes a reality with the support and help of many people to whom I would like to express my sincere thanks and acknowledgment.
My deep gratitude goes to my thesis director, HDR Mihai Mitrea for his warm welcome when I first stepped to the ARTEMIS department at the IMT – Telecom SudParis. I would like to express my appreciation for his trust and for seeing in me a future PhD. I would also like to thank him for granting me with the chance of starting the research work on the novel and exciting topic of visual saliency in the compressed stream as well for his valuable guidance, timely suggestions and support throughout not only my thesis but my engineering and masters internships as well.
My deep gratitude also goes to the distinguished members of my defense committee, and particularly to the two reviewers, Prof. Jenny Benois-Pineau and Prof. Claude Delpha, for their precious feedback and enriching comments that contributed to the final version of this manuscript.
I am thankful to Ecole Nationale des Sciences de l'Informatique, for the sound education I received there during my engineering and masters programs.
My colleagues Marwen Hasnaoui and Ismail Boujelbane deserve a special mention: I thank them for helping me with their watermarking and software skills and passion as well as for their availability during this thesis.
I would like to thank Mrs. Evelyne Taroni for her proactive attitude and valuable administrative help during my engineering, master and PhD internships at the ARTEMIS department.
In addition, I like to thank the entire ARTEMIS team, former and present members that I have met and particularly Rania Bensaied who helped me with the subjective evaluation experiments.
I am mostly fortunate to have the opportunity to acknowledge gratitude to the people who mean the most to me. My parents Mohamed and Leila, who raised me, taught me, and supported me all throughout my life: their selfless love, care, pain and sacrifices shaped my life.
I like to deeply thank my brother Yassine, my sister Siwar and my nephew Hassan for their motivational discussions and emotional support.
I am extremely thankful to my family in law for loving and encouraging me during my thesis.
For my friends Mehdi, Azza and Ola and for all those who have touched my life in any way since I started this thesis, I am grateful for all they have done.
Last but not the least, I owe thanks to a very special person, my husband Anis, for his continuous and unfailing love, support and understanding during the pursuit of my PhD degree. He was always around at times I thought that it would be impossible to continue, he helped me to keep things in perspective and that made the completion of thesis possible. I appreciate my little son Anas, for abiding my ignorance and for the patience he showed during my thesis writing. Words would never say how grateful I am to both of them. I consider myself the luckiest in the world to have such a lovely and caring family, standing beside me with their love and unconditional support.
5
Table of Contents
RESUME 15
ABSTRACT 25
I. INTRODUCTION 35
I.1. Saliency context 37
I.1.1. Biological basis for visual perception 37
I.1.2. Image processing oriented vision modeling 38
I.2. Watermarking context 43
I.3. Video coding & redundancy 45
I.4. Conclusion 46
II. STATE OF THE ART 49
II.1. Bottom-up visual saliency models 51
II.1.1. Image saliency map 51
II.1.2. Video saliency map 58
II.1.3. Conclusion 64
II.2. Visual saliency as a watermarking optimization tool 68
II.3. Direct compressed video stream processing 72
III. SALIENCY EXTRACTION FROM MPEG-4 AVC STREAM 77
III.1. MPEG-4 AVC saliency map computation 79
III.1.1. MPEG-4 AVC elementary saliency maps 79
III.1.2. Elementary saliency maps post-processing 83
III.1.3. Elementary saliency map pooling 84
III.2. Experimental results 85
III.2.1. Ground truth validation 86
III.2.2. Applicative validation 97
III.4. Conclusion 108
IV. SALIENCY EXTRACTION FROM HEVC STREAM 109
IV.1. HEVC saliency map computation 111
IV.1.1. HEVC elementary saliency maps 112
IV.1.2. Elementary saliency map post-processing 115
IV.1.3. Saliency maps pooling 115
IV.2. Experimental results 115
IV.2.1. Ground truth validation 116
IV.2.2. Applicative validation 124
IV.3. Discussion on the results 126
IV.4. Conclusion 132
V. CONCLUSION AND FUTURE WORK 133
V.1. Conclusion 134
V.1.1. Saliency vs. Compression 134
V.1.2. Saliency vs. Watermarking 136
V.2. Future works 137
VI. APPENDIXES 139
A Fusing formula investigation 140
A.1. MPEG-4 AVC fusing formula validation 142
A.2. HEVC fusing formula validation 147
A.3. Conclusion 151
B. MPEG-4 AVC basics 152
B.1. Structure 152
B.2. Encoding 153
C. HEVC basics 158
C.1. Structure 158
C.2. Encoding 159
C.3 How HEVC is different? 161
D. Tables of the experimental results 162
D.1 MPEG-4 AVC saliency map validation 162
D.2 HEVC saliency map validation 165
M. AMMAR visual saliency extraction from compressed streams
7
E. Graphics of the experimental results 171
REFERENCES 173
LIST OF PUBLICATIONS 181
9
List of figures
Figure 0-1: Evolution du contenu multimédia. ... 17
Figure 0-2: Le temps moyen (en heure) passé en regardant un contenu télé/vidéo dans le monde durant la deuxième trimestre de 2016 [WEB01]. ... 18
Figure 0-3: Le trafic internet du consommateur 2015-2019 [WEB02]. ... 18
Figure 1: Multimedia content evolution. ... 27
Figure 2: Average daily time (in hours) spent on viewing TV/video content worldwide during the second quarter 2016 [WEB01]. ... 28
Figure 3: Consumer Internet traffic 2015-2019 [WEB02]. ... 28
Figure I-1: Human eye anatomy. ... 37
Figure I-2: Visual saliency features. ... 42
Figure I-3: General scheme of watermarking approach. ... 44
Figure I-4: MPEG-4 AVC/HEVC compression chain. ... 45
Figure II-1: Domains of bottom-up saliency detection models; in blue: studies related to still images; in green: studies related to videos. P, T, Q, E stand for Prediction, Transformation, Quantification and Encoding, respectively. ... 51
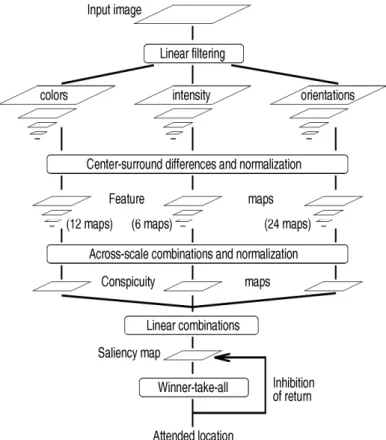
Figure II-2: Synopsis of Itti’s model [ITT98]: the saliency map is obtained by a multi-scale extraction model consisting on three feature extraction, normalization and fusion of the elementary maps. ... 52
Figure II-3: Saliency extraction based on the Shannon’s self-information [BRU05]: the visual saliency is determined by a sparse representation of the image statistics, learned from the prior knowledge of the brain. ... 53
Figure II-4: Computation steps of Harel’s model [HAR06]: the saliency is determined by extracting features, normalising, then fusing the elementary maps... 54
Figure II-5: Flowchart of the biologically inspired model advanced in [LEM06]... 54
Figure II-6: Saliency map computation flowchart: extracting visual saliency by exploiting the singularities in the spectral residual. ... 55
Figure II-7: A context aware saliency model: the saliency is enhanced by using multiple scale filtering and visual coherency rules [GOF10]. ... 55
Figure II-8: Principle of the saliency approach [MUR11]: the saliency is obtained according to a biologically inspired representation based on predicting color appearance. ... 56
Figure II-9: Soft image abstraction and decomposition into perceptually homogenous regions [CHE13]: the saliency map is extracted by considering both appearance similarity and spatial overlap... 57
Figure II-10: Saliency map computation steps [FAN12]: the saliency map is obtained, in the transformed domain of the JPEG compression, through a so-called coherent normalized-based fusion. ... 57
Figure II-11: Workflow of the saliency model [ZHA06]: the saliency map is obtained through a dynamic fusion of the static and the temporal attention model. ... 58
Figure II-12: Flowchart of the proposed model [LEM07]: the saliency map is the result of a weighted average
operation of achromatic and two chromatic saliency maps. ... 59
Figure II-13: Incremental coding length model’s different steps [HOU08]: the saliency extraction model is based on the incremental coding length of each feature. ... 60
Figure II-14: Illustration of image/video saliency detection model [SEO09]: the saliency map is obtained by applying the self resemblance indicating the likelihood of saliency in a given location. ... 61
Figure II-15: Saliency computation graph [MAR09]: the attention model was computed on two parallel ways: the static way and the dynamic way. ... 62
Figure II-16: Multiresolution spatiotemporal saliency detection model based on the phase spectrum of quaternion Fourier transform (PQFT) [GUO10]. ... 62
Figure II-17: Flowchart of the saliency computation model [FAN14]: the visual saliency is extracted from the transformed domain of the MPEG-4 ASP. ... 64
Figure II-18: Principle of a watermark embedding scheme based on saliency map. ... 68
Figure II-19: Video quality evolution. ... 72
Figure III-1: Saliency map computation in a GOP. ... 79
Figure III-2: Orientation saliency: the central block into a 5x5 block neighborhood is not salient when its “orientation” is identical with its neighbors (see the left side of the figure); conversely, if the block orientation differs from its neighbors, the block is salient (see the right side of the figure). ... 82
Figure III-3: Motion saliency: the motion amplitude over all the P frames in the GOP is summed-up. ... 83
Figure III-4: Features map normalization... 84
Figure III-5: MPEG-4 AVC saliency map (on the left) vs. density fixation map (on the right). ... 87
Figure III-6: KLD between saliency map and density fixation map... 88
Figure III-7: AUC between saliency map and density fixation map. ... 91
Figure III-8: Saliency map behavior at human fixation locations (in red + signs) vs. saliency map behavior at random locations (in blue x signs). ... 92
Figure III-9: KLD between saliency map at fixation locations and saliency map at random locations (N=100 trials for each frame in the video sequence). ... 93
Figure III-10: AUC between saliency map at fixation locations and saliency map at random locations (N=100 trials for each frame in the video sequence). ... 93
Figure III-11: KLD between saliency map at fixation locations and saliency map at random locations (N=100 trials for each frame in the video sequence). ... 95
Figure III-12: AUC between saliency map at fixation locations and saliency map at random locations (N=100 trials for each frame in the video sequence). ... 97
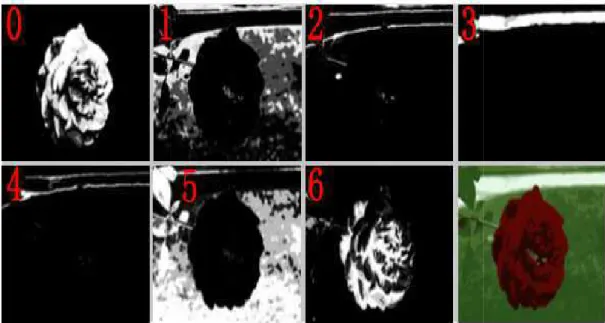
Figure III-13: Illustrations of saliency maps computed with different models. ... 107
Figure IV-1: Difference between HEVC and MPEG-4 AVC block composition. ... 112
Figure IV-2: KLD between saliency map and density fixation map. ... 117
11
Figure IV-4: KLD between saliency map at fixation locations and saliency map at random locations (N=100 trials for each frame in the video sequence). ... 121 Figure IV-5: AUC between saliency map at fixation locations and saliency map at random locations (N=100 trials for each frame in the video sequence). ... 122 Figure IV-6: KLD between saliency map at fixation locations and saliency map at random locations (N=100 trials for each frame in the video sequence). ... 122 Figure IV-7: AUC between saliency maps at fixation locations and saliency map at random locations (N=100 trials for each frame in the video sequence). ... 124 Figure IV-8: Illustrations of saliency maps computed with different models. ... 131
List of tables
Tableau 0-1: Extraction de la saillance visuelle à partir du domaine vidéo compressé: contraintes, défis,
limitations et contributions... 24
Table 1: Visual saliency extraction from video compressed domain: constraints, challenges, current limitations and contributions. ... 34
Table II-1: State of the art synopsis of saliency detection models. ... 66
Table II-2: State-of-the-art of the watermark embedding scheme based on saliency map. ... 71
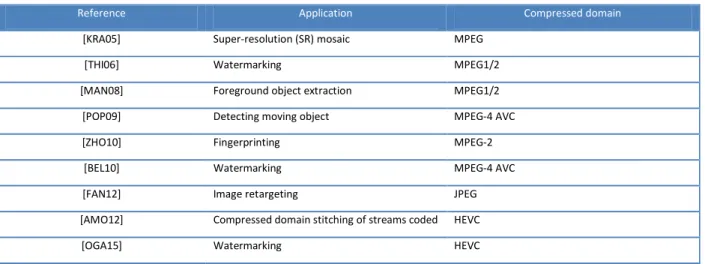
Table II-3: State of the art of the compressed stream application. ... 75
Table III-1: Assessment of the model performance in predicting visual saliency. ... 87
Table III-2: KLD gains between Skewness-max, Combined-avg and Addition-avg and the state of the art methods [CHE13] [SEO09] [GOF12]. ... 89
Table III-3: KLD sensitivity gains between Skewness-max, Combined-avg and Addition-avg and the state of the art methods [CHE13] [SEO09] [GOF12]. ... 90
Table III-4: AUC values between saliency map and density fixation map with different binarization thresholds. ... 91
Table III-5: AUC sensitivity gains between Skewness-max and Combined-avg and the state-of-the-art methods [CHE13][SEO09][GOF12]. ... 94
Table III-6: AUC values between saliency map at fixation locations and saliency map at random locations with different binarization thresholds (N=100 trials)... 94
Table III-7: KLD gains between Multiplication-avg and Static-avg and the three state of the art methods [CHE13][SEO09][GOF12]. ... 96
Table III-8: KLD sensitivity gains between Multiplication-avg and Static-avg and the three state of the art methods [CHE13][SEO09][GOF12]. ... 96
Table III-9: Objective quality evaluation of the transparency when alternatively considering random selection and “Skewness-max” saliency map based selection. ... 99
Table III-10: MOS gain between the QIM method with random selection and saliency map “Skewness-max” based selection. ... 100
Table III-11: Ground truth validation results ... 100
Table III-12: Computational complexity comparison between our method and the three state of the art models considered in our study. ... 104
Table III-13: Computational time per processed frame of our method and the three state of the art models considered in our study. ... 104
Table IV-1: KLD gains between all the combination of HEVC saliency maps and the state of the art methods [CHE13] [SEO09] [GOF12] and MPEG-4 AVC saliency map. ... 118
Table IV-2: KLD sensitivity gains between all considered HEVC saliency map combinations and the state of the art methods [CHE13] [SEO09] [GOF12] and MPEG-4 AVC saliency map. ... 118
13
Table IV-3: AUC gains between all the combinations of HEVC saliency maps and the state of the art methods [CHE13] [SEO09] [GOF12] and MPEG-4 AVC saliency map. ... 119 Table IV-4: AUC sensitivity gains between Combined-avg, Addition-avg and Static-avg and the state of the art methods [CHE13] [SEO09] [GOF12] and MPEG-4 AVC saliency map. ... 120 Table IV-5: KLD gains between Multiplication-avg and Static-avg and the state of the art methods [CHE13] [SEO09] [GOF12] and MPEG-4 AVC saliency map. ... 123 Table IV-6: KLD sensitivity gains between Multiplication-avg and Static-avg and the state of the art methods [CHE13] [SEO09] [GOF12] and MPEG-4 AVC saliency map. ... 123 Table IV-7: Objective quality evaluation of the transparency when alternatively considering random selection and “Combined-avg” saliency map based selection. ... 125 Table IV-8: MOS gain between the watermarking method with random selection and saliency map “Combined-avg” based selection. ... 126 Table IV-9: Ground truth validation results... 127 Table V-1: Comparison of the results of KLD and AUC between saliency maps and fixation maps. ... 135 Table V-2: Comparison of the results of KLD and AUC between saliency maps at fixation locations and saliency maps at random locations (N=100 trials for each frame in the video sequence). ... 136
Résumé
15
Le contexte
Dans dix ans, allez-vous lire ce r yeux en premier lieu?
En 2020, 82% du trafic sur interne Au début des années 1980, les o À la fin des années 1980 et au comment les ordinateurs pouv multimédia comme un moyen fournissant des informations no vidéo et des graphiques 3D. Au fil des années, les technolog vie, faisant partie aujourd’hui encyclopédies aux livres de cuisi devient notre référence et, qu’ professionnelles et personnelles
Figure 0-1: Evolution du contenu multim
De nos jours, grâce aux dispositi (très) haut débit, une quantité distribuée instantanément. Au m vidéo (soit environ 90 ans de moyenne, dans le monde, que p Par exemple, en France, 4,1 heur
rapport de thèse ou le regarder en tant que vidé
net sera conquis par les vidéos…
ordinateurs ont émergé dans les entreprises, les é u cours des années 1990, les scientifiques ont vaient être exploités comme jamais auparava n d'utiliser les ordinateurs d'une manière p on seulement en utilisant du texte, mais aussi d
gies et les applications multimédias ont progres i de notre routine professionnelle et person ine et de la simulation scientifique aux jeux FIFA ’on l'accepte ou non, notre premier repère da s.
média.
ifs abordables (capture, traitement et stockage) é massive de contenu vidéo générée par l'uti moment de la rédaction du présent document, 2
vidéos HD) sont produites chaque jour. Figur passe un utilisateur à regarder une vidéo sur int res par jour sont consacrées à regarder du conte
Résumé
17
éo? Que vont capter vos
écoles et les maisons. t commencé à imaginer ant. Ils ont considéré le personnelle, unique, en des images, du son, de la
ssivement conquis notre nnelle, Figure 0-1. Des A, le contenu multimédia ans les activités sociales
et à l'ubiquité de l'accès ilisateur est produite et 2,5 exabytes de données re 0-2 montre la durée ternet ou devant la télé. enu vidéo !
Figure 0-2: Le temps moyen (en heure) de 2016 [WEB01].
L'enregistrement de toutes les sociaux montre des statistiques t jour, les utilisateurs de Snapcha passent 46 000 ans à regarder YouTube est incroyablement po génération millénaire ont décla [WEB03]. Aux États-Unis, plus qu et la variété de leurs âges, sexes
Figure 0-3: Le trafic internet du consom
La Figure 0-3 montre que l’inter de consommer tout autre conten renforcée dans un proche aven [WEB04].
passé en regardant un contenu télé/vidéo dans le monde
s visualisations et toutes les inscriptions des très intéressantes sur la tendance de l'utilisation at regardent 6 milliards de vidéos alors que les des vidéos. Le contenu ‘How-to’ lié à la cuisin opulaire, avec 419 millions de vues, tandis qu aré avoir regardé aussi des vidéos pendant la ue 155 millions de personnes jouent à des jeux vi
et statuts socioéconomiques.
mmateur 2015-2019 [WEB02].
rnaute a une préférence remarquable pour rega nu multimédia. La suprématie du contenu vidéo
nir: en 2020, 82% du trafic sur internet sera
e durant la deuxième trimestre
utilisateurs des réseaux n vidéo, [WEB02]. Chaque s utilisateurs de YouTube ne et à la nourriture sur ue 68% des mères de la a préparation des repas idéo malgré la différence
arder la vidéo plutôt que sur le trafic internet sera conquis par les vidéos
Résumé
19
Le monde contient trop d’information visuelle pour arriver à la percevoir spontanément …
En raison de sa taille et de sa complexité, la production, la distribution et l’utilisation des vidéos a augmenté le besoin et la nécessité des études et des recherches scientifiques qui traitent la relation entre les contenus numériques et le mécanisme visuel humain.
Il y a une énorme différence entre l'image affichée sur un dispositif et l'image que notre cerveau perçoit. Il existe, par exemple, une différence entre la luminance d'un pixel sur un écran d'ordinateur et son impact visuel. La vision dépend non seulement de la perception des objets, mais aussi d'autres facteurs visuels, cognitifs et sémantiques.
Le système visuel humain (SVH) a la capacité remarquable d’être attiré automatiquement par des régions saillantes. Les bases théoriques de la modélisation de la saillance visuelle ont été établies, il y a 35 ans, par Treisman [TRE80] qui a proposé la théorie d’intégration du système visuel humain : dans tout contenu visuel, certaines régions sont saillantes grâce à la différence entre leurs caractéristiques (intensité, couleur, texture, et mouvement) et les caractéristiques de leurs voisinages.
Peu de temps après, Koch [KOC85] a mis en œuvre un mécanisme de sélectivité, stimulant l’attention humaine : dans n'importe quel contenu visuel, les régions qui stimulent les nerfs de la vision sont d'abord choisies et traitées, puis le reste de la scène est interprété.
Dans le traitement de l'image et de la vidéo, le mécanisme complexe de l’attention visuelle est généralement présenté par une carte dite carte de saillance. Une carte de saillance est généralement définie comme une carte topographique 2D représentant les régions d’une image/vidéo sur laquelle le système visuel humain se focalisera spontanément.
Les objectifs
Cette thèse vise à offrir un cadre méthodologique et expérimental complet pour traiter la possibilité d’extraire les régions saillantes directement à partir des flux vidéo compressés (MPEG-4 AVC et HEVC), avec des opérations de décodage minimales.
Notez que l’extraction de la saillance visuelle à partir du domaine compressé est à priori une contradiction conceptuelle. D’une part, comme suggéré par Treisman [TRE80], la saillance est donnée pas des singularités visuelles dans le contenu vidéo. D’autre part, afin d’éliminer la redondance visuelle, les flux compressés ne sont plus censés présenter des singularités. Par conséquence, la thèse étudie si la saillance peut être extraite directement à partir du flux compressé ou, au contraire, des opérations complexes de décodage et de pré/post-traitement sont nécessaires pour ce faire.
La thèse vise également à étudier le gain pratique de l’extraction de la saillance visuelle du domaine compressé. A cet égard, on a traité le cas particulier du tatouage numérique robuste des contenus vidéo. On s’attend que la saillance visuelle acte comme un outil d’optimisation, ce qui permet d’améliorer la transparence (pour une quantité de données insérées et une robustesse contre les attaques prescrites) tout en diminuant la complexité globale de calcul. Cependant, la preuve du concept est encore attendue.
L’état de l’art: limitations et contraintes:
La thèse porte sur les limitations et les contraintes liées au cadre méthodologique de l’extraction de la saillance visuelle à partir du domaine compressé, à sa validation par rapport à la vérité terrain ainsi que sa validation applicative.
Tout d’abord, il faut noter que plusieurs études, concernant les images fixes et la vidéo, ont déjà considéré des cartes de saillance afin d’améliorer les performances d’une grande variété d’applications telles que le traitement des scènes rapides, la prédiction des vidéos surveillances et la détection/reconnaissance d’objets… Ces études couvrent une large étendue d'outils méthodologiques, de la décomposition pyramidale dyadique gaussienne aux modèles inspirés par la biologie. Cependant, malgré leur vaste spectre méthodologique, les modèles existants extraient les régions saillantes à partir du domaine des pixels. D’après notre connaissance, au début de cette thèse, aucun modèle d’extraction dans le domaine compressé n’a été signalé dans la littérature.
Deuxièmement, d’un point de vue évaluation quantitative, les études de la littérature considèrent différentes bases de données, de différentes tailles (par exemple, de 8 images fixes à 50 séquences vidéo jusqu'à 25 min) et / ou pertinence (cartes de densité de fixation, les emplacements du saccade, …). La confrontation de la carte de saillance obtenue à la vérité terrain est étudiée en considérant des types particuliers de mesures, comme les métriques basées sur la distribution (par exemple, la divergence de Kullback Leibler, le coefficient de corrélation linéaire, la similitude, …) et les métriques basées sur la localisation (surface sous la courbe, selon différentes implémentations). Par conséquence, assurer une évaluation objective et une comparaison entre les modèles les plus modernes reste un défi.
Enfin, les particularités du SVH sont déjà déployées avec succès en tant qu’outil d’optimisation de tatouage, comme par exemple l’adaptation perceptive au contenu (preceptual shaping), le masquage perceptuel, les mesures de qualité inspirées par la biologie. Malgré que la saillance visuelle ait déjà prouvé son efficacité dans le domaine compressé, aucune application de tatouage utilisant la carte de saillance comme outil d’optimisation n’a été présentée avant le début de cette thèse.
Les contributions
La thèse présente les contributions suivantes.
Cadre méthodologique de l’extraction de la saillance visuelle à partir du flux compressé
La détection automatique de la saillance visuelle est un domaine de recherche particulier. Son arrière-plan fondamental (neurobiologique) est représenté par les travaux de Treisman avançant la théorie de l’intégration pour le système visuel humain et par ceux de Koch et al. mettant en évidence un mécanisme de sélectivité temporelle de l’attention humaine. D’un point de vue méthodologique, toutes les études publiées dans la littérature suivent une approche expérimentale inhérente: certaines hypothèses sur la façon dont les caractéristiques neurobiologiques peuvent être (automatiquement)
Résumé
21
calculées à partir du contenu visuel sont d’abord formulées puis validées par des expériences. On peut donner ainsi comme exemple l’étude d’Itti [ITT98] qui a été cité, selon scholar google, environ 7000 fois.
Dans ce cadre, la contribution de la thèse n’est pas de proposer une nouvelle approche, mais à contrario, de démontrer méthodologiquement la possibilité de lier les éléments de syntaxe des flux MPEG-4 AVC et HEVC à la représentation mathématique originale d'Itti. Il est ainsi mis en évidence que les normes de compression les plus efficaces aujourd’hui (MPEG-4 AVC et HEVC) conservent toujours dans leurs éléments de syntaxe les singularités visuelles auxquelles le SVH est adapté.
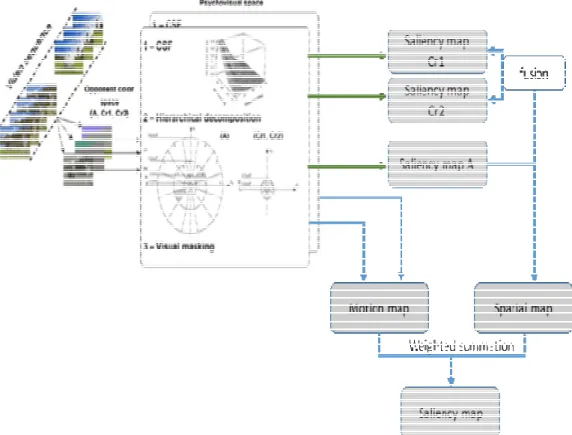
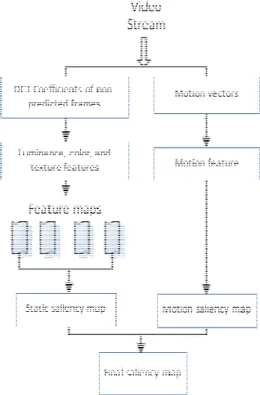
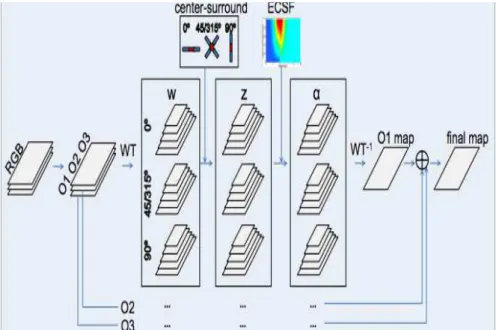
Afin de calculer la carte de saillance directement à partir des flux compressés MPEG-4 AVC / HEVC, les principes de conservation de l’énergie et de la maximisation du gradient sont conjointement adaptés aux particularités du SVH et de la syntaxe du flux MPEG. Dans ce cas, les caractéristiques statiques et de mouvement sont d’abord extraites des trames I et respectivement P. Trois caractéristiques statiques sont considérées. L’intensité est calculée à partir des coefficients luma résiduels, la couleur est calculée à partir des coefficients chroma résiduels tandis que l’orientation est donnée par la variation (gradient) des modes de prédiction intra-directionnelle. Le mouvement est considéré comme l’énergie des vecteurs de mouvement. Deuxièmement, nous calculons les cartes de saillance individuelles pour les quatre caractéristiques mentionnées ci-dessus (intensité, couleur, orientation et mouvement). Les cartes de saillance sont obtenues à partir des cartes de caractéristiques après trois étapes incrémentales : la détection des outliers, le filtrage moyenneur avec le noyau de la taille de la fovéa et la normalisation dans l’intervalle [0, 1].
Enfin, nous obtenons une carte de saillance statique en fusionnant les cartes d'intensité, de couleur et d'orientation. La carte de saillance globale est obtenue en regroupant la carte statique et celle de mouvement selon 48 combinaisons différentes de techniques de fusion.
Confrontation de la carte de saillance extraite directement à partir du flux compressé à la vérité terrain Comme nous l’avons déjà expliqué, chaque modèle d’extraction de la saillance visuelle doit être validé par une évaluation quantitative.
De ce point de vue, la principale contribution de la thèse consiste à définir un test-bed générique permettant une validation objective et une analyse comparative.
Le test-bed défini dans cette thèse est caractérisé par trois propriétés principales: (1) il permet d'évaluer les différences entre la vérité terrain et la carte de saillance par différents critères, (2) il comprend différentes typologies de mesures et (3) il assure une pertinence statistique aux évaluations quantitatives.
En conséquent, ce test-bed est structuré à trois niveaux, selon les critères d’évaluations et selon les mesures et les corpus utilisés, respectivement.
Tout d'abord, plusieurs critères d'évaluation peuvent être pris en considération. La Précision (définie comme la ressemblance entre la carte de saillance et la carte de fixation) et la Discriminance (définie comme la différence entre le comportement de la carte de saillance dans les zones de fixations et les régions aléatoires) des modèles de saillance sont considérés.
Deuxièmement, pour chaque type d’évaluation, plusieurs mesures peuvent être considérées. Notre évaluation est basée sur deux mesures de deux types différents: la KLD (divergence de Kullback Leibler), basée sur la distribution statistique des valeurs [KUL51][KUL68] et l’AUC (surface sous la courbe) qui est une mesure basée sur la localisation des valeurs.
Deux corpus sont considérés: (1) le corpus dit de référence organisé par [WEB05] à IRCCyN et (2) le corpus dit d’étude comparative organisé par [WEB06] au CRCNS. Ces deux corpus sont sélectionnés selon leurs compositions (diversité du contenu et disponibilité de la vérité terrain en format compressé), leurs représentativités pour la communauté de la saillance visuelle ainsi que leurs tailles. Une attention particulière est accordée à la pertinence statistique des résultats présentés dans la thèse. À cet égard, nous considérons:
� Pour les deux critères d’évaluation, la Précision et la Discriminance, chaque valeur de KLD et d’AUC est présenté avec sa moyenne, ses valeurs minimales et maximales, et l’intervalle de confiance à 95% correspondant.
� Pour l'évaluation de la Discriminance, chaque expérience (c'est-à-dire pour chaque trame dans chaque séquence vidéo) est répétée 100 fois (c'est-à-dire pour 100 ensembles de localisation aléatoire). La valeur finale est moyennée sur toutes ces configurations et toutes les trames dans la séquence vidéo;
� Pour l'étude de la Précision et de la Discriminance, on a analysé la sensibilité des mesures KLD et AUC par rapport au caractère aléatoire du contenu vidéo constituant le corpus utilisé.
Ce test-bed a été considéré pour comparer notre méthode d’extraction de la carte de saillance MPEG-4 AVC contre trois méthodes de l’état de l’art. La carte de saillance HEVC a été comparée à son tour contre les mêmes trois méthodes de l’état de l’art ainsi que contre la carte de saillance MPEG-4 AVC. Les trois méthodes de l’état de l’art ont été choisies selon les critères suivants: la représentativité dans l’état de l’art, la possibilité d’une comparaison équitable et la complémentarité méthodologique.
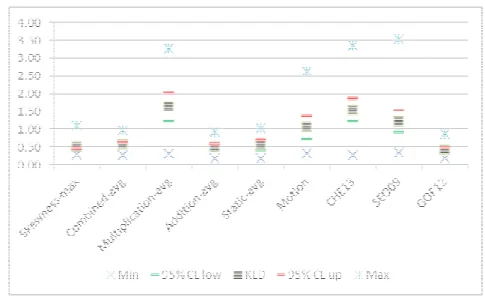
Pour illustration, les résultats de la confrontation de notre carte de saillance MPEG-4 AVC par rapport à la vérité terrain montrent des gains relatifs en KLD entre 60% et 164% et en AUC entre 17% et 21% contre les trois modèles de l’état de l’art. Pour la carte de saillance HEVC, les gains en KLD se situent entre 0,01 et 0,4 tandis que les gains en AUC se situent entre 0,01 et 0,22 contre les mêmes modèles de l’état de l’art.
Validation applicative dans une méthode de tatouage robuste
Nous étudions les avantages de l'extraction de la carte de saillance directement à partir du flux compressé lors du déploiement d'une application de tatouage robuste. En fait, en utilisant le modèle d’extraction de la saillance visuelle à partir des flux MPEG-4 AVC / HEVC comme guide pour
Résumé
23
sélectionner les régions dans lesquelles la marque est insérée, des gains de transparence (pour une quantité de données insérées et une robustesse prédéfinies) sont obtenus. La validation applicative révèle des gains de transparence allant jusqu'à 10 dB en PSNR pour les cartes de saillance MPEG-4 AVC et jusqu'à 3dB en PSNR pour les cartes de saillance HEVC (pour une quantité de données insérées et une robustesse bien définies).
En plus de sa pertinence applicative, ces résultats peuvent également être considérés comme une première étape vers une validation à posteriori de l'hypothèse de Koch : la saillance à court terme et le masquage perceptuel à long terme peuvent être considérés d’une manière complémentaire afin d’accroitre la qualité visuelle.
Comme conclusion générale, la thèse démontre que bien les normes MPEG-4 AVC et HEVC ne dépendent pas explicitement de tout principe de saillance visuelle, ses éléments syntaxiques préservent cette propriété.
La structure de la thèse
Afin d'offrir une vision méthodologique et expérimentale complète de la possibilité d'extraire les régions saillantes directement à partir des flux compressés vidéo (MPEG-4 AVC et HEVC), cette thèse est structurée comme suit.
Le chapitre I couvre les aspects introductifs et se compose de trois parties principales, liées à la saillance visuelle, au tatouage et au codage vidéo, respectivement.
Le chapitre II est consacré à l'analyse de l’état de l’art. Il est divisé en trois parties principales. Le chapitre II.1 traite les méthodes d’extraction de la saillance visuelle bottom-up et est structurée en deux niveaux : image contre vidéo et pixel contre domaine compressé. Le chapitre II.2 donne un bref aperçu sur la relation méthodologique entre les applications de tatouage et la saillance visuelle. Le chapitre II.3 concerne les applications traitant directement le domaine vidéo compressé.
Le chapitre III présente le cadre méthodologique et expérimental de l’extraction de la saillance visuelle à partir du flux compressé MPEG-4 AVC. Le chapitre VI est structuré de la même manière que le chapitre III et présente le cadre méthodologique et expérimental pour l’extraction de la saillance visuelle à partir du flux compressé HEVC.
Le dernier chapitre est consacré aux conclusions et aux perspectives.
La thèse contient cinq annexes. L’annexe A est consacrée à l'étude de la technique de fusion pour les modèles d'extraction MPEG-4 AVC et HEVC. L’annexe B donne un aperçu sur la norme MPEG-4 AVC. L’annexe C identifie les principaux éléments de nouveauté pour la norme HEVC. L’annexe D détaille les valeurs numériques des résultats données dans les chapitres III, IV et V. L’annexe E présente sous forme de graphiques les résultats présentés dans les tableaux du chapitre III.
Tableau 0-1: Extraction de la saillance visuelle à partir du domaine vidéo compressé: contraintes, défis, limitations et contributions
Contraintes Défis Limitations Contributions
Extraction de la saillance visuelle
• L’extraction de la saillance visuelle à partir des flux compressés: MPEG-4 AVC et HEVC
• Les caractéristiques de la saillance visuelle sont extraites à partir des pixels
• Spécifier un formalisme reliant le système visuel humain aux caractéristiques élémentaires des éléments de syntaxe des flux MPEG-4 AVC et HEVC • Définir des stratégies de normalisation pour les
cartes obtenues
• Etudier la fusion des cartes statiques et dynamiques pour obtenir une carte de saillance du flux compressé Evaluation des performances • Confrontation à la vérité terrain: Précision et Discriminance • Données limitées • Procédures d'évaluation variables
• Spécifier un test-bed cohérent et unitaire permettant la confrontation des cartes de saillance à la vérité terrain:
� Les critères d’évaluation :
• Précision : La ressemblance entre la carte de saillance et la carte de fixation • Discriminance : La différence entre le
comportement de la carte de saillance dans les régions de fixation et les endroits aléatoires
� Typologie des mesures :
• Une métrique basée sur la distribution: le KLD implémenté en fonction de la théorie de l'information de Kullback Leibler [KUL51], [KUL68]
• Une métrique basée sur l'emplacement: AUC
� Des corpus différents :
• Le corpus de référence organisé par IRCCyN [WEB05]
• Le corpus de l’analyse comparative organisé by Itti [WEB06]
� Pertinence statistique :
• Précision et Discriminance : valeurs expérimentales présentées aves leurs moyennes, min, max et intervalle de confiance à 95%.
• Discriminance: Processus de calcul de la moyenne supplémentaire sur les testes aléatoires répétées;
• Précision et Discriminance: Évaluation de la sensibilité des mesures par rapport au caractère aléatoire du contenu visuel. Intégration dans l’application de tatouage • Garder les caractéristiques de l’application tout en diminuant le coût de calcul. • Pas de validation d’une carte de saillance dans une application dans le domaine compressé
• Démontrer la possibilité d’intégration de la carte de saillance du flux compressé dans une application de tatouage pour guider l’insertion de la marque. • Améliorer de la transparence de la méthode de
tatouage, à une robustesse et une quantité de données préservées, tout en réduisant le coût de calcul.
Abstract
25
Context
Ten years from now on, would y would your eyes first pick-up fro
By 2020, 82% of the world's Inter Early 1980s, computers became Late 1980s and during the 1990 before. They considered multim delivering information not only u Over the years, multimedia tech part of our intimate, professiona from scientific simulation to FIFA it or not, our first ground in profe
Figure 1: Multimedia content evolution
Nowadays, thanks to the afford broadband access, massive amo distributed. At the time of writi produced every day. Figure 2 sh Internet video content, sorted b to the second quarter of 2016. video content!
you be still reading this thesis manuscript or watc om it?
rnet traffic will be video…
relevant in enterprises, schools and homes. 0s, scientists started imagining how computers
media as a way to utilize computers in a un using text but pictures, audio, video and 3D graph hnologies and applications have gradually conque al and personal routine, Figure 1. From encyclop A gaming, the multimedia content becomes our fessional and personal social activities.
n.
dable devices (capturing, processing and storage ount of user-generated video content is instant ng, 2.5 Exabyte of video data (that is, about 90 hows the worldwide average (per user) daily time by country; the figures are reported by Statista [
Just for illustration, in France, 4.1 hours a day
Abstract
27
ching it as a video? What
could be used as never nique personal way, by hics, as well.
ered our lives, becoming pedias to cookbooks and reference and, accepting
e) and to the ubiquity of taneously produced and 0 years of HD videos) are e spent watching TV and [WEB01] and correspond y are spent for watching
Figure 2: Average daily time (in hou [WEB01].
Recording every view and ever statistics about the tendency of 6 billion videos while YouTube u food on YouTube is incredibly p they also watch videos while co backgrounds, ages, genders and
Figure 3: Consumer Internet traffic 2015
Figure 3 shows that the Internet other multimedia content. The v near future: by 2020, 82% of the
The world contains too much visua Because of its size and complexi for research studies connecting t There is a tremendous differen
urs) spent on viewing TV/video content worldwide duri
ry sign up of social media users come across the video usage, [WEB02] and Figure 3. Every da users spend 46000 years watching videos. “How popular, with 419 million views while 68% of m
ooking [WEB03]. In US, over 155 million people socioeconomic statues are playing video games.
5-2019 [WEB02].
t user has a remarkable preference to watch vid video content supremacy over the Internet traffic e world's Internet traffic will be video [WEB04].
ual information to be perceived at once… ity, video content production, distribution and u the digital representation to the inner human vis ce between the image displayed on a device a
ing the second quarter 2016
with a very interesting ay, Snapchat users watch w-to” content related to millennial moms said that
e with a large variety of .
deo than consuming any c will be reinforced in the
usage increases the need sual mechanisms. and the image our brain
Abstract
29
screen and its perceived impact. Vision depends not only on the ability to perceive objects (i.e., evaluated by the ratio between their size and the distance between the eye and the screen), but also on other visual, cognitive and semantic factors.
The human visual system (HVS) has the remarkable ability to automatically attend to salient regions. It can be considered that the theoretical ground for visual saliency modeling was established some 35 years ago by Treisman [TRE80] who advanced the integration theory for the human visual system: in any visual content, some regions are salient (appealing) because of the discrepancy between their features (intensity, color, texture, motion) and the features of their surrounding areas. Soon afterwards, Koch [KOC85] brought to light a time selectivity mechanism in the human attention: in any visual content, the regions that stimulate the vision nerves are firstly picked and processed, and then the rest of the scene is interpreted. In image/video processing, the complex visual saliency mechanism is generally abstracted to a so-called saliency map. In its broadest acceptation, a saliency map is a 2D topographic map representing the regions of an image/video on which the human visual system will spontaneously focus.
Objectives
The present thesis aims at offering a comprehensive methodological and experimental view about the possibility of extracting the salient regions directly from video compressed streams (namely MPEG-4 AVC and HEVC), with minimal decoding operations.
Note that saliency extraction from compressed domain is a priori a conceptual contradiction. On the one hand, as suggested by Treisman [TRE80], saliency is given by visual singularities in the video content. On the other hand, in order to eliminate the visual redundancy, the compressed streams are no longer expected to feature singularities. Consequently, the thesis studies weather the visual saliency can be directly bridged to stream syntax elements or, on the contrarily, complex decoding and post-processing operations are required to do so.
The thesis also aims at studying the practical benefit of the compressed domain saliency extraction. In this respect, the particular case of robust video watermarking is targeted: the saliency is expected to act as an optimization tool, allowing the transparency to be increased (for prescribed quantity of inserted information and robustness against attacks) while decreasing the overall computational complexity. However, the underlying proof of concepts is still missing and there is no a priori hint about the extent of such a behavior.
State-of-the-art limitations and constraints
The thesis deals with three-folded limitations and constraints related to the methodological framework for the compressed-domain saliency map extraction, to its ground-truth validation and to its applicative integration.
First, note that several incremental studies, from still images to uncompressed video, already considered saliency maps in order to improve the performance of a large variety of applications such as processing
of rapid scenes, selective video encoding, prediction of video surveillance, rate control, and object recognition to mention but a few. Those studies cover a large area of methodological tools, from dyadic Gaussian pyramid decomposition to biologically inspired models. However, despite their wide methodological range, the existing methods still extract the salient areas from the video pixel domain. To the best of our knowledge, at the beginning of this thesis, no saliency extraction model working on video encoded domain was reported in the literature.
Secondly, from the quantitative assessment point of view, the studies reported in the literature consider different databases, of different sizes (e.g. from 8 still images to 50 video clips summing-up to 25 min) and/or relevance (density fixation maps, saccade locations, …). The matching of the obtained saliency map to the ground truth is investigated by considering particular types of measures, like the distribution-based metrics (e.g. Kullback-Leibler Divergence, Linear Correlation Coefficient, Similarity, … ) and location-based metrics (Area Under Curve, according to different implementations). Consequently, ensuring objective evaluation and comparison among and between state-of-the-art methods still remains a challenge.
Finally, the HVS peculiarities are already successfully deployed as an optimization tool in watermarking: perceptual shaping, perceptual masking, bio-inspired quality metrics stand just for some examples in this respect. Under this framework, while visual saliency already proved its effectiveness in the uncompressed domain, no study related to the possibility of using compressed domain saliency in watermarking was reported before this thesis started.
Contributions
The thesis presents the following incremental contributions. Methodological framework for stream-based saliency extraction
The automatic visual saliency detection is a particular research field. Its fundamental (neuro-biological) background is represented by the early works of Treisman, advancing the integration theory for the human visual system and by Koch et al. who brought to light a time selectivity mechanism in the human attention. From the methodological point of view, all the studies published in the literature follow an inherent experimental approach: some hypotheses about how these neuro-biological characteristics can be (automatically) computed from the visual content are first formulated and then demonstrated through experiments. Maybe the most relevant example is the seminal work of Itti [ITT98], which was cited, according to scholar Google, about 7000 times
Under this framework, the thesis contribution is not to propose yet another arbitrary hypothesis, but a contrario, to methodologically demonstrate the possibility of linking MPEG-4 AVC and HEVC stream syntax elements to the Itti’s original mathematical representation. It is thus brought to light that the most efficient to-date compression standards (MPEG-4 AVC and HEVC) still preserves in their syntax elements the visual singularities the HVS system is matched to.
Abstract
31
peculiarities. In this respect, static and the motion feature are first extracted from the I and P frames, respectively. Three static features are considered: the intensity computed from the residual luma coefficients, the color computed from the residual chroma coefficients and the orientation given by the variation (gradient) of the intra directional prediction modes. The motion feature is considered to be the energy of the motion vectors. Second, we compute individual saliency maps for the four above-mentioned features (intensity, color, orientation and motion). The saliency maps are obtained from feature maps following four incremental steps: outliers’ detection, average filtering with fovea size kernel, and normalization within the [0, 1] dynamic range. Finally, we obtain a static saliency map by fusing the intensity, color and orientation maps. The global saliency map is obtained by pooling the static and the motion maps according to 48 different combinations of fusion techniques.
Ground-truth validation for stream-based saliency extraction
As explained above, any saliency extraction methodological framework must be demonstrated through quantitative evaluation. From this point of view, the main thesis contribution consists in defining a generic test-bed allowing an objective quantitative evaluation/benchmarking.
Any saliency test-bed should be able to ensure objective evaluation of the results, i.e. to be able to accommodate any saliency map methodology, be it from the state of the art or newly advanced.
The test-bed defined in the present thesis is characterized by three main properties: (1) it allows the assessment of the differences between the ground-truth and the saliency-map based results by different criteria, (2) it includes different measure typologies and (3) it grants statistical relevance for the quantitative evaluations.
Consequently, the test-bed is structured at three nested levels, according to the evaluation criteria and to the actual measures and corpora, respectively.
First, several evaluation criteria can be considered. Both Precision (defined as the closeness between the saliency map and the fixation map) and Discriminance (defined as the difference between the behavior of the saliency map in fixation locations and in random locations) of the saliency models are considered. Secondly, for any type of evaluation, several measures can be considered. Our assessment is based on two measures of two different types (the KLD, a distribution based metric based on Kullback’s Information theory [KUL51], [KUL68] and the AUC, a location based metric according to the Borji’s implementation [WEB07]).
Two different corpora are considered and further referred to as: (1) the reference corpus organized in by [WEB05] at IRCCyN and (2) the cross-checking corpus organized in by [WEB06] at CRCNS. These two corpora are selected thanks to their composition (content diversity and ground-truth availability in compressed format), they representativeness for the saliency community as well as their size. A particular attention is paid to the statistical relevance of the results reported in the thesis. In this respect, we consider:
� for both the Precision and the Discriminance assessment, all the KLD and AUC values reported in the present thesis are presented by their average, min, max and 95% confidence limits;
is repeated 100 times (i.e. for 100 different random location sets) then averaged over all these configurations and all frames in the video sequence;
� for both the Precision and the Discriminance investigation, the sensitivity of the KLD and AUC measures with respect to the randomness of the video content representing the processed corpus is analyzed.
This test-bed was considered in order to benchmark the MPEG-4 AVC saliency map against three state-of-the-art methods; the HEVC saliency map was benchmarked against the same three state-state-of-the-art methods and MPEG-4 AVC saliency map. The three state-of-the-art methods were selected according to the following criteria: representatively in the state of the art, the possibility of fair comparison, and the methodological complementarity.
Just for illustration, the ground truth results of the MPEG-4 AVC saliency maps exhibit relative gains in KLD between 60% and 164% and in AUC between 17% and 21% against three models of the state-of-the-art. For the HEVC saliency maps gains in KLD were between 0.01 and 0.40 and in AUC between 0.01 and 0.22 against the same three models of the state-of-the-art.
Applicative validation for robust watermarking
We investigate the benefits of extracting saliency map directly from the compressed stream when designing robust watermarking applications. Actually, by using the MPEG-4 AVC/HEVC saliency model as a guide in selecting the regions in which the watermark is inserted, gains in transparency (for prescribed data payload and robustness properties) are obtained.
The applicative validation brings to light transparency gains up to 10dB in PSNR (for prescribed data payload and robustness properties) for the MPEG-4 AVC saliency maps and up to 3dB in PSNR (for prescribed data payload and robustness properties) for the HEVC saliency maps.
Besides its applicative relevance, these results can be also considered as a first step towards an a posteriori validation of the Koch hypothesis: short-time saliency and long-term perceptual masking can be complementary considered in order to increase the visual quality.
As an overall conclusion, the thesis demonstrates that although the MPEG-4 AVC and the HEVC standards do not explicitly rely on any visual saliency principle, its stream syntax elements preserve this property.
Thesis structure
In order to offer a comprehensive methodological and experimental view about the possibility of extracting the salient regions directly from video compressed streams (namely MPEG-4 AVC and HEVC), this thesis is structured as follow.
Abstract
33
Chapter I covers the Introduction aspects and is composed of three main parts, related to visual saliency, watermarking and its properties and video coding and redundancies, respectively.
Chapter II is devoted to the state-of-the-art analysis. It is divided into three main parts. Chapter II.1 deals with bottom-up visual saliency extraction and is structured according to a nested, dichotomy: image vs. video and pixel vs. compressed domain. Chapter II.2 gives as an overview about the methodological relationship between watermarking applications and visual saliency. Chapter II.3 relates to the application processing directly the compressed video domain.
Chapter III introduces the methodological and experimental visual saliency extraction directly from the MPEG-4 AVC compressed stream syntax elements. Chapter IV is paired-structured with Chapter III and presents our methodological and experimental results on visual saliency extraction from the HEVC compressed stream syntax elements.
The last Chapter is devoted to concluding remarks and perspectives
The thesis contains five appendixes. Appendix A is devoted to the fusion technique investigation for both 4 AVC and HEVC visual saliency extraction models. Appendix B gives an overview about the MPEG-4 AVC standard. Appendix C shows the novelty of the HEVC and the principle differences with respect to its predecessor. Appendix D details the numerical experimental values reported in Chapters III, IV and V. Appendix E represents as plots (graphics) the main applicative results of the objective quality evaluation in Chapter III.
Table 1: Visual saliency extraction from video compressed domain: constraints, challenges, current limitations and contributions.
Constraint Challenge Current limitations Contributions
Saliency extraction • Visual saliency extraction from the compressed stream syntax elements (MPEG-4 AVC and HEVC)
• Visual saliency features are extracted from the uncompressed stream
• Specifying a formalism connecting the human visual system to elementary features of the MPEG-4 AVC and HEVC streams syntax elements
• Defining normalization strategies for the obtained maps
• Studying the pooling of the static and the dynamic saliency maps into a final compressed stream saliency map Performance evaluations • Confrontation to the ground truth: Precision and Discriminance
• Limited data sets • Variable and
un-coherent evaluation procedures
• Specifying a coherent, unitary test-bed allowing the confrontation of the compressed stream saliency maps to the ground truth:
� Evaluation criteria:
• Precision: the closeness between the saliency map and the fixation map • Discriminance: the difference between
the behavior of the saliency map in fixation locations and in random locations � Typology of measures:
• A distribution based metric: the KLD implemented based on Kullback’s Information theory [KUL51], [KUL68] • A location based metric: the AUC
implementation made available by Borji [WEB09]
� Different corpora:
• The reference corpus organized by IRCCyN [WEB05]
• The cross-checking corpus organized by Itti [WEB06]
� Statistical relevance
• Precision and Discriminance: experimental values reported alongside with their average, min, max and 95% confidence limits;
• Discriminance: additional averaging process over repeated random test configurations;
• Precision and Discriminance: assessment of the sensitivity of the measures with the randomness of the visual content. Applicative integration (watermarking) • Preserving the application characteristics at a low computational cost • No saliency validation for compressed domain applications
• Proof of concepts for the integration of the compressed stream saliency map into a watermarking application to guide the watermark insertion
• Improving the transparency of the watermarking method, at preserved robustness and data payload properties, while reducing the computational cost
35
The present thesis is placed at the confluence of visual saliency, watermarking and video compression. Consequently, the present chapter introduces the basic concepts related to these three realms and identifies two a priori mutual contradictions among and between their concepts.
The first contradiction corresponds to the saliency extraction from the compressed stream. On the one hand, saliency is given by visual singularities in the video content. On the other hand, in order to eliminate the visual redundancy, the compressed streams are no longer expected to feature singularities.
The second contradiction corresponds to saliency guided watermark insertion in the compressed stream. On the one hand, watermarking algorithms consist on inserting the watermark in the imperceptible features of the video. On the other hand, lossy compression schemes try to remove as much as possible the imperceptible data of video. The thesis will subsequently be structured around these two contradictions.
By its very objective (visual sali watermarking applications), th watermarking and video comp concepts related to these three them.
I.1. Saliency c
The Human Visual System (HVS) complementarities between its brain). The eye receives physica signals to the brain, which interp
I.1.1. B
The human eye is one of the m advanced visual capabilities, it in Figure I-1:
• the sclera, which mainta • the choroid, which provi
lens;
• the retina, which allows
Figure I-1: Human eye anatomy.
iency extraction from compressed stream and he present thesis is placed at the conflue pression. Consequently, the present section w e realms and will state the conceptual relationsh
context
) allows us to see, organize and interpret our en s major sensory organ (the eye) and the centr
al stimuli in the form of light and sends those prets them as images [WEB09].
Biological basis for visual p
most complicated structures on earth [WEB10 ntegrates many components, structured on thre
ains, protects, and supports the shape of the eye ides oxygen and nourishment to the eye and inc
us to pack images together and includes cones a
Introduction
37
its subsequent usage in ence of visual saliency, will introduce the basic hip among and between
nvironment thanks to the ral nervous system (the e stimuli as bio-electrical
perception
0]. In order to allow our ee major layers [WEB08],
and includes the cornea; cludes the pupil, iris, and
The information perceived by the retina is subsequently converted as nerve signals and conducted to the brain by the optic nerves. Then, the visual cortex analyses the received stimulus and develops visual perception.
It is commonly accepted that human vision is neurobiologically based on four different physical realms [TRE80]. First, the rods in retina are sensitive to intensity of the light radiations. Secondly, the cones in retina are sensitive to color contrast (the differences in the wave length corresponding to the spatially adjacent areas). Thirdly, the cortical selective neurons are sensitive to luminance contrast along different orientations (i.e. the difference in the luminance corresponding to the angular directions in a given area). Finally, the magnocellular and koniocellular pathways are sensitive to temporal differences and mainly involved in motion analysis.
However, vision depends not only on the ability to perceive objects assessed by the ratio between their size and the distance between the eye and the screen, but also on other visual, cognitive or semantic factors.
I.1.2. Image processing oriented vision
modeling
Modeling the visual perception has gradually become a major issue. Take the example of a high quality video that needs to be distributed and transferred through the Internet. To provide both a smaller version for bandwidth and keep appealing visual quality, the HVS peculiarities should be exploited. In this respect, perceptual masking and saliency maps are two different approaches commonly in use in image/video processing.
Perceptual masking
Perceptual masking is a neurobiological phenomenon occurring when the perception of one stimulus (a spatial frequency, temporal pattern, color composition … etc.) is affected by the presence of another stimulus, called a mask [BEL10].
In image processing, perceptual masking describes the interaction between multiple stimuli; in this respect, the perceptual characteristics of human eye are modeled by three filters denoted by T, L and C and representing the susceptibility artifacts, the luminance perception, and contrast perception, respectively.
The perceptual mask was obtained by first sub-sampling the Noorkami [NOO05] matrix and further adapted to take into consideration the amendments introduced in the compressed stream integer DCT transformation. A value in the matrix represents the visibility threshold, i.e. the maximal value of a distortion added on a pixel (classical) DCT coefficient which is still transparent (imperceptible) for a human observer.
Introduction
39
an improvement of this model was made by Watson [WAT97] which redefines quantization thresholds taking into consideration the local luminance and the contrast by setting a specific threshold to each one.
Sensitivity to artifacts (T)
The T filter is the sensitivity of the human vision to the artifacts. This filter is defined as the perception of distortions from a well determined threshold.
In each domain and according to each study [WAT97][PET93][AHU92][BEL10], a table has been defined as a filter of the sensitivity to artifacts. This table is defined as a function of some parameters such as image resolution and the distance between the observer and the image. Each value in this table represents the smallest value of the DCT coefficient in a perceptible block (without any noise). Thus, the smaller the value is, the more sensible is our eye to a given frequency.
Luminance perception (L)
The L filter is the luminance perception. It consists of theobject perception compared to the luminance average of the entire image [WAT97].
The luminance masking means that, if the average intensity of a block is brighter, a DCT coefficient can be changed by a larger quantity before being noticed. The most brilliant region in a given image can absorb more variation without being noticeable.
Contrast perception (C)
The C filter is the contract perception. It is the perception of an object relative to another object.
The contrast masking, which means the reduction of the visibility of change in a frequency due to the energy present therein, results in a masking thresholds. The final thresholds estimate the amounts by which the individual terms of the DCT block can be changed before resulting in a JND (Just Noticeable Distortion) [WAT97].
Perceptual masking and compressed stream
Thanks to both its methodological and applicative interest, the topic of adapting the perceptual masking to the compressed stream particularities has been of continuous interest during the last two decades. The study in [WAT97] reports on a masking matrix derived for compression domains based on the classical 8x8 DCT (e.g. JPEG or MPEG-2). This model served as basis for a large variety of compression and watermarking-oriented optimization studies [VER96], [CAB11].
Belhaj et al. [BEL10] comes across with a new perceptual mask matched to the MPEG-4 AVC stream; in this respect, the basic [WAT97] model is adapted so as to take into account the three main AVC peculiarities related to the DCT computation: (1) it is no longer applied to 8x8 blocks but to 4x4 blocks; (2) it is computed in integers, and (3) it is no longer applied to pixels but to inter/intra prediction errors.

![Figure II-11: Workflow of the saliency model [ZHA06]: the saliency map is obtained through a dynamic fusion of the static and](https://thumb-eu.123doks.com/thumbv2/123doknet/14536752.724183/59.892.145.745.823.1044/figure-workflow-saliency-saliency-obtained-dynamic-fusion-static.webp)