RESEARCH OUTPUTS / RÉSULTATS DE RECHERCHE
Author(s) - Auteur(s) :
Publication date - Date de publication :
Permanent link - Permalien :
Rights / License - Licence de droit d’auteur :
Bibliothèque Universitaire Moretus Plantin
Institutional Repository - Research Portal
Dépôt Institutionnel - Portail de la Recherche
researchportal.unamur.be
University of Namur
Inter-laboratory study on the detection of bovine processed animal protein in feed by
LC-MS/MS-based proteomics
Lecrenier, Marie Caroline; Marien, Aline; Veys, Pascal; Belghit, Ikram; Dieu, Marc; Gillard,
Nathalie; Henrottin, Jean; Herfurth, Uta M.; Marchis, Daniela; Morello, Sara; Oveland,
Eystein; Poetz, Oliver; Rasinger, Josef Daniel; Steinhilber, Andreas; Baeten, Vincent; Berben,
Gilbert; Fumière, Olivier
Published in:
Food Control
DOI:
10.1016/j.foodcont.2021.107944
Publication date:
2021
Document Version
Publisher's PDF, also known as Version of record
Link to publication
Citation for pulished version (HARVARD):
Lecrenier, MC, Marien, A, Veys, P, Belghit, I, Dieu, M, Gillard, N, Henrottin, J, Herfurth, UM, Marchis, D, Morello,
S, Oveland, E, Poetz, O, Rasinger, JD, Steinhilber, A, Baeten, V, Berben, G & Fumière, O 2021, 'Inter-laboratory
study on the detection of bovine processed animal protein in feed by LC-MS/MS-based proteomics', Food
Control, vol. 125, 107944. https://doi.org/10.1016/j.foodcont.2021.107944
General rights
Copyright and moral rights for the publications made accessible in the public portal are retained by the authors and/or other copyright owners and it is a condition of accessing publications that users recognise and abide by the legal requirements associated with these rights. • Users may download and print one copy of any publication from the public portal for the purpose of private study or research. • You may not further distribute the material or use it for any profit-making activity or commercial gain
• You may freely distribute the URL identifying the publication in the public portal ?
Take down policy
If you believe that this document breaches copyright please contact us providing details, and we will remove access to the work immediately and investigate your claim.
UNCORRECTED
PROOF
Contents lists available at ScienceDirectFood Control
journal homepage: http://ees.elsevier.com
Inter-laboratory study on the detection of bovine processed animal protein in feed by
LC-MS/MS-based proteomics
Marie-CarolineLecrenier
a,∗, AlineMarien
a, PascalVeys
a, IkramBelghit
b, MarcDieu
c, NathalieGillard
d,
JeanHenrottin
d, Uta M.Herfurth
e, DanielaMarchis
f, SaraMorello
f, EysteinOveland
b, OliverPoetz
g,h,
Josef DanielRasinger
b, AndreasSteinhilber
g, VincentBaeten
a, GilbertBerben
a, OlivierFumière
aaWalloon Agricultural Research Centre (CRA-W), Department Knowledge and Valorisation of Agricultural Products, European Union Reference Laboratory for Animal Proteins in Feedingstuffs
(EURL-AP), Chaussée de Namur 24, 5030, Gembloux, Belgium
bInstitute of Marine Research (IMR), Norwegian National Reference Laboratory for Animal Proteins in Feedingstuffs (NRL-AP), P.O. Box 1870, Nordnes, 5817, Bergen, Norway cUniversity of Namur (UNamur), MaSUN Mass Spectrometry Facility, Rue de Bruxelles 61, 5000, Namur, Belgium
dCER Groupe, Health Department, Rue Du Point Du Jour 8, 6900, Marloie, Belgium
eGerman Federal Institute for Risk Assessment (BfR), Department Food Safety, German National Reference Laboratory for Animal Proteins in Feed (NRL-AP), Max-Dohrn-Strasse 8-10, 10589,
Berlin, Germany
fIstituto Zooprofilattico Sperimentale Del Piemonte, Liguria e Valle D'Aosta (IZSTO), Italian National Reference Laboratory for Animal Proteins in Feedingstuffs (NRL-AP), Via Bologna 148,
10154, Torino, Italy
gSIGNATOPE GmbH, Markwiesenstrasse 55, 72770, Reutlingen, Germany
hNMI Natural and Medical Sciences Institute at the University of Tuebingen, Markwiesenstrasse 55, 72770, Reutlingen, Germany
A R T I C L E I N F O
Keywords Animal by-products Mass spectrometry LC-MS/MS ESI Proteomics Animal feed Feed control Feed banA B S T R A C T
Since the beginning of the feed ban regarding the use of processed animal protein (PAP) in feedstuffs, one of the main challenges has been to develop methods to detect and identify the type and origin of PAP or animal products. By now, in the context of a controlled relaxation of the ban, complementary methods are sought to characterize the product when positive responses are delivered by current official methods, with special attention on feed materials (whether or not authorized) originating from ruminants. Liquid chromatography-tandem mass spectrometry (LC-MS/MS)-based proteomics was identified as the most promising method to meet this challenge. This study presents the first inter-laboratory test constructed to evaluate and compare the LC-MS/MS methods currently developed in six different laboratories from four countries. Nine samples consisting of blank feed matrix or feed adulterated with bovine processed animal proteins and/or milk products were analyzed using in-house protocols and the results obtained were discussed. This study confirms the potential of LC-MS/MS-based pro-teomics to resolve the current analytical gaps in the detection and differentiation of PAP and highlights the tech-nical challenges that need to be addressed in future.
1. Introduction
PAP is defined by the European Commission (2011) as animal protein derived entirely from Category 3 material, which has been treated to render them suitable for direct use as feed material, organic fertilizers or soil improvers. This definition includes both blood meal and fishmeal but excludes blood products, milk products, colostrum products, gelatin, collagen, egg products, hydrolyzed proteins, dicalcium phosphate and tricalcium phosphate. In practice, PAPs look like meal and are produced by heat treatment under high temperature and pres-sure in a kind of “carcass soup” made up of, among other things, bone, cartilage, muscle, blood and fat.
Official control of the use of PAP in feedstuffs is based on two an-alytical methods, light microscopy (LM) and polymerase chain reaction
(PCR), which are combined according to the feed destination (Euro-pean Commission, 2009). With the relaxing of the feed ban, comple-mentary analytical methods must be developed to support the forthcom-ing liftforthcom-ing of the feed ban. In a previous publication, Lecrenier et al. (2020) highlighted the analytical gaps that exist, the possible scenarios for future operational schemes, and the new expected challenges that should be associated. Complementary methods need to bridge these gaps by making an accurate distinction between authorized feed materials and non-authorized ones when current official methods deliver positive results. In particular, the joint discrimination of the type of tissues (e.g. dairy products vs PAP) and the species or taxonomic origin (e.g. rumi-nant vs porcine) is required.
Liquid chromatography-tandem mass spectrometry (LC-MS/ MS)-based proteomics is a promising approach to fill the analytical gaps
∗Corresponding author.
E-mail address: m.lecrenier@cra.wallonie.be (M-C Lecrenier)
https://doi.org/10.1016/j.foodcont.2021.107944
Received 27 November 2020; Received in revised form 25 January 2021; Accepted 27 January 2021 Available online xxx
UNCORRECTED
PROOF
M-C Lecrenier et al. Food Control xxx (xxxx) xxx-xxx
with respect to animal by-products in feedingstuffs (Lecrenier et al., 2020). MS-based proteomics has the advantage of providing informa-tion about both the type of protein and the species through the selec-tion of specific peptide targets. Moreover, the use of a multi-targeted MS strategy, aimed at testing several protein markers, allows the de-tection and identification of different ingredients in a single analysis. In recent years, interest in determining the origin of PAP using this technology has grown exponentially (Belghit et al., 2019; Lecrenier et al., 2016, 2018; Marbaix et al., 2016; Marchis et al., 2017; Niedzwiecka et al., 2018; Rasinger et al., 2016; Steinhilber et al, 2018a, 2018b, 2019). Consequently, different approaches and pro-tocols varying in terms of sample preparation propro-tocols, choice of MS equipment and analytical strategies, respectively were developed.
The objective of the present inter-laboratory study was to assess the performance of LC-MS/MS methods already developed in different labo-ratories from both public and private sectors. Each participating labora-tory applied their own LC-MS/MS-based proteomic method. The sample set consisted of blank feed or feed adulterated with bovine PAP and/or milk product at various concentration levels.
2. Materials
2.1. Feed and feed material
The feed matrix used was commercial pig feed intended for sow feed-ing (Table 1). Its labellfeed-ing indicated that it was composed of wheat mid-dlings, wheat, barley, rice, maize, rapeseed meal, sugar beet pulp, soy-bean meal, calcium carbonate, lard, salt, premix, dicalcium phosphate and amino acids. PCR and LM analyses confirmed that the feed was free of ruminant DNA and free of terrestrial animal particles, respec-tively. The protein content was estimated at 14.1% (w/w) based on ni-trogen content, determined in duplicate by the Kjeldahl method (ISO 8968-1, 2014), and using the nitrogen-to-protein conversion factor of 6.25 (Jones, Munsey, & Walker, 1942).
Two different PAPs and one milk powder were used as adulterant materials. Bovine PAP-1 was a commercial feed material. PCR and LM analyses showed that it contained ruminant DNA and terrestrial parti-cles (bone and muscle), respectively (Table 1). Its sediment fraction was 62% (w/w) and the protein content was estimated at 49.5% (w/ w). Bovine PAP-2 was produced in a pilot plant with about 50% (w/ w) bone, 20% (w/w) meat and fat and 10% (w/w) blood. PCR and LM analyses showed that it contained ruminant DNA and terrestrial animal
particles (bone, muscle and blood), respectively. Its sediment was at 53% (w/w) and the protein content was estimated at 35.4% (w/w).
The milk product originated from a commercial calf milk replacer predominantly composed of skimmed milk powder and whey powder. PCR and LM analyses showed that this product contained ruminant DNA, but no bone or muscle particles, respectively (Table 1). The pro-tein content was estimated at 21.8% (w/w).
2.2. Sample preparation
Nine different test materials were prepared for the study (Table 1). Three reference samples (samples #1, #2 and #3) were included in the set and their content was communicated to the participants. Laborato-ries were free to use these references to develop or optimize their meth-ods and no results were required at this stage. One quality control (QC), sample #4, was included as positive control and its composition was also communicated. Data obtained on this sample had to be listed in the result file but without interpretation as the sample was not blind. Finally, five blind samples (samples #5, #6, #7, #8 and #9) with or without adulteration at levels from 1%, up to 5% (w/w) completed the sample set. Results obtained on these samples were used to evaluate the different MS methods.
Adulterated samples were prepared by stepwise dilutions. To ensure homogeneity, in final step, all samples except sample #2 were ground with an Ultra Centrifugal rotor Mill ZM 200 (Retsch, Haan, Germany) in combination with a sieve of 2 mm mesh size. The blank matrix was prepared and conditioned first in order to avoid any contamination by the other samples. QC and blind samples were characterized by LM and PCR and results were in accordance with the sample composition. Based on the known composition of the samples, the presence or absence of prohibited ruminant by-products was determined for each blind sample (Table 1).
3. Study organization
Each participant was assigned a unique identifier (“Lab 1 to 6”) to keep the results anonymous. Each Lab received about 50 g of each ref-erence sample and about 5 g of QC and blind samples. The organizer endorsed the grinding and homogeneity of the samples. Nevertheless, participating laboratories were solely responsible to reach appropriate homogeneity for the sample sub-portions taken for analysis.
A protected Excel file containing a report form and instructions on how to fill it was sent to the participants together with the samples.
Table 1
Sample set composition and results obtained by official methods (LM and PCR). Sample
# Composition LM results PCR results Prohibited ruminant by-products Sediment (bone) Flotate (muscle) Ruminant
Terrestrial Fish
0 Bovine PAP-2 + - + + +
1 Bovine PAP-1 + - + + +
2 Milk product - - - +
-3 Pig feed - - - -
-4 QC (Pig feed + 5% Bovine PAP-1 + 1% Milk product) + - + + +
5 Pig feed + 1% Bovine PAP-1 + - + + +
6 Pig feed + 1% Bovine PAP-2 + - + + +
7 Pig feed + 5% Milk product - - - +
-8 Pig feed + 1% Bovine PAP-1 + 1% Milk product + - + + +
9 Pig feed (Blank) - - - -
-Legend: Flotate, solid phase of the sedimentation made of the floating material in trichloroethylene; LM, Light microscopy; PAP, processed animal protein; PCR, polymerase chain reaction; QC, quality control; +, presence of animal particles, ruminant DNA or prohibited ruminant by-products; -, absence of animal particles, ruminant DNA or prohibited ruminant by-products. Sample #0 was not sent to participant as such but was used to prepare sample #6. Samples sent blind to the participants are in bold. Concentrations are expressed as weight-weight (w/ w) percentage (%).
UNCORRECTED
PROOF
Based on the results obtained for the targeted peptides and individualevaluation criteria, laboratories had to make a conclusion on the pres-ence or abspres-ence of prohibited ruminant by-products in the blind sam-ples.
4. Methods
Six laboratories analyzed the samples using their own in-house LC-MS/MS-based proteomic approach. The applied methods used were based on recent publications (Belghit et al., 2019; Lecrenier et al., 2016, 2018; Marchis et al., 2017; Niedzwiecka et al., 2018; Stein-hilber et al., 2019). Major differences between methods are summa-rized in Tables 2–5.
4.1. Sample preparation
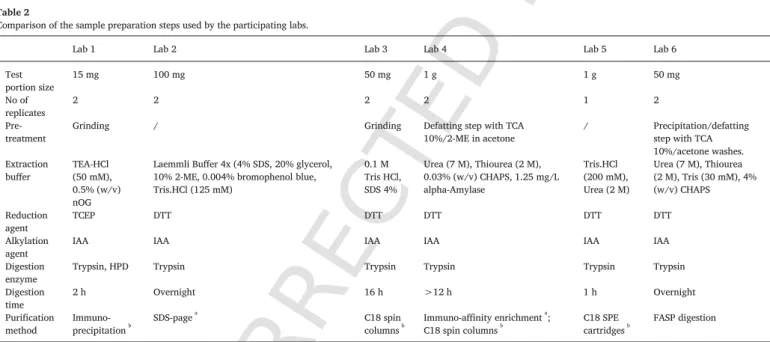
Table 2 summarizes the major differences observed in the sample preparation protocols used by the participating laboratories. Test por-tion size ranged from 15 mg up to 1 g of sample. All the laboratories performed the analyses in technical duplicates, except for Lab 5 that analyzed only one test portion of each sample. Labs 2 and 5 did not pre-treat the samples before extraction, whereas Labs 1 and 3 included an additional grinding step. Lab 1 ground a larger subsample before weighing the test portions in order to ensure a good homogenization. Labs 4 and 6 primarily defatted the samples by using a buffer contain-ing trichloroacetic acid (TCA) and acetone. Each lab used a different extraction buffer, but the reduction and alkylation agents were similar, except for Lab 1 that used another reduction agent. The tryptic diges
Table 2
Comparison of the sample preparation steps used by the participating labs.
Lab 1 Lab 2 Lab 3 Lab 4 Lab 5 Lab 6
Test
portion size 15 mg 100 mg 50 mg 1 g 1 g 50 mg
No of
replicates 2 2 2 2 1 2
Pre-treatment Grinding / Grinding Defatting step with TCA10%/2-ME in acetone / Precipitation/defattingstep with TCA 10%/acetone washes. Extraction
buffer TEA-HCl(50 mM), 0.5% (w/v) nOG
Laemmli Buffer 4x (4% SDS, 20% glycerol, 10% 2-ME, 0.004% bromophenol blue, Tris.HCl (125 mM) 0.1 M Tris HCl, SDS 4% Urea (7 M), Thiourea (2 M), 0.03% (w/v) CHAPS, 1.25 mg/L alpha-Amylase Tris.HCl (200 mM), Urea (2 M) Urea (7 M), Thiourea (2 M), Tris (30 mM), 4% (w/v) CHAPS Reduction agent TCEP DTT DTT DTT DTT DTT Alkylation
agent IAA IAA IAA IAA IAA IAA
Digestion
enzyme Trypsin, HPD Trypsin Trypsin Trypsin Trypsin Trypsin Digestion
time 2 h Overnight 16 h >12 h 1 h Overnight
Purification
method Immuno-precipitationb SDS-page a
C18 spin
columnsb Immuno-affinity enrichment a
;
C18 spin columnsb C18 SPE
cartridgesb FASP digestion
Legend: 2-ME, 2-mercaptoehtanol; CHAPS, 3-[(3-cholamidopropyl) dimethylammonio]-1-propanesulfonate; DTT, dithiothreitol; IAA, iodoacetamide; FASP, filter aided sample prep; HCl, hydrogen chloride; HPD, heterogeneous phase digestion; No, number; nOg, n-octylglucoside; SDS, sodium dodecyl sulfate; SPE, solid-phase extraction; TCA, trichloroacetic acid; TCEP, tris (2-carboxyethyl) phosphine; TEA, triethanolamine.
a Applied prior to digestion. b Applied after digestion.
Table 3
Comparison of the liquid chromatography (LC) and Mass spectrometer (MS) system used by the participating labs and the main parameters.
Lab 1 Lab 2 Lab 3 Lab 4 Lab 5 Lab 6
LC system UltimateTM3000 nano RSLC
(Thermo Fisher Scientific) ExionLC
TM
system (SCIEX) Vanquish
TMHorizon binary UHPLC
(Thermo Fisher Scientific) nanoHPLC (AgilentTechnologies) UPLC
TMAcquity
system (Waters) NanoElute ®(Bruker) Gradient
time (min) 10 15 15 74 16 40
MS system Q-ExactiveTMPlus (Thermo
Fisher Scientific) QTRAP
TM5500
System (SCIEX) Q-Exactive
TMOrbitrap (Thermo
Fisher Scientific) maXis
TM(Bruker) Xevo ® TQ-S micro
(Waters) Tims TOF
TM
Pro (Bruker) Acquisition
mode PRM MRM PRM DDA withinclusion list MRM DDA
Ionization
mode ESI positive ESI positive ESI positive ESI positive ESI positive ESI positive Legend: DDA, Data-dependent acquisition mode; ESI, electrospray ionization; LC, liquid chromatography; MRM, multiple reaction monitoring; MS, mass spectrometry; PRM, parallel reac-tion monitoring.
UNCORRECTED
PROOF
M-C Lecrenier et al. Food Control xxx (xxxx) xxx-xxx
Table 4
List of the peptide sequences used by the participating labs and the targeted tissue/product.
Protein Peptide Lab 1 Lab 2 Lab 3 Lab 4 Lab 5 Lab 6
Alpha-2-Macroglobulin GSGGTAEHPFTVEEFVLPK Blood
Alpha-2-Antiplasmin LPPLSLLK Blood
Protein HP-25 homolog 2 FGFDIELFQHAVK Blood Complement Component 9 YTPVEAIEK Blood
Myosin-7 MLSSLFANYAGFDTPIEK Muscle
Osteopontin YPDAVATWLKPDPSQK Bone/Milk
Matrilin-1 AGGIELFAIGVGR Cartilage
Desmin TSGGAGGLGALR Muscle
Vimentin TLYTSSPGGVYATR Muscle
Myoglobin YLEFISDAIIHVLHAK Muscle
Hemoglobin alpha-chain VGGHAAEYGAEALER Blood Blood Blood Blood Hemoglobin beta-chain AAVTAFWGK Blood Blood Blood Blood
EFTPVLQADFQK Blood Blood Blood Blood
VVAGVANALAHR Blood Blood Blood
Collagen alpha-2 (I) GEPGPAGAVGPAGAVGPR Bone/Tendon
Casein alpha-S1 FFVAPFPEVFGK Milk Milk
HQGLPQEVLNENLLR Milk Milk
YLGYLEQLLR Milk
Casein alpha-S2 NAVPITPTLNR Milk Milk Milk
Beta-lactoglobulin LSFNPTQLEEQCHI Milk
VLVLDTDYK Milk Milk Milk
VYVEELKPTPEGDLEILLQK Milk Milk
Table 5
Comparison of the evaluation criteria applied by the participating labs.
Lab 1 Lab 2 Lab 3 Lab 4 Lab 5 Lab 6
To detect and identify the peptide RT identical to IS ( ±1 s) Qualifier ion > LLOQ (CV = ±20%, CV = ±25% at LLOQ) Specificity of antibody Ion ratios similar to IS ≥3 product ions detected RT similar to ref samplea S/N > 3 for all product ions Ion ratios similar to ref samplea RT similar to IS ( ±0.07 min) Product ions < 3 ppm mass error S/N > 3 for all product ions ≥3 product ions detected ≥1 product ion is a y-ion type ≥1 peptide identified
Peptide Mascot score ≥ 39.0 RRT similar to ref sample
a
S/N > 10 for quantifier ion Ion ratios similar to ref samplea
RT and IM closed to QC sample Product ions < 5 ppm error Peptide Mascot score ≥ identity score Peptide threshold 1% FDR To conclude on the presence of the targeted by-product CV of the ratio between quantifier ion and IS intensity ≤20% ≥2 process IS identified IS identified ≥1 peptide identified ≥1 peptide
identified ≥1 peptide identified in bothreplicates. If results differ, bovine Hb considered to be present, if detected in a 3rd replicate
≥2 peptides identified (including AAVTAFWGK for bovine Hb, and FFVAPFPEVFGK for Milk or
LSFNPTQLEEQCHI if casein is not main milk source
≥1 peptide identified
Legend: CV, coefficient of variation; FDR, false discovery rate; Hb, hemoglobin; IM, ion mobility; IS, internal standard; LLOQ, lower limit of quantification; ppm, part per million; QC, quality control; ref sample, reference sample; RRT, relative retention time; RT, retention time; S/N, signal to noise ratio.
a RT or ion ratio tolerances described by European Commission (2002).
tion time varied between the laboratories: Labs 1 and 5 had a rapid digestion step ranging from 1 to 2 h, while the other labs performed the digestion for more than 12 h. A last important distinction among the methods relates to purification and enrichment. Lab 1 used an immuno-affinity enrichment technique (peptide immunoprecipitation) and Labs 3 and 5 used C18 solid phase extraction (SPE) cartridges. Lab 4 combined an immuno-affinity enrichment technique (protein im-muno-affinity) and a C18 SPE using spin columns. Lab 2 performed SDS-polyacrylamide gel electrophoresis (SDS-PAGE) and Lab 6 carried out the reduction, alkylation, and digestion in ultrafiltration filters by
a filter-aided
sample preparation (FASP) (Distler, Kuharev, Navarro, & Tenzer, 2016).
4.2. LC-MS/MS
The LC-MS/MS systems applied by the participants are presented in Table 3. All laboratories worked with ultra-high-pressure liquid chro-matography (UHPLC), except for Lab 4 that used high-pressure liquid chromatography (HPLC). Labs 2, 3 and 5 used conventional internal di-ameter columns of 2.1 mm whereas Labs 1, 4 and 6 worked with nano
UNCORRECTED
PROOF
columns. Labs 1, 2, 3 and 5 applied a short gradient time (≤16 min),while Labs 4 and 6 had a longer gradient time ≥ 40 min.
Two classes of MS instruments were used by the laboratories: (i) high-resolution mass spectrometers (HRMS) with quadrupole-orbitrap (Q-Orbitrap) or quadrupole-time-of-flight (Q-TOF) used by Labs 1, 3, 4, and 6 and (ii) low-resolution mass spectrometer (LRMS) with triple quadrupole (triple-Q) used by Labs 2 and 5. Differences can also be ob-served in the acquisition mode: Parallel reaction monitoring (PRM) for Labs 1 and 3, multiple reaction monitoring (MRM) for Labs 2 and 5 and data-dependent acquisition (DDA) for Labs 4 and 6. In summary, the lab-oratories can be separated in three groups based on their MS approach: LRMS with MRM mode (Labs 2 and 5), HRMS with PRM mode (Labs 1 and 3) and HRMS with DDA mode (Labs 4 and 6).
Table 4 lists the peptide sequences (and the protein from which they origin) used in this study. The targeted bovine tissues or products (i.e., blood, muscle, bone, cartilage, tendon and milk) were identified for each peptide. Lab 1 designed its set with plasma, muscle, bone and cartilage peptides. The selected bone peptide is also present in milk products. Lab 2 has focused its method on muscle peptides. The four other labs (Labs 3, 4, 5 and 6) have chosen comparable sets of hemoglobin peptides, supplemented by milk peptides for Labs 3, 5 and 6 and a bone/tendon marker for Lab 6.
4.3. Criteria for interpretation of the results
The last major parameter of variation concerns the interpretation of the results. Table 5 summarizes the criteria used by each lab to evalu-ate the MS data and to deliver a conclusion on the presence or absence of the targeted by-product. Regarding the identification and detection of the peptides, criteria were similar for a same cluster in acquisition mode (MRM/PRM or DDA). However, an important difference was the num-ber of identified peptides requested to conclude on the presence of the related by-product. Some laboratories concluded on the identification of by-products with at least one protein marker whereas Lab 5 sets its cri-teria to a minimum of two peptides.
5. Results and discussion
Individual results are summarized in Supplementary Table 1–6. Table 6 summarizes each participating laboratory's conclusion on their findings. Erroneous results are marked with an asterisk.
The overall results, expressed in terms of global accuracy confirm the suitability of the mass spectrometric approaches for the detection of bovine PAP. The percentage of total error only accounted for 16.5% of the total responses. There are no false positive results for the detec-tion of prohibited ruminant by-products. However, bovine PAPs, when present in the samples, were not always detected. Labs 1, 5 and 6 had no false negative results. Labs 2 and 3 showed one false negative result (sample #8) and Lab 4 had three false negative results (samples #5, #6
Table 6
Summary of the labs conclusion on the presence of prohibited ruminant by-products in blind samples.
Sample
# Adulteration Lab1 Lab2 Lab 3 Lab 4 Lab 5 Lab 6
5 1% PAP-1 + + + -* + + 6 1% PAP-2 + + + -* + + 7 5% Milk - - - - - -8 1% PAP-1 + 1% Milk + -* -* -* + + 9 Blank - - - - -
-Legend: PAP, processed animal protein; +, the sample contains prohibited ruminant by-products; -, the performed analyses does not allow a conclusion on the presence of pro-hibited ruminant by-products. False results are marked with an asterisk. Concentrations are expressed as weight-weight (w/w) percentage (%).
and #8). The first conclusion is that, except for sample #8, five out of six participating laboratories correctly detected bovine PAPs at the level of 1% (w/w).
To explain the results obtained by Lab 4 for samples #5 and #6, the method employed in Lab 4 was compared to those of Labs 3, 5, and 6. Even if the methods used by the laboratories listed above dif-fered in sample preparation protocols, MS instrument and the acqui-sition mode, all four laboratories targeted hemoglobin chains with a comparable set of peptides. Labs 5 and 6 used the same set of pep-tides as Lab 4, while Lab 3 used only three out of this set of four. Whereas Lab 4 did not detect any of the target peptides, Lab 3 de-tected one of them (VGGHAAEYGAEALER) in one of the two replicates of samples #5 and #6. Lab 5 detected three hemoglobin peptides (VG-GHAAEYGAEALER, AAVTAFWGK and VVAGVANALAHR) in sample #5 and four hemoglobin peptides (VGGHAAEYGAEALER, AAVTAFWGK, EFTPVLQADFQK and VVAGVANALAHR) in sample #6. Lab 6 also de-tected three hemoglobin peptides (VGGHAAEYGAEALER, EFTPVLQAD-FQK and VVAGVANALAHR) in sample #5 and four hemoglobin pep-tides (VGGHAAEYGAEALER, AAVTAFWGK, EFTPVLQADFQK and VVAGVANALAHR) in sample #6. Lab 4 further investigated the re-sults obtained by analyzing pure bovine PAP-1 (data not shown). This sample was found to be positive for bovine material based on the de-tection of two out of the set of four peptides (VGGHAAEYGAEALER and VVAGVANALAHR). Repeated analysis of the QC sample (containing PAP-1 at a much lower level) by Lab 4, once again yielded negative re-sults for all targeted peptides. This inter-laboratory comparison confirms the presence of bovine hemoglobin in PAP-1 and PAP-2 and suggests that the false negative results obtained by Lab 4 in the study is probably due to a lack of sensitivity of the method on the PAPs used. After inves-tigation, it appeared that the lack of sensitivity compared to prior tests with the method may result from a lowered LC resolution.
The results obtained by all participants on sample #5 (1% PAP-1) and sample #6 (1% PAP-2) were also compared. Labs 5 and 6 detected 100% (4/4) and 75% (3/4) of their hemoglobin markers in sample #6 and in sample #5, respectively. Similar results were also observed by Lab 1 for their blood marker peptides. Lab 3 detected only one blood peptide (VGGHAAEYGAEALER) in both samples (samples #5 and #6). Comparison of the signal intensities or peptide counts for the peptides detected in both samples revealed that signals for the blood peptides were generally higher in sample #6 than in sample #5. Muscle mark-ers (myosin-7 and myoglobin) were detected in both samples by Labs 1 and 2. The signal intensity of myosin-7 (MLSSLFANYAGFDTPIEK) and of myoglobin (YLEFISDAIIHVLHAK) was also higher in sample #6 than in sample #5. In contrast, bone markers (osteopontin and collagen al-pha-2 (I)) used by Labs 1 and 6 were detected in sample #5 and not in sample #6. In order to see whether these differences originate from the PAP's composition, these observations were compared to the results obtained by LM. Using tetramethylbenzidine-hydrogen peroxide stain-ing (European Union Reference Laboratory for Animal Proteins in feedingstuffs, 2013), PAP-2 gave a positive reaction for blood (imme-diate blue-green coloring and release of O2bubbles), while PAP-1 did
not react positively to this staining. Therefore, the blood concentration in PAP-1 is probably lower than in PAP-2. The comparison of sediment percentage indicates a higher bone content in PAP-1 than in PAP-2. LM observations thus confirms the higher blood content of PAP-2 and the higher bone content of PAP-1 that were suggested by the MS data.
Sample #8, containing 1% PAP-1 and 1% milk powder, appears to be the most complex sample as three out of six laboratories (Labs 2, 3 and 4) failed to detect PAP in it. Lab 3 detected two product ions of the peptide VGGHAAEYGAEALER in sample #8 but declared it as neg-ative because their criteria for peptide identification (≥3 product ions detected) were not met. Lab 2 did not detect any product ion in this sample. When the same PAP material (PAP-1) was used at the same con-centration in sample #5, Labs 2 and 3 could correctly detect it. Labs 1, 5 and 6 detected the presence of prohibited ruminant by-products but the comparison of the data obtained for sample #8 and sample #5
UNCORRECTED
PROOF
M-C Lecrenier et al. Food Control xxx (xxxx) xxx-xxx
shows some differences. Peak intensities observed by Lab 5 for the hemoglobin peptides VGGHAAEYGAEALER, AAVTAFWGK and VVAGVANALAHR were lower in sample #8 than in sample #5. Pep-tide counts detected by Lab 6 for VGGHAAEYGAEALER and VVAGVANALAHR were also lower in sample #8 than in sample #5. EFTPVLQADFQK (hemoglobin) and GEPGPAGAVGPAGAVGPR (colla-gen) had the same peptide counts. For Lab 1, the comparison was lim-ited to muscle and cartilage peptides as the other ones may appear in both adulterants of sample #8, PAP and milk. In this case, the signal intensities of MLSSLFANYAGFDTPIEK (myosin-7) and AGGIELFAIGVGR (matrilin-1) were higher in sample #8 than in sample #5. These results revealed that the presence of milk can have different impacts on the de-tection of PAP depending on the method and the peptides used. This phenomenon is probably linked to a cause of disturbance well described in ESI-LC-MS: matrix effects. These effects are often due to the alteration of the ionization efficiency of the target analytes due to the co-elution of other compounds. Matrix effects can affect analytical performance in the form of a decrease (ion suppression) or an increase (ion enhance-ment) in signal intensity (Zhou, Yang, & Wang, 2017). The fact that the presence of milk in sample #8 has a different impact on the results of Lab 1 vs other labs can therefore be explained: the specific purifica-tion (immunoaffinity enrichment) used by Lab 1 minimizes the matrix effect by removing more co-eluting molecules.
Some participants also included the detection of milk powder (Labs 1, 3, 5 and 6) in their results. Correct detection of milk proteins was achieved by four laboratories (more details in the Supplementary Ta-bles 1–6), meaning that no false negative result was reported. How-ever, milk powder induced many false positive results and all laborato-ries found milk peptides at least in one sample that did not contain milk powder. As PCR analyses cannot distinguish the origin of detected ru-minant DNA, QC and blind samples (samples #4, #5, #6, #7, #8 and #9) were analyzed by enzyme-linked immunosorbent assays (ELISAs) in order to evaluate if the unexpected results were not due to an un-known milk contamination during sample preparation. Analyses were performed by the CER Groupe using ELISAs developed for allergen de-tection in food (Dumont et al., 2010). These methods are very sensi-tive for the detection of beta-lactoglobulin and casein, with a limit of quantification of 0.25 ppm and 0.5 ppm, respectively. No milk protein was detected in samples #5, #6 and #9 and both beta-lactoglobulin and casein were detected in samples #4, #7 and #8.
Lab 1 erroneously classified sample #5 as positive with regard to milk content. The classification was based on the presence of high os-teopontin content in the sample. YPDAVATWLKPDPSQK (osos-teopontin) is used by Lab 1 both to detect the presence of milk and of bone-contain-ing PAP. The identification of the tissue of origin is based on the pro-tein ratio of osteopontin vs the blood propro-teins. The high bone content of PAP-1, used for sample #5 adulteration, probably caused this misclas-sification. This study underlines the difficulty of the approach to iden-tify the tissue origin of a protein based on its ratio to other proteins, especially when analyzing mixtures with variable tissue ratios. Hence, a broader data knowledge of PAP composition ranges will be necessary for more reliable milk detection based on the ratio between osteopontin and other tissue markers. The reasons for false milk detection of Labs 3, 5, and 6 are less obvious though based on the same peptides. Lab 3 found milk peptides in one of the two replicates for sample #5 and sample #6. Lab 5 detected one casein peptide in sample #6 but did not declare the sample as positive for milk according to their evalua-tion criteria, which requires the detecevalua-tion of two peptides to confirm the presence of the targeted by-product. Lab 6 also detected only one milk marker in sample #6 and declared the sample as positive for milk, according to their acceptance criterion. As described by Ramachan-dran, Yang, and Downs (2020), some milk peptides are known to be sticky leading to increase carryover effects. This phenomenon may ex-plain the false positive results observed. Carry-over is due to non-spe-cific adsorption of peptides that can occur at every part of the LC-MS
system (Maes, Smolders, Michotte, & Van Eeckhaut, 2014). The po-tential risk is increased consecutively to the injection of high-concentra-tion samples. In order to overcome this problem, it is essential to un-derstand the origin of carry-over and to develop efficient strategies to reduce it. If, despite everything, it is not possible to manage it, the ex-clusion of troublesome peptides from the target list is another option.
6. Conclusion
The versatility and discriminative power of LC-MS/MS-based pro-teomics methods to identify both species and tissue origin allows to ef-ficiently and unambiguously determine an array of prohibited and au-thorized animal by-products in feed samples. The present study shows that LC-MS/MS is able to successfully identify the presence of various proteins of bovine origin in feed at an adulteration level of 1% (w/w). Both LRMS and HRMS exhibited very similar performances in term of accuracy. The results also revealed that there are still some pitfalls to solve. For example, as similarly observed when using other analytical approaches for PAP detection and differentiation, the heterogeneity of the composition of feed materials can interfere with the correct detec-tion of specific peptide in certain matrices. This inter-laboratory study thus provides important data required to build robust and reproducible LC-MS/MS methods for future routine PAP analyses for the detection of prohibited animal by-products. In addition to the very specific applica-tion of MS-based proteomics for PAP detecapplica-tion, the results obtained in the present study also provide evidence that protein markers may be a very useful tool for more general questions of feed and food authentica-tion issues, especially in cases of highly processed products.
CRediT authorship contribution statement
Marie-Caroline Lecrenier: Conceptualization, Formal
analy-sis, Writing - original draft, Writing - review & editing, Resources. Aline
Marien: Conceptualization, Investigation, Writing - review &
editing, Resources. Pascal Veys: Conceptualization, Investigation, Writing -review & editing, Resources. Ikram Belghit: Investigation, Writing - re-view & editing. Marc Dieu: Investigation, Writing - rere-view & edit-ing. Nathalie Gillard: Investigation, Writing - review & editedit-ing. Jean
Henrottin: Investigation, Writing - review & editing. Uta M. Herfurth:
Investigation, Writing - review & editing. Daniela Marchis: Investigation, Writing review & editing. Sara Morello: InvestigaInvestigation, Writing -review & editing. Eystein Oveland: Investigation, Writing - -review & editing. Oliver Poetz: Investigation, Writing - review & editing. Josef
Daniel Rasinger: Investigation, Writing - review & editing. Andreas Steinhilber: Investigation, Writing - review & editing. Vincent Baeten:
Conceptualization, Writing - review & editing, Resources. Gilbert
Berben: Conceptualization, Writing - review & editing,
Re-sources. Olivier Fumière: Conceptualization, Writing - review & edit-ing, Resources.
Declaration of competing interest
The authors declare the following competing financial interest(s): O.P. is shareholder of SIGNATOPE GmbH. SIGNATOPE offers assay de-velopment and service using MS-based immunoassay technology.
Acknowledgement
The authors are grateful to the technical staff of the participating laboratories: IZSTO, Signatope, IMR, CER Groupe, BfR, UNamur and the Walloon Agricultural Research Centre (CRA-W). A special thanks to Lisa Plasman, Alexandra Cordonnier and Julien Maljean, from the Quality and Authentication of Agricultural Products Unit of the CRA-W, for their technical assistance in sample preparation and analysis. We also thank Mohamed El Morabit from the Valorization of Agricultural Products, Biomass and Wood Unit of the CRA-W for performing the Kjeldahl analyses. This work was supported by funds of German Gov-ernment's Special Purpose Fund held at Landwirtschaftliche Renten 6
UNCORRECTED
PROOF
bank (FKZ 28RZ6IP002) with regard to the work of Uta M. Herfurth,Oliver Poetz and Andreas Steinhilber.
Appendix A. Supplementary data
Supplementary data to this article can be found online athttps://doi.
org/10.1016/j.foodcont.2021.107944.
References
Belghit, I., Lock, E.-J., Fumière, O., Lecrenier, M.-C., Renard, P., & Dieu, M., et al. (2019). Species-specific discrimination of insect meals for aquafeeds by direct comparison of tandem mass spectra. Animals, 9(5), 222. doi:10.3390/ani9050222.
Distler, U., Kuharev, J., Navarro, P., & Tenzer, S. (2016). Label-free quantification in ion mobility-enhanced data-independent acquisition proteomics. Nature Protocols, 11(4), 795–812. doi:10.1038/nprot.2016.042.
Dumont, V., Kerbach, S., Poms, R., Johnson, P., Mills, C., & Popping, B., et al. (2010). Development of milk and egg incurred reference materials for the validation of food allergen detection methods. Quality Assurance and Safety of Crops & Foods, 2(4), 208–215. doi:10.1111/j.1757-837X.2010.00081.x.
European Commission (2002). Commission Decision 2002/657/EC of 12 August 2002 implementing Council Directive 96/23/EC concerning the performance of analytical methods and the interpretation of results. Official Journal of European Union, L, 221, 8–36.
European Commission (2009). Commission Regulation (EC) No 152/2009 of 27 January 2009 laying down the methods of sampling and analysis for the official control of feed. Official Journal of European Union, L, 54, 1–130.
European Commission (2011). Commission Regulation (EU) No 142/2011 of 25 February 2011 implementing Regulation (EC) No 1069/2009 of the European Parliament and of the Council laying down health rules as regards animal by-products and derived products not intended for human consumption and implementing Council Directive 97/78/EC as regards certain samples and items exempt from veterinary checks at the border under that Directive Text with EEA relevance. Official Journal of European Union, L, 54, 1–254.
European Union Reference Laboratory for Animal Proteins in feedingstuffs (2013). EURL-AP standard operating procedure - use of staining reagents.http://eurl.craw.eu/ img/page/sops/EURL-AP%20SOP%20use%20of%20staining%20reagents%20V1.0. pdf. (Accessed 8 August 2018).
ISO 8968-1 (2014). Milk and milk products — determination of nitrogen content — Part 1: Kjeldahl principle and crude protein calculation. International Organization for Standardization.
Jones, D.B., Munsey, V.E., & Walker, L.E. (1942). Report of committee on protein factors. Journal of the Association of Official Analytical Chemists, 25, 118–120.
Lecrenier, M.C., Marbaix, H., Dieu, M., Veys, P., Saegerman, C., & Raes, M., et al. (2016). Identification of specific bovine blood biomarkers with a non-targeted approach using HPLC ESI tandem mass spectrometry. Food Chemistry, 213, 417–424. doi:10.1016/ j.foodchem.2016.06.113.
Lecrenier, M.C., Planque, M., Dieu, M., Veys, P., Saegerman, C., & Gillard, N., et al. (2018). A mass spectrometry method for sensitive, specific and simultaneous detection of bovine blood meal, blood products and milk products in compound feed. Food Chemistry, 245(Supplement C), 981–988. doi:10.1016/j.foodchem.2017.11.074. Lecrenier, M.C., Veys, P., Fumière, O., Berben, G., Saegerman, C., & Baeten, V. (2020).
Official feed control linked to the detection of animal byproducts: Past, present, and future. Journal of Agricultural and Food Chemistry, 68(31), 8093–8103. doi:10.1021/ acs.jafc.0c02718.
Maes, K., Smolders, I., Michotte, Y., & Van Eeckhaut, A. (2014). Strategies to reduce aspecific adsorption of peptides and proteins in liquid chromatography-mass spectrometry based bioanalyses: An overview. Journal of Chromatography A, 1358, 1–13. doi:10.1016/j.chroma.2014.06.072.
Marbaix, H., Budinger, D., Dieu, M., Fumière, O., Gillard, N., & Delahaut, P., et al. (2016). Identification of proteins and peptide biomarkers for detecting banned processed animal proteins (PAPs) in meat and bone meal by mass spectrometry. Journal of Agricultural and Food Chemistry, 64(11), 2405–2414. doi:10.1021/acs/jafc.6b00064. Marchis, D., Altomare, A., Gili, M., Ostorero, F., Khadjavi, A., & Corona, C., et al. (2017). LC-MS/MS identification of species-specific muscle peptides in processed animal proteins. Journal of Agricultural and Food Chemistry, 65(48), 10638–10650. doi:10.1021/acs.jafc.7b04639.
Niedzwiecka, A., Boucharef, L., Hahn, S., Zarske, M., Steinhilber, A., & Poetz, O., et al. (2018). A novel antibody-based enrichment and mass spectrometry approach for the detection of species-specific blood peptides in feed matrices. Food Control. doi:10.1016/j.foodcont.2018.11.036.
Ramachandran, B., Yang, C.T., & Downs, M.L. (2020). Parallel reaction monitoring mass spectrometry method for detection of both casein and whey milk allergens from a baked food matrix. Journal of Proteome Research. doi:10.1021/ acs.jproteome.9b00844.
Rasinger, J.D., Marbaix, H., Dieu, M., Fumière, O., Mauro, S., & Palmblad, M., et al. (2016). Species and tissues specific differentiation of processed animal proteins in aquafeeds using proteomics tools. Journal of Proteomics, 147, 125–131. doi:10.1016/ j.jprot.2016.05.036.
Steinhilber, A.E., Schmidt, F.F., Naboulsi, W., Planatscher, H., Niedzwiecka, A., & Zagon, J., et al. (2018a). Mass spectrometry-based immunoassay for the quantification of banned ruminant processed animal proteins in vegetal feeds. Analytical Chemistry. doi:10.1021/acs.analchem.8b00120.
Steinhilber, A.E., Schmidt, F.F., Naboulsi, W., Planatscher, H., Niedzwiecka, A., & Zagon, J., et al. (2018b). Species differentiation and quantification of processed animal proteins and blood products in fish feed using an 8-plex mass spectrometry-based immunoassay. Journal of Agricultural and Food Chemistry, 66(39), 10327–10335. doi:10.1021/acs.jafc.8b03934.
Steinhilber, A.E., Schmidt, F.F., Naboulsi, W., Planatscher, H., Niedzwiecka, A., & Zagon, J., et al. (2019). Application of mass spectrometry-based immunoassays for the species- and tissue-specific quantification of banned processed animal proteins in feeds. Analytical Chemistry, 91(6), 3902–3911. doi:10.1021/acs.analchem.8b04652. Zhou, W., Yang, S., & Wang, P.G. (2017). Matrix effects and application of matrix effect