HAL Id: hal-01788667
https://hal.archives-ouvertes.fr/hal-01788667
Submitted on 9 May 2018
HAL is a multi-disciplinary open access
archive for the deposit and dissemination of
sci-entific research documents, whether they are
pub-lished or not. The documents may come from
teaching and research institutions in France or
abroad, or from public or private research centers.
L’archive ouverte pluridisciplinaire HAL, est
destinée au dépôt et à la diffusion de documents
scientifiques de niveau recherche, publiés ou non,
émanant des établissements d’enseignement et de
recherche français ou étrangers, des laboratoires
publics ou privés.
Alain Barrat, Mathieu Génois
To cite this version:
Alain Barrat, Mathieu Génois. Can co-location be used as a proxy for face-to-face contacts?. EPJ
Data Science, EDP Sciences, 2018, 7 (1), pp.11. �10.1140/epjds/s13688-018-0140-1�. �hal-01788667�
RESEARCH
Can co-location be used as a proxy for
face-to-face contacts?
Mathieu G´
enois
1,2*and Alain Barrat
1,3*Correspondence: [email protected]
2GESIS, Leibniz Institute for the
Social Sciences, Unter Sachsenhausen 6-8, 50667 K¨oln, Germany
Full list of author information is available at the end of the article
Abstract
Technological advances have led to a strong increase in the number of data collection efforts aimed at measuring co-presence of individuals at different spatial resolutions. It is however unclear how much co-presence data can inform us on actual face-to-face contacts, of particular interest to study the structure of a population in social groups or for use in data-driven models of information or epidemic spreading processes. Here, we address this issue by leveraging data sets containing high resolution face-to-face contacts as well as a coarser spatial localisation of individuals, both temporally resolved, in various contexts. The co-presence and the face-to-face contact temporal networks share a number of structural and statistical features, but the former is (by definition) much denser than the latter. We thus consider several down-sampling methods that generate surrogate contact networks from the co-presence signal and compare them with the real face-to-face data. We show that these surrogate networks reproduce some features of the real data but are only partially able to identify the most central nodes of the face-to-face network. We then address the issue of using such down-sampled co-presence data in data-driven simulations of epidemic processes, and in identifying efficient containment strategies. We show that the performance of the various sampling methods strongly varies depending on context. We discuss the consequences of our results with respect to data collection strategies and methodologies.
Keywords: face-to-face contacts; co-presence; digital epidemiology; complex networks
1 Introduction
In the recent years, several methods have been developed to gather quantitative data on human interactions using wearable sensors and complement more traditional methods based on surveys [1,2,3]. Current data collection methods range from the use of Bluetooth or WiFi signals in mobile phones [4,5,6,7,8,9] to the specific de-velopment of dedicated sociometric sensors [10,11,12,13,14,15,16,17,18,19] and enable researchers to record and measure physical proximity events between indi-viduals in various social contexts. Depending on the specific technology considered however, spatial resolution varies and the resulting “contacts” detected can range from co-presence in a room or a part of a building to close face-to-face encounters. The resulting data is often temporally resolved and has been increasingly used in various contexts including the study of human behaviour, the validation of models of human interactions and data-driven models of epidemic spreading [20,21,3].
Despite the increasing availability of techniques to measure even high-resolution temporal contact networks however, a number of limitations remain. In particular,
measures cannot be carried out for arbitrarily large population sizes. It is thus of crucial interest to infer contacts or build contact proxies from data with lower spatial resolution data or coming from other sources. In this spirit, several studies have considered the issue of inferring social ties from email exchanges [22], mobile phone data [23], or co-location at geographic scale [24]. Other works try to infer close proximity in specific settings from individual attributes [25] or from a very precise localisation of individuals [17], or, at geographical scale, from the similarity of the WiFi signals received from a large enough number of WiFi routers [26].
Here instead, we do not try to infer specific contacts between pairs of individuals but rather investigate if a coarse co-location information on individuals allows us to reach an overall picture of the contact patterns in the population of interest. To this aim, we leverage several data sets collected by the SocioPatterns collabora-tion [27,13] in various contexts: these data include both detailed information about close, face-to-face encounters between individuals and a location tracking of individ-uals with low spatial resolution. It is thus possible to build two temporal networks where nodes represent individuals and links correspond respectively to a face-to-face contact or to a co-presence event, where co-presence is defined with respect to the localisation of two individuals within the same spatial area. We first compare the structural and statistical properties of these two temporal networks and show that they share some important properties, although the co-presence network is much denser, due to the lower spatial resolution involved in its definition. We thus investigate several methods of down-sampling the co-presence signal in order to create surrogate contact networks, in the spirit of [28, 29], and compare these sur-rogate data to the actual networks of face-to-face contacts. We focus first on several statistical characteristics of temporal and aggregated networks, and quantify the ability to identify central nodes in the contact network from the surrogate data. We then consider the possibility to use the surrogate data in numerical simulations of data-driven models for epidemic spread. In particular, we compare the outcome of simulations of a standard model of epidemic propagation when surrogate or actual contact data are used, and we explore the possibility to identify the most efficient containment strategies from this limited information [30]. Our results turn out to depend strongly on the data collection context, highlighting the limitations of coarse co-presence networks with respect to detailed face-to-face data.
2 The co-presence network
2.1 Data sets
We use data collected by the SocioPatterns collaboration in various contexts. These data were gathered using wearable sensors able to detect face-to-face close range proximity (1.5 m) of participants wearing the sensors on their chests. In addition, the sensors broadcast a signal that can be received by RFID readers located in the environment. In open space, each reader can receive signals from sensors situated within a range of ∼ 30 m, while the actual reception range in a building depends on its specific structure and on the nature of its walls, floors and ceilings. Each reader thus defines a coarse spatial area and the sensors’ signals can be followed when the individuals carrying them change area. For each sensor, we define its “spatial location” at each time as the set of readers receiving its broadcasted signal at this
time, and we define two individuals to be in co-presence if they share the same spatial location, i.e., the same exact set of readers have received signals from both individuals.
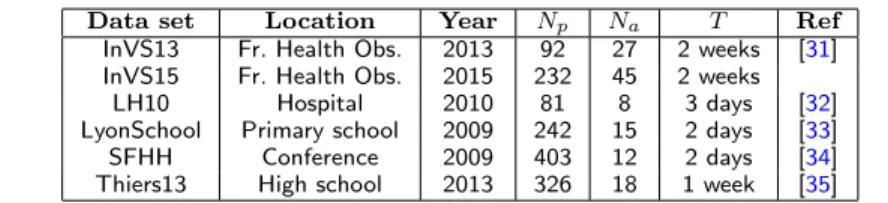
Table 1 Characteristics of the data sets.
Data set Location Year Np Na T Ref
InVS13 Fr. Health Obs. 2013 92 27 2 weeks [31]
InVS15 Fr. Health Obs. 2015 232 45 2 weeks
LH10 Hospital 2010 81 8 3 days [32]
LyonSchool Primary school 2009 242 15 2 days [33]
SFHH Conference 2009 403 12 2 days [34]
Thiers13 High school 2013 326 18 1 week [35]
Npis the number of participants, Nathe number of RFID readers, T the total duration of the data
collection.
We use data sets from various social contexts: a workplace, with data collected in two different years (InVS13, InVS15), a hospital (LH10), a primary school (Lyon-School), a scientific conference (SFHH) and a high school (Thiers13), see Table1. In each case, we thus consider a temporal network of face-to-face contacts and a tem-poral network of co-presence between individuals, both at the temtem-poral resolution of 20s. A contact (resp. co-presence) event between two individuals is then defined as a set of successive time-windows of 20s during which the individuals are detected in contact (resp. co-presence), while they are not in the preceding nor in the next 20s time window. While the conference data does not include any other informa-tion on the participants and does not exhibit any particular group structure [36], the other populations under study can each be divided into groups: departments for the workplace, classes for the school and the high school, and roles (patients, doctors, nurses) in the hospital. In these cases, the overall structure of networks aggregated over a certain time window can be summarised, in addition to usual quantities such as the density, the clustering coefficient or the degree distribution, by contact (resp. co-presence) matrices that give the fraction of pairs of individu-als of different groups who have been in contact (resp. in co-presence). Moreover, temporal features of interest include the distributions of durations of contact or co-presence events, of the time elapsed between successive events, of the numbers and aggregated durations of such events between pairs of individuals (the latter quantity yields a natural definition of the weight of a link between individuals in the aggregated network).
We will show in the main text the results corresponding to the InVS15 data set, and we refer to the Supplementary Information for the results obtained with the other data sets. We make also available as Supplementary Files the temporally resolved contact and co-presence networks.
2.2 Co-presence and contact networks
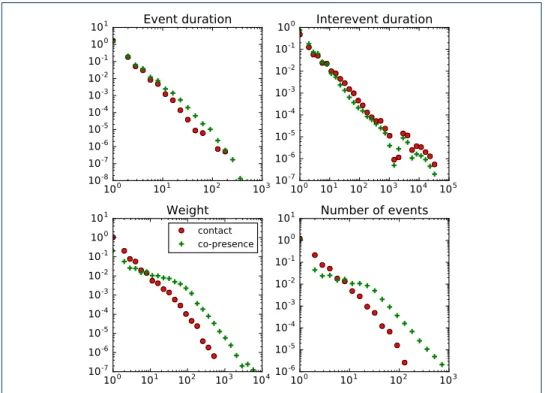
We first compare some features of the co-presence and contact networks, both temporal and for networks aggregated either on the whole data gathering period or over daily temporal windows. We show in Fig.1the distributions of event and inter-event duration, as well as the distributions of number and cumulative duration of events for individual pairs. The co-presence events show broad distributions of these quantities, similarly to the contact events and with similar slopes: using only co-presence data yields approximate information on the functional shape of the contact
10
010
110
210
310
410
-710
-610
-510
-410
-310
-210
10
-1 010
1Weight
contact co-presence10
010
110
210
310
-610
-510
-410
-310
-210
-110
010
1Number of events
10
010
110
210
310
-810
-710
-610
-510
-410
-310
-210
10
-1 010
1Event duration
10
010
110
210
310
410
510
-710
-610
-510
-410
-310
-210
-110
0Interevent duration
Figure 1 Temporal distributions for co-presence and contact events — InVS15. We show for both the contact and co-presence of the same data set the distributions of event and inter-event duration, link weights (as total contact duration) and number of contacts per link.
duration distributions. The distributions of durations and numbers of events are however typically broader for co-presence, with heavier tails, and the distribution of inter-event durations tend to be less broad (see also SI). This is not surprising as the criterion for being in co-presence is less strict than for being in contact. We observe the strongest differences between co-presence and contact distribution functional shapes for the primary school data. This could be related by the fact that the spatial resolution is in that case quite low, with all the schoolyard being covered by one single reader, and some readers covering more than one classroom. Overall, using only co-presence data would lead to over-estimations of the contact durations and aggregate durations.
Table 2 Similarity between contact matrices.
InVS13 InVS15 LH10 LyonSchool Thiers13
Co-presence 0.790 0.710 0.968 0.706 0.681
Sampling 1 0.946 0.829 0.960 0.845 0.857
Sampling 2 0.958 0.901 0.894 0.945 0.937
Sampling 3 0.888 0.816 0.958 0.738 0.691
For each data set we compute the cosine similarity between the average daily contact matrix and the co-presence matrix, as well as for the contact matrices obtained for each sampling method of the
co-presence data, averaged over 100 realisations for each sampling method.
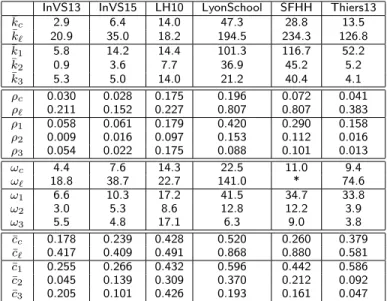
We compare moreover in Figs. 2 - 3 and Tables 2 - 3 the overall structures of the contact and co-presence networks, aggregated over daily time windows. The co-presence aggregated networks are much denser than the contact network, with a larger average degree, a larger average clustering coefficient and larger cliques, as expected once again given the lower spatial resolution required for co-presence
Table 3 Characteristics of the contact, co-presence, and sampled co-presence networks.
InVS13 InVS15 LH10 LyonSchool SFHH Thiers13
¯ kc 2.9 6.4 14.0 47.3 28.8 13.5 ¯ k` 20.9 35.0 18.2 194.5 234.3 126.8 ¯ k1 5.8 14.2 14.4 101.3 116.7 52.2 ¯ k2 0.9 3.6 7.7 36.9 45.2 5.2 ¯ k3 5.3 5.0 14.0 21.2 40.4 4.1 ρc 0.030 0.028 0.175 0.196 0.072 0.041 ρ` 0.211 0.152 0.227 0.807 0.807 0.383 ρ1 0.058 0.061 0.179 0.420 0.290 0.158 ρ2 0.009 0.016 0.097 0.153 0.112 0.016 ρ3 0.054 0.022 0.175 0.088 0.101 0.013 ωc 4.4 7.6 14.3 22.5 11.0 9.4 ω` 18.8 38.7 22.7 141.0 * 74.6 ω1 6.6 10.3 17.2 41.5 34.7 33.8 ω2 3.0 5.3 8.6 12.8 12.2 3.9 ω3 5.5 4.8 17.1 6.3 9.0 3.8 ¯ cc 0.178 0.239 0.428 0.520 0.260 0.379 ¯ c` 0.417 0.409 0.491 0.868 0.880 0.581 ¯ c1 0.255 0.266 0.432 0.596 0.442 0.586 ¯ c2 0.045 0.139 0.309 0.370 0.212 0.092 ¯ c3 0.205 0.101 0.426 0.193 0.161 0.047
We compare the average degree (¯k) network density (ρ), clique number (ω) and average clustering
(¯c) of daily aggregated networks, for the contact network (c subscript), the co-presence network (`
subscript), and the sampled co-presence networks (subscripts 1 to 3 according to the sampling method). Values are averaged over all the days of the study. In the case of SFHH, since on the second
day there was activity only during the morning, only the values of the first day are reported. *The network is too large and too dense for the clique number to be determined in reasonable time
via the usual algorithm.
Figure 2 Contact and co-presence matrices — InVS15. Comparison between the average matrices of link density for the contacts and the co-presence daily aggregated networks. Values are averaged over all days of the data collection. Both plots have the same colour scale.
events. In some cases (school, conference), the aggregated networks are even close to being fully connected (see for illustration Fig.3). Despite this strong difference in the overall density of links, the contact and co-presence matrices giving the density of links between and within each group, averaged across days, are very similar (Table2). The similarity is particularly high for the hospital data and, even for the lower value obtained for the high school data, the matrices displayed in the SI show that the overall structure in classes and groups of classes can be inferred from the co-presence data alone.
Figure 3 Day 2 contact and co-presence networks — InVS15. This figure highlights the difference in terms of link density when comparing contact and co-presence daily networks. Different node colours correspond to the different administrative departments.
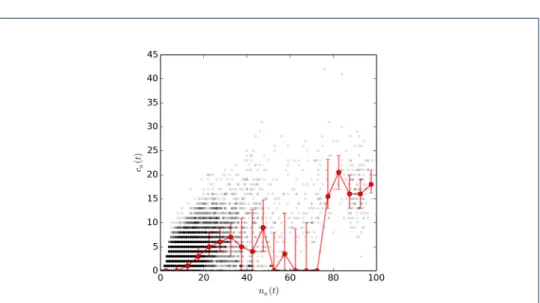
Figure 4 Number of contacts as a function of the number of individuals present — InVS15.
We plot the number of contacts ca(t) occurring at time t in a certain area a as a function of the
number of individuals na(t) present at the same time in a. The red line shows the median of the
scatter plot, with error bars defined by the 25 % and 75 % percentiles.
Given the simultaneous discrepancies in density values and similarities in the net-works group structures, we investigate if the data exhibits a scaling law between the number of individuals present in an area and their contact activity, as found at geo-graphical scale in phone communication [37] and Twitter data [38]. Figure4and the similar figures shown in SI show the results obtained in the various contexts. Apart from the office cases (InVS13 and InVS15), we observe indeed a correlation between the median of the number of contacts and the number of individuals present. This correlation exhibits a power law shape, with an exponent around 1.5 (see figures in SI). However, huge, context-dependent fluctuations are observed. For instance, in the InVS15 case, the trend is strongly influenced by the numerous instances of an absence of contacts despite potentially large values of the number of individuals present in the area. This is a consequence of the fact that a given reader can receive
signals from the sensors of individuals located in different offices. In other areas such as a cafeteria, many more contacts occur with potentially a similar or even smaller number of individuals. Overall, very large fluctuations of the number of contacts, at given number of individuals present, are thus observed, because on the one hand of the low spatial resolution of the co-presence data, and on the other hand of the va-riety of contexts corresponding to the areas covered by different RFID readers. The stronger correlation is observed for the SFHH conference data, probably because the various areas covered by the readers corresponded to similar contexts, namely different areas of the exhibition and poster rooms.
3 Sampling co-presence data
3.1 Sampling methods
As the temporal network of co-presence bears some similarities with the actual contact data, but contains much more events and leads to much denser aggregated networks, we consider the possibility to down-sample the co-presence data: for each pair of individuals, each contact event is indeed included in a co-presence event of the same individuals. Each co-presence event might thus correspond to one or more contact events. As we cannot determine exactly the correct down-sampling to be performed if we have access only to co-presence data, we study here three simple sampling methods. We remind here that we do not try to infer the real contacts but rather to obtain a down-sampled version of the co-presence network that is statistically similar to the real contact data. Moreover, as the total number and duration of actual contacts cannot either be easily guessed from the co-presence data alone, we consider the actual total contact time Tc as the (only) parameter
of the sampling, and we fix it to its empirical value. The sampling methods we consider are the following:
• Sampling 1: Sampling of co-presence times. We define a co-presence list as a list of individuals present at the same time t in the same area. Each co-presence list is thus stamped with its time of occurrence t. We create n`copies
of each co-presence list `, where n` is the number of distinct individuals in `,
and create in this way of a global pool of co-presence lists. We then sample Tc
lists uniformly at random from the pool without replacement. Each list has thus a probability proportional to the number of individuals it contains to be chosen. From each chosen list, we choose at random a pair i, j of individuals, obtaining a triplet (t, i, j) where t is the time-stamp of the list (we take care to avoid repetitions: if (t, i, j) has already be obtained in a previous random draw, we repeat the random selection). The sampled temporal co-presence network (i.e., the surrogate contact network) is formed by the union of these triplets.
• Sampling 2: Sampling of co-presence times with completion. We con-stitute a pool of lists exactly like in the previous method. We then sample a triplet (t, i, j) as in the previous method, and add all the other triplets (t0, i, j) that belong to the same co-presence event to create the surrogate contact event. We iterate this until we reach a cumulative contact time Tc,
• Sampling 3: Sampling of co-presence events. We consider directly the list of co-presence events between individuals, (t, i, j, τ ) (co-presence event between individuals i and j, starting at time t and with duration τ ), and sample events from this list, without replacement, adding them to the list of surrogate contact events until we reach a cumulative contact time Tc.
For each data set, we create 100 instances of surrogate contact networks for each sampling method. We compare in the following the properties of these surrogate contact networks with the real face-to-face contact data.
3.2 Network comparison 100 101 102 103 104 10-7 10-5 10-3 10-1 w 100 101 102 103 10-6 10-4 10-2 100 n 100 101 102 103 104 10-8 10-6 10-4 10-2 100 τc 100 102 104 10-6 10-4 10-2 100 τi 6000 6500 7000 7500 0 2 4 6 8 10 12 14 16
18 Activity timeline - Day 2
0 40 80 120 160 0.00 0.01 0.02 0.03 0.04 Degree 0 10000 20000 30000 40000 50000 60000 0 20 40 60 80 100 120 Activity timeline Data Sampling 1 Sampling 2 Sampling 3
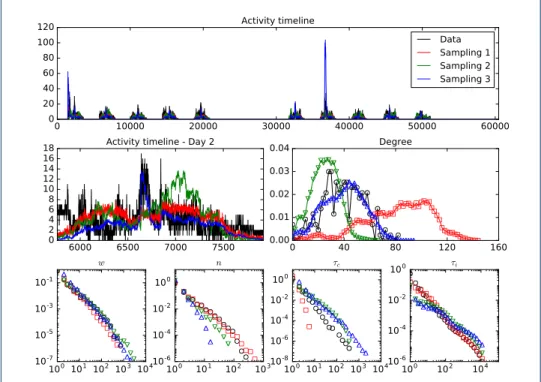
Figure 5 Properties of the sampled co-presence networks — InVS15. We compare several properties of the contact network from the original data set with the surrogate contacts obtained by sampling of the co-presence data: overall timeline of contact activity, distributions of degree, weight w and number of contacts per link n in the network aggregated over the whole data
collection period, and distributions of the contact duration τcand inter-contact duration τi.
Figures 5 - 6 and Tables2 - 3 provide elements of comparison between the sur-rogate contact networks and the empirical data (see also SI). The first observation is that the contact activity timelines are in general broadly recovered, except for the primary school (see SI), while the detailed intra-day activity variations are not always properly reconstructed in the surrogate data (except for the hospital data, see SI). The strongest deviations are observed for the second sampling method for the conference and high school data.
The first sampling method, given it samples separately times of co-presence, yields an exponential distribution of surrogate contact duration, in contrast with actual data and other sampling methods in which broad distributions are observed. Broad distributions of inter-contact durations and of the numbers of contacts between individuals are also obtained, with however slopes that depend on the context.
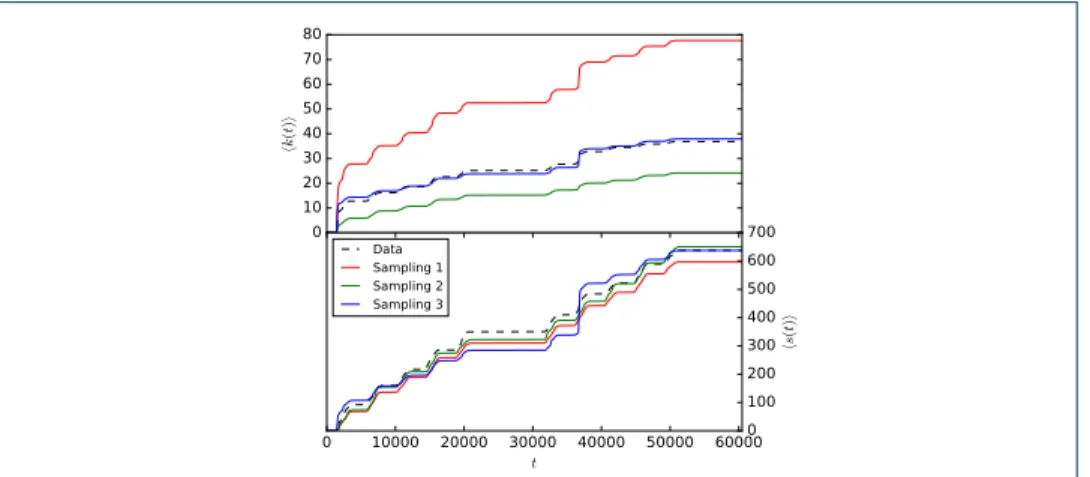
t 0 10 20 30 40 50 60 70 80 h k( t) i 0 10000 20000 30000 40000 50000 60000 t 0 100 200 300 400 500 600 700 h s( t) i Data Sampling 1 Sampling 2 Sampling 3
Figure 6 Evolution of the mean aggregated degree and strength. InVS15 data set We compare how the average degree hk(t)i and the average strength hs(t)i grow as we aggregate the network on increasing time-windows, for the real contact data and each sampling method.
For instance, the second sampling method systematically leads to a distribution of contact durations that is broader than for the real contacts. The third method yields a distribution of contact durations similar to the real one for the InVS13, LH10, and SFHH cases, but gives results similar to the second method in the other cases.
We now turn to the properties of networks aggregated over daily periods or over the whole data collection. At the daily level, we show in Table2that the similarity of the contact matrices obtained from the surrogate data with the empirical one is very high, and most often larger than the similarity of the original co-presence matrix. For networks aggregated over the whole data collection, Fig. 5 shows the distributions of degrees and of weights (see also SI). The first sampling method leads to an overestimation of degree values (resulting in a shift of the distribution), the second method tends to shift the distribution to lower degree values (except for the conference case), and the third method yields context-dependent over- or under-estimations of degree values. Note that the distributions of degrees of the co-presence networks are not shown in the figure as the degree values are very strongly overestimated. Distributions of weights (aggregated contact durations) recover well the ones of the data for all sampling methods, and are closer than the ones of the co-presence networks.
Table 4 Average similarity between daily networks.
InVS13 InVS15 LH10 LyonSchool Thiers13
Contact 0.333 0.305 0.351 0.643 0.431 Co-presence 0.415 0.348 0.449 0.806 0.683 Sampling 1 0.361 0.344 0.436 0.749 0.515 Sampling 2 0.388 0.271 0.403 0.175 0.084 Sampling 3 0.286 0.205 0.437 0.042 0.071 Null model 0.022 0.010 0.061 0.046 0.010
For each data set we compute the cosine similarity between the neighbourhoods of each nodes from each daily network, averaged for all nodes and all pairs of daily networks. The neighbourhood of a node n is defined as the vector of the link weights between n and every other nodes (if the link does
not exist the weight is set to zero). We compare the values obtained for the contact data, the co-presence data, and for the networks generated by each sampling method of the co-presence data,
averaged over 100 realisations for each sampling method. For reference, we also compute as null model the average similarity when links in the contact data are shuffled randomly within each daily
To investigate intermediate timescales of aggregation, Table4quantifies the simi-larity between networks aggregated in different days. The measure is defined as the average cosine similarity between all pairs of instances of a node’s neighbourhood, averaged over all nodes. We see that the similarity is higher for the co-presence net-works, as expected since the networks are denser. The sampling method 1 generates networks that are more similar than the data, and the other two methods generate networks that are less similar (with the exception of the LH10 case, and the method 2 in the InVS13 case). In the cases of the method 2 for the LyonSchool data, and the methods 2 and 3 for the Thiers13 data, the sampled networks are even almost as different as they would be after a random shuffling of the links.
In addition, Fig. 6 gives the evolution of the average degree and strength for networks aggregated in increasingly long time windows. First, the evolution of the real average aggregated strength is usually better recovered than for the degree by the various sampling better. Second, which sampling method recovers better the evolution of the degree is again context dependent. However, in all cases the sampled data are much closer to the contact data than the co-presence network, which overestimates very strongly these quantities.
3.3 Node centralities 5 10 15 20 25 30 35 40 45 50 top N % 0.0 0.2 0.4 0.6 0.8 1.0 Jaccard similiarity Sampling 1 Sampling 2 Sampling 3 Random Copresence 5 10 15 20 25 30 35 40 45 50 top N % 0.0 0.2 0.4 0.6 0.8 1.0 Jaccard similiarity Sampling 1 Sampling 2 Sampling 3 Random Copresence 5 10 15 20 25 30 35 40 45 50 top N % 0.0 0.2 0.4 0.6 0.8 1.0 Jaccard similiarity Sampling 1 Sampling 2 Sampling 3 Random Copresence
k
b
s
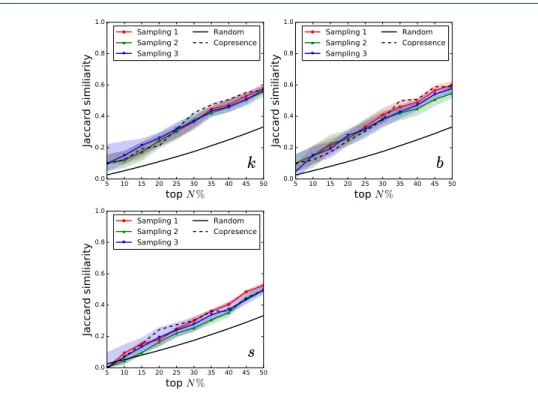
Figure 7 Node ranking similarity. InVS15 data set We plot for each co-presence sampling method the Jaccard similarity between the top N % nodes in the real and surrogate contact data, when ranked according to their degree k, their strength s or their betweenness centrality b vs. N . The plot shows the median similarity and the shaded areas give the 90 % confidence interval.
In a network, more “central” nodes are usually considered as important, as they might play an important role for instance in spreading processes (or other dynamical phenomena) occurring in the network. It is thus of interest to understand whether
the most central nodes in the contact network can be identified either in the raw co-presence data or in the surrogate contact data built from the co-presence infor-mation. As there are several ways of determining central nodes in a network, we consider here three of the most well-known centrality measures and apply them to the networks aggregated over the whole data collection: degree k, strength s and betweenness b of nodes in the aggregated networks. For each instance of each sampling method, we thus build the resulting surrogate aggregated contact network and rank nodes according to each centrality measure. We then compute the Jaccard similarity index between the top N % nodes in the real contact network and in the surrogate one. We plot in Fig. 7 the median similiarity with the 90 % confidence interval, as a function of N , for the InVS15 case (see SI for the other cases).
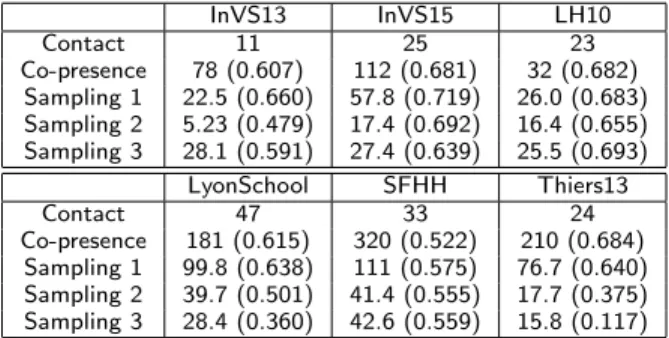
Table 5 Comparison of the maximum k-core properties.
InVS13 InVS15 LH10 Contact 11 25 23 Co-presence 78 (0.607) 112 (0.681) 32 (0.682) Sampling 1 22.5 (0.660) 57.8 (0.719) 26.0 (0.683) Sampling 2 5.23 (0.479) 17.4 (0.692) 16.4 (0.655) Sampling 3 28.1 (0.591) 27.4 (0.639) 25.5 (0.693) LyonSchool SFHH Thiers13 Contact 47 33 24 Co-presence 181 (0.615) 320 (0.522) 210 (0.684) Sampling 1 99.8 (0.638) 111 (0.575) 76.7 (0.640) Sampling 2 39.7 (0.501) 41.4 (0.555) 17.7 (0.375) Sampling 3 28.4 (0.360) 42.6 (0.559) 15.8 (0.117)
For each dataset we compute the maximum coreness, and report between parenthesis the Jaccard index between the k-core of the contact network and the k-core in the original and sampled
co-presence data (results are averaged over 100 realisations for each sampling method).
In general, no sampling method recovers correctly the most central nodes for low values of N . The best results are obtained for the conference data with similarities around 0.2 − 0.4. The similarity values increase as N increases but reach most often only values of ∼ 0.5 when considering the top 50 % nodes, meaning that only 25 % of the most central nodes are identified when using the surrogate data. The best results are obtained for the first sampling method for the LyonSchool case and for the LH10 case, with similarities reaching 0.6 − 0.7. Results are typically better than the random baseline but do not outperform the detection of most central nodes based on the whole co-presence network. In terms of the most central nodes as defined by the k-core decomposition (we recall that the k-core of a network is the maximal subgraph such that all nodes in the subgraph have at least degree k, and k is called the coreness), the overestimation of degrees in the co-presence network leads to an overestimation of the maximum coreness, while sampling leads to values closer to the ones of the contact data, but once again in a context-dependent way. The maximum core itself is only partially recovered in the whole and in the sampled co-presence networks (see Table5).
4 Using surrogate contact data in epidemic simulations
We have seen in the previous section that none of the three sampling methods yields a perfectly accurate description of all the relevant features of the true contact net-work: each sampling method yields surrogate data with both interesting similarities and potentially important discrepancies with respect to the original contact data. We now consider the issue of using such surrogate data in simulations of spreading
processes: as precise data on face-to-face contacts is not always available, it is im-portant to understand if co-presence information can allow us to obtain on the one hand an accurate prediction of the outcome of an epidemic process, and on the other hand a reliable estimation of the impact of containment measures. In particular, it is important to be able to classify potential containment strategies to determine which one(s) are most adequate.
To this aim, we consider the paradigmatic Susceptible-Infectious-Recovered (SIR) model for epidemic spreading. In this model, susceptible (S) individuals can become infectious (I) at rate β when in contact with an infectious node. Infectious nodes recover spontaneously at rate µ and enter an immune recovered (R) state. Simu-lations start with a single infectious individual chosen at random and carried out until there are no infectious individuals left in the population, i.e., individuals are either still susceptible or have been infectious and have then recovered. The impact of the epidemics is then quantified by the final fraction ni of individuals in the R
state.
We set β = 0.0004 and vary µ by tuning the reproductive number R = β/µ. For each value of R, we measure the fraction P (ni > 20 %) of “large” outbreaks
in which the fraction ni of the population that was reached by the outbreak is at
least 20 % and the distribution of the sizes niof these large outbreaks. We average
the results over 10 000 simulations performed on the empirical contact network. For each sampling method, we build 100 different instances of the surrogate contact network, and perform 100 simulations on each surrogate network.
We also consider several simple methods to mitigate the spread, namely the vac-cination of a number of individuals in the population, under the assumption of a perfect vaccine efficiency: vaccinated individuals cannot become infectious nor transmit the disease and thus slow down and hinder the propagation. We consider the vaccination of (i) 5, 10 or 20 individuals chosen at random (ii) the most central 5, 10 or 20 individuals, where centrality is measured according to either degree, strength or betweenness in either the real or surrogate contact networks (iii) when the population is structured in groups, the vaccination of all individuals in one group.
Figures8and9summarize our results for the InVS15 dataset (see SI for the figures obtained with the other datasets). In terms of the evaluation of the impact of a spreading process, results are context dependent. The simulations performed on the surrogate data obtained with the first method generally lead to an overestimation of the epidemic risk, except for the hospital data. When using the second sampling method, we obtain a good estimation of the risk for the conference, school and highschool data but an underestimation for offices and hospital data. The third method on the other hand leads to a correct estimation for the offices and hospital data but an underestimation for the school and highschool and an overestimation for the conference.
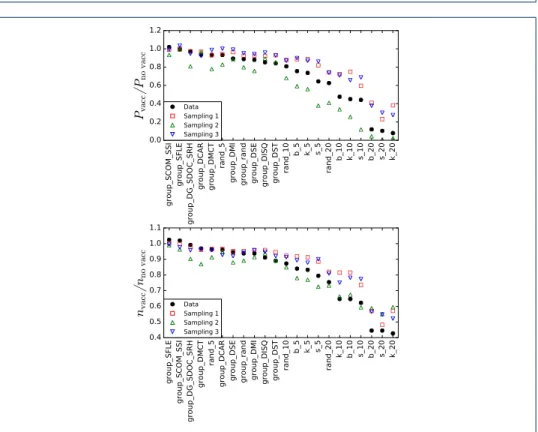
We show in Fig. 9 the impact of the various vaccination strategies, quantified through the ratio of the probabilities of large outbreaks with and without vaccina-tion, as well as the ratio between the median sizes of these large outbreaks. We rank the strategies according to their efficiency in the real contact network, in order to visualize easily whether the surrogate networks lead to the same classification of the
1.1 1.5 2.0 2.5 3.0
R
0.0 0.2 0.4 0.6 0.8 1.0Ep
ide
m
ic
siz
e (
n
i>
0
.
2
)
Data Sampl. 1 Sampl. 2 Sampl. 3 P(ni>0.2)Figure 8 Epidemic prevalence. InVS15 data set. We plot the fraction of the total number of outbreaks that reach at least 20 % of the population (crosses) and the distribution of the sizes of these outbreaks (boxplots) for several values of the reproductive number R, for the original and the surrogate contact networks.
group_SCOM_SSI
group_SFLE
group_DG_SDOC_SRH
group_DCAR group_DMCT
rand_5
group_DMI group_rand group_DSE group_DISQ group_DST
rand_10 b_5 k_5 s_5 rand_20 b_10 k_10 s_10 b_20 s_20 k_20 0.0 0.2 0.4 0.6 0.8 1.0 1.2 Pvacc no vacc Data Sampling 1 Sampling 2 Sampling 3 group_SFLE group_SCOM_SSI group_DG_SDOC_SRH group_DMCT rand_5
group_DCAR group_DSE group_rand group_DMI group_DISQ group_DST
rand_10 b_5 k_5 s_5 rand_20 k_10 b_10 s_10 b_20 s_20 k_20 0.4 0.5 0.6 0.7 0.8 0.9 1.0 1.1 nvacc no vacc Data Sampling 1 Sampling 2 Sampling 3 / /
Figure 9 Vaccination strategies. InVS15 data set. We plot the ratio between the vaccination and no vaccination cases of the fraction of the total number of outbreaks that reach at least 20 % of the population (top), and of the median size of these outbreaks (bottom) for different vaccination strategies, for the original data and the reconstructed networks. The vaccination strategies are ordered by decreasing efficiency, based on the effect on the real contact data. The group * strategies consist in vaccinating one or several groups entirely; the group rand strategy vaccinates
ng random nodes, where ngis the average group size; the rand n strategies randomly vaccinates
a specified fraction n of nodes; the b n, k n, s n strategies vaccinate the top n % nodes according to, respectively, betweenness centrality, degree and stregnth ranking.
strategies: indeed, even when the impact of each specific strategy is not accurately quantified, it would be interesting at least to understand which methods are most efficient.
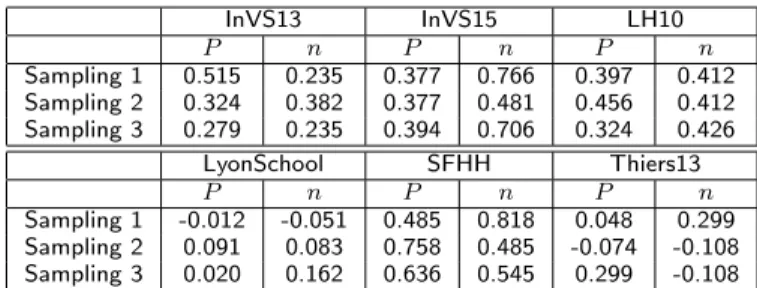
Table 6 Comparison of the vaccination strategy rankings.
InVS13 InVS15 LH10 P n P n P n Sampling 1 0.515 0.235 0.377 0.766 0.397 0.412 Sampling 2 0.324 0.382 0.377 0.481 0.456 0.412 Sampling 3 0.279 0.235 0.394 0.706 0.324 0.426 LyonSchool SFHH Thiers13 P n P n P n Sampling 1 -0.012 -0.051 0.485 0.818 0.048 0.299 Sampling 2 0.091 0.083 0.758 0.485 -0.074 -0.108 Sampling 3 0.020 0.162 0.636 0.545 0.299 -0.108
For each sampling method we compute Kendall’s tau between the list of vaccination strategies ranked by increasing efficiency for the contact data and for the sampled co-presence networks, both in terms
of the fraction of large outbreaks (P ) and of median sizes of the large outbreaks (n).
Results are once again uneven and context dependent (see also Table6). In several cases such as SFHH the ranking of strategies obtained from the sampled co-presence is overall respected (Kendall’s tau of 0.818 for the sampling method 1 on the size of outbreaks), while it can be strongly reshuffled in other cases (for instance in the Thiers13 case).
5 Discussion and conclusion
In this paper, we have investigated whether low resolution co-presence informa-tion can be used as a substitute for detailed face-to-face proximity data, both from the point of view of extracting large-scale structural and statistical features of the temporal contact network in a population and in data-driven models of epidemic processes in a population. We have considered several data sets collected in various contexts that contain both high-resolution data on face-to-face contacts between individuals and a coarser location data, both with temporal resolution. The loca-tion data can thus be transformed into a co-presence temporal network between individuals. Given its lower spatial resolution, this co-presence data contains much more events than the contact data, leading to much denser aggregated networks: indeed, all individuals in a given area are considered as co-present, while only some of them are typically engaged in a face-to-face contact. Despite this expected issue, a number of properties related to group structure and statistical distributions of temporal properties are similar in contact and co-presence data, with similar ma-trices of densities of links between groups and broad distributions of (aggregate) contact durations.
We have thus examined several methods to downsample the co-presence networks to create surrogate contact networks with overall the same amount of contact time than the real contact data. The surrogate data statistics are in general closer to the real contact data than the raw co-presence, in particular regarding the distribution of node degrees and link weights (and their evolution in networks aggregated over increasing time windows). These results mean in particular that the distribution of aggregate contact durations, a very important property that has a strong impact on the unfolding of processes on networks such as epidemic processes, could be approximately retrieved from simple sampling processes of the co-presence data
and thus fed into data-driven models of populations. Several other properties, such as precise value of the average degree, average clustering or size of largest cliques and cores, turn out however to be strongly context-dependent. Moreover, the most central nodes of the contact network are not better identified than using the bare co-presence information.
We have moreover investigated the use of such surrogate contact data in numerical simulations of spreading processes in a population. Overall, simulations performed on surrogate data obtained with one of the sampling method yield results close to the ones obtained with the real data, while the other methods over- or under-estimate these results, but the best method turns out to depend on context (Note however that all these methods give obviously results much closer to the one of the real contact network than if raw co-presence is used, given co-presence overestimates strongly the contacts and thus yields a strongly overestimated epidemic risk). We moreover investigated the possibility to rank containment strategies according to their efficiency, and found that this ranking is once again context dependent: in some cases, simulations on sampled co-presence networks allow us to uncover the most efficient vaccination strategies for containing a spread on the real contact data, while in other cases the rankings differ quite strongly.
In conclusion, we showed that co-presence data, while yielding interesting in-sights into some of the large scale properties of the contact network, is not easily usable to build in a reliable and systematic fashion surrogate contact data that reproduces detailed features of the real contacts and could be used in numerical simulations to predict the outcome of spreading processes and the impact of con-tainment strategies, at least for processes involving contagion at short distances [39] (note that, while more sophisticated sampling procedures might be devised, they would most probably involve more parameters and/or more additional information not present in the raw co-presence data, and would also most probably still give context-dependent results). We note however that even coarse location information has been shown to be a useful additional information whenever the precise contact data is incomplete [29]. Optimally, data collection with wearable sensors should thus contain both high resolution data about relative positions of individuals, in order to detect face-to-face proximity, and coarser co-presence information to inform for instance on mobility patterns within buildings or complement potential data losses.
Availability of data and material
The datasets supporting the conclusions of this article are available on the SocioPatterns website:
http://www.sociopatterns.org/datasets/(see also references in this paper). Competing interests
The authors declare that they have no competing interests. Author’s contributions
MG and AB conceived and designed the study. MG performed the numerical simulations and statistical analysis, created the figures and wrote the first draft of the manuscript. MG and AB wrote the final version of the manuscript. Author details
1Aix Marseille Univ, Universit´e de Toulon, CNRS, CPT, Marseille, France. 2GESIS, Leibniz Institute for the Social
Sciences, Unter Sachsenhausen 6-8, 50667 K¨oln, Germany. 3Data Science Laboratory, ISI Foundation, Torino, Italy.
References
1. Mossong, J., Hens, N., Jit, M., Beutels, P., Auranen, K., Mikolajczyk, R., Massari, M., Salmaso, S., Tomba, G.S., Wallinga, J., Heijne, J., Sadkowska-Todys, M., Rosinska, M., Edmunds, W.J.: Social contacts and mixing patterns relevant to the spread of infectious diseases. PLOS Medicine 5(3), 1–1 (2008).
2. Danon, L., Read, J., House, T., Vernon, M., Keeling, M.: Social encounter networks: characterizing great britain. Proc. R. Soc. B 280, 20131037 (2013)
3. Eames, K., Bansal, S., Frost, S., Riley, S.: Six challenges in measuring contact networks for use in modelling. Epidemics 10, 72–77 (2015)
4. Eagle, N., (Sandy) Pentland, A.: Reality mining: sensing complex social systems. Personal and Ubiquitous Computing 10(4), 255–268 (2006). doi:10.1007/s00779-005-0046-3
5. O’Neill, E., Kostakos, V., Kindberg, T., Schiek, A., Penn, A., Fraser, D., Jones, T.: Instrumenting the city: Developing methods for observing and understanding the digital cityscape. UbiComp 2006: Ubiquitous Computing, 315–332 (2006)
6. Scherrer, A., Borgnat, P., Fleury, E., Guillaume, J.-L., Robardet, C.: Description and simulation of dynamic mobility networks. Computer Networks 52(15), 2842–2858 (2008)
7. Vu, L., Nahrstedt, K., Retika, S., Gupta, I.: Joint bluetooth/wifi scanning framework for characterizing and leveraging people movement in university campus. In: Proceedings of the 13th ACM International Conference on Modeling, Analysis, and Simulation of Wireless and Mobile Systems. MSWIM ’10, pp. 257–265. ACM, New York, NY, USA (2010). doi:10.1145/1868521.1868563. http://doi.acm.org/10.1145/1868521.1868563 8. Zhang, Y., Wang, L., Zhang, Y.-Q., Li, X.: Towards a temporal network analysis of interactive wifi users. EPL
(Europhysics Letters) 98(6), 68002 (2012)
9. Stopczynski, A., Sekara, V., Sapiezynski, P., Cuttone, A., Madsen, M.M., Larsen, J.E., Lehmann, S.: Measuring large-scale social networks with high resolution. PLOS ONE 9(4), 1–24 (2014).
doi:10.1371/journal.pone.0095978
10. Olgu´ın, D.O., Pentland, A.S.: Social sensors for automatic data collection. AMCIS 2008 Proceedings, 171 (2008)
11. Hashemian, M.S., Stanley, K.G., Osgood, N.: Flunet: Automated tracking of contacts during flu season. In: 8th International Symposium on Modeling and Optimization in Mobile, Ad Hoc, and Wireless Networks, pp. 348–353 (2010)
12. Salath´e, M., Kazandjieva, M., Lee, J.W., Levis, P., Feldman, M.W., Jones, J.H.: A high-resolution human contact network for infectious disease transmission. Proceedings of the National Academy of Sciences 107(51), 22020–22025 (2010). doi:10.1073/pnas.1009094108.http://www.pnas.org/content/107/51/22020.full.pdf
13. Cattuto, C., Van den Broeck, W., Barrat, A., Colizza, V., Pinton, J., Vespignani, A.: Dynamics of person-to-person interactions from distributed RFID sensor networks. PLOS ONE 5(7), 11596 (2010). doi:10.1371/journal.pone.0011596
14. Berke, E.M., Choudhury, T., Ali, S., Rabbi, M.: Objective measurement of sociability and activity: Mobile sensing in the community. The Annals of Family Medicine 9(4), 344–350 (2011). doi:10.1370/afm.1266.
http://www.annfammed.org/content/9/4/344.full.pdf+html
15. Lucet, J.-C., Laouenan, C., Chelius, G., Veziris, N., Lepelletier, D., Friggeri, A., Abiteboul, D., Bouvet, E., Mentre, F., Fleury, E.: Electronic sensors for assessing interactions between healthcare workers and patients under airborne precautions. PLOS ONE 7(5), 1–7 (2012). doi:10.1371/journal.pone.0037893
16. Hornbeck, T., Naylor, D., Segre, A.M., Thomas, G., Herman, T., Polgreen, P.M.: Using Sensor Networks to Study the Effect of Peripatetic Healthcare Workers on the Spread of Hospital-Associated Infections. The Journal of Infectious Diseases 206(10), 1549–1557 (2012). doi:10.1093/infdis/jis542. Accessed 2017-09-28 17. Lowery-North, D.W., Hertzberg, V.S., Elon, L., Cotsonis, G., Hilton, S.A., Vaughns, C.F. II, Hill, E., Shrestha,
A., Jo, A., Adams, N.: Measuring social contacts in the emergency department. PLOS ONE 8(8), 1–9 (2013). doi:10.1371/journal.pone.0070854
18. Toth, D.J.A., Leecaster, M., Pettey, W.B.P., Gundlapalli, A.V., Gao, H., Rainey, J.J., Uzicanin, A., Samore, M.H.: The role of heterogeneity in contact timing and duration in network models of influenza spread in schools. Journal of The Royal Society Interface 12(108), 20150279 (2015). doi:10.1098/rsif.2015.0279
19. Guclu, H., Read, J., Vukotich, C.J. Jr, Galloway, D.D., Gao, H., Rainey, J.J., Uzicanin, A., Zimmer, S.M., Cummings, D.A.T.: Social contact networks and mixing among students in K-12 schools in Pittsburgh, PA. PLOS ONE 11(3), 1–19 (2016). doi:10.1371/journal.pone.0151139
20. Blower, S., Go, M.-H.: The importance of including dynamic social networks when modeling epidemics of airborne infections: does increasing complexity increase accuracy? BMC Medicine 9(1), 88 (2011). doi:10.1186/1741-7015-9-88
21. Barrat, A., Cattuto, C., Tozzi, A.E., Vanhems, P., Voirin, N.: Measuring contact patterns with wearable sensors: methods, data characteristics and applications to data-driven simulations of infectious diseases. Clinical Microbiology and Infection 20(1), 10–16 (2014). doi:10.1111/1469-0691.12472
22. De Choudhury, M., Mason, W.A., Hofman, J.M., Watts, D.J.: Inferring relevant social networks from interpersonal communication. In: Proceedings of the 19th International Conference on World Wide Web. WWW ’10, pp. 301–310. ACM, New York, NY, USA (2010). doi:10.1145/1772690.1772722.
http://doi.acm.org/10.1145/1772690.1772722
23. Eagle, N., Pentland, A.S., Lazer, D.: Inferring friendship network structure by using mobile phone data. Proceedings of the National Academy of Sciences 106(36), 15274–15278 (2009).
doi:10.1073/pnas.0900282106.http://www.pnas.org/content/106/36/15274.full.pdf
24. Crandall, D.J., Backstrom, L., Cosley, D., Suri, S., Huttenlocher, D., Kleinberg, J.: Inferring social ties from geographic coincidences. Proceedings of the National Academy of Sciences 107(52), 22436–22441 (2010). doi:10.1073/pnas.1006155107.http://www.pnas.org/content/107/52/22436.full.pdf
25. Scholz, C., Atzmueller, M., Stumme, G., Barrat, A., Cattuto, C.: New insights and methods for predicting face-to-face contacts. In: 7th International Conference on Weblogs and Social Media (ICWSM-13) (2013) 26. Sapiezynski, P., Stopczynski, A., Wind, D.K., Leskovec, J., Lehmann, S.: Inferring person-to-person proximity
using wifi signals. Proc. ACM Interact. Mob. Wearable Ubiquitous Technol. 1(2), 24–12420 (2017). doi:10.1145/3090089
27. SocioPatterns Collaboration.www.sociopatterns.org. Accessed 18 Oct 2017
epidemic spread on temporal contact networks. Nature Communications 6, 8860 (2015). doi:10.1371/journal.pcbi.1004579
29. Sapienza, A., Barrat, A., Cattuto, C., Gauvin, L.: Estimating the outcome of spreading processes on networks with incomplete information: a mesoscale approach. ArXiv e-prints (2017).1709.01806
30. Smieszek, T., Salath´e, M.: A low-cost method to assess the epidemiological importance of individuals in controlling infectious disease outbreaks. BMC MEDICINE 11(1), 35 (2013). doi:10.1186/1741-7015-11-35
31. G´enois, M., Vestergaard, C.L., Fournet, J., Panisson, A., Bonmarin, I., Barrat, A.: Data on face-to-face contacts in an office building suggest a low-cost vaccination strategy based on community linkers. Network Science 3, 326–347 (2015). doi:10.1017/nws.2015.10
32. Vanhems, P., Barrat, A., Cattuto, C., Pinton, J.-F., Khanafer, N., R´egis, C., Kim, B.-a., Comte, B., Voirin, N.: Estimating potential infection transmission routes in hospital wards using wearable proximity sensors. PLoS ONE 8(9), 73970 (2013). doi:10.1371/journal.pone.0073970
33. Stehl´e, J., Voirin, N., Barrat, A., Cattuto, C., Isella, L., Pinton, J.-F., Quaggiotto, M., Van den Broeck, W., R´egis, C., Lina, B., Vanhems, P.: High-resolution measurements of face-to-face contact patterns in a primary school. PLoS ONE 6(8), 23176 (2011). doi:10.1371/journal.pone.0023176
34. Isella, L., Stehl´e, J., Barrat, A., Cattuto, C., Pinton, J.-F., Van den Broeck, W.: What’s in a crowd? analysis of face-to-face behavioral networks. Journal of Theoretical Biology 271(1), 166–180 (2011).
doi:10.1016/j.jtbi.2010.11.033
35. Mastrandrea, R., Fournet, J., Barrat, A.: Contact patterns in a high school: A comparison between data collected using wearable sensors, contact diaries and friendship surveys. PLoS ONE 10(9), 1–26 (2015). doi:10.1371/journal.pone.0136497
36. Stehl´e, J., Voirin, N., Barrat, A., Cattuto, C., Colizza, V., Isella, L., R´egis, C., Pinton, J.-F., Khanafer, N., Van den Broeck, W., Vanhems, P.: Simulation of an seir infectious disease model on the dynamic contact network of conference attendees. BMC Medicine 9(1), 87 (2011). doi:10.1186/1741-7015-9-87
37. M., S., M., B.L., S., G., M., R., R., C., Z., S., B., W.G., C., R.: The scaling of human interactions with city size. J. R. Soc. Interface 11, 20130789 (2014)
38. Tizzoni, M., Sun, K., Benusiglio, D., Karsai, M., Perra, N.: The scaling of human contacts and epidemic processes in metapopulation networks. Sci. Rep. 5, 15111 (2015)
39. Stopczynski, A., Pentland, A., Lehmann, S.: Physical proximity and spreading in dynamic social networks. preprint, 1509–06530 (2015)