UNIVERSITÉ DU QUEBEC
THÈSE PRÉSENTÉE À
L'UNIVERSITÉ DU QUÉBEC À TROIS-RIVIÈRES
COMME EXIGENCE PARTIELLE
DU DOCTORAT EN SCIENCES DE L'ÉNERGIE ET DES MATÉRIAUX
PAR VINEY DIXIT
STUDY OF THE EFFECT OF Zr AND 7Zr + 10Ni ADDITION ON HYDROGEN STORAGE BEHA VIOUR OF Ti-V -Cr ALLOYS
Université du Québec à Trois-Rivières
Service de la bibliothèque
Avertissement
L’auteur de ce mémoire ou de cette thèse a autorisé l’Université du Québec
à Trois-Rivières à diffuser, à des fins non lucratives, une copie de son
mémoire ou de sa thèse.
Cette diffusion n’entraîne pas une renonciation de la part de l’auteur à ses
droits de propriété intellectuelle, incluant le droit d’auteur, sur ce mémoire
ou cette thèse. Notamment, la reproduction ou la publication de la totalité
ou d’une partie importante de ce mémoire ou de cette thèse requiert son
autorisation.
UNIVERSITÉ DU QUÉBEC À TROIS-RIVIÈRES
Cette thèse a été dirigée par:
Jacques Huot, Ph.D. Université du Québec à Trois-Rivières Directeur de recherche Institution à laquelle se rattache l'évaluateur
Jury d'évaluation de la thèse:
Jacques Huot, Ph.D. Université du Québec à Trois-Rivières
Prénom et nom, grade Institution à laquelle se rattache l'évaluateur
Jacques Goyette, Ph.D. Université du Québec à Trois-Rivières Prénom et nom, grade Institution à laquelle se rattache l'évaluateur
Ning Chen, Ph.D. University of Saskatchewan - Canadian Light Source Prénom et nom, grade Institution à laquelle se rattache l'évaluateur
Sadesh Natarajan, Ph.D. Université du Québec à Trois-Rivières Prénom et nom, grade Institution à laquelle se rattache l'évaluateur
ABSTRACT
This tli.esis reports the investigation on the role of the additives 7Zr+ 1 ONi and Zr on the crystal structure, microstructure and first hydrogenation behavior of Tix V 70-xCr30 (x= 1
°
to 50) alloys. By keeping the Cr content constant and varying the relative proportion of Ti and V, the effect of TiN ratio on hydrogen storage properties was also studied. In the case of 7Zr+ 1 ONi additive, ail alloys were multiphase with a main bcc phase and with secondary phases that were Zr, Ni rich. From the hydrogen measurements it was found that the absorption capacity of the alloys was increasing with higher Ti-content and that the additive enhances the first hydrogenation kinetics.The effect of the Zr additive was studied on the same alloys compositions Tix V 70-xCr30 (x= lOto 50). The microstructure of these alloys also showed the presence of a matrix, bright and black phases. The chemical composition of these phases was found to be different tha~ those phases which were observed for 7Zr+10Ni added alloys. X-ray patterns revealed that ail ofthese alloys were bcc before hydrogenation. For alloy x = 30 and 40, metastables Ti-Zr and Ti phases were also observed along with bcc phase. Upon hydrogenation, bcc phase transformed into fcc and bct phase. Only for alloy x = 40, single fcc phase was seen. The volume of the hydrogen in the fcc phase was found to decrease with increasing lattice parameters of the bcc phase. The hydrogen absorption capacity of these alloys increased with higher Ti content. For alloy x= 50, maximum absorption 3.7 wt. % was achieved. Absorption kinetics of these alloys was found to be very slow compared to the absorption kinetics of 7Zr+ 1 ONi added alloys.
Alloy x = 50, showed the maximum absorption capacity and as 7Zr+ 1 ONi was found to be a better additive than Zr, further investigation was performed on theTiso V 20Cr30 alloy added with 7Zr+ 1 ONi. X -ray pattern showed that this alloy had a single fcc phase after hydrogenation. In order to study the hydride phase and to locate the hydrogen atom in the crystal structure, in-situ neutron diffraction was performed on fully deuterated alloy. Neutron diffraction patterns were taken white heating the sample from 122
Oc
to 266 oC. Rietveld's refinement of the deuterated alloy identified the fcc phase as the main phase. Linear thermal expansion and lattice parameter of fcc phase were measured for the first time.To understand the microstructure ofthese alloys, the matrix and secondary phases of the alloy Tiso V 20Cr30 with 7Zr+1 ONi additive were studied individually. These matrix and bright phases were synthesized by using the same elemental composition seen in EDS and labelled as 50TiM and 50TiBP. Microstructure of 50TiM was found similar to the TisoV20Cr30 but 50TiBP showed a different microstructure with a different phase composition. Alloy 50TiM showed a higher absorption capacity than 50TiBP. On the other hand, 50TiBP showed a faster absorption kinetics than 50TiM. This seems to confirm the hypothesis that the secondary phase acts as a gateway for hydrogen to enter the matrix phase.
Effect of the hydrogen atom on local environment of 50TiBP before and after hydrogenation was studied by using EXAFS. Ali the measurements were done at the Ti-K edge. Normalized EXAFS spectra and R space fitting showed that electronic structure of Ti- atom changed after hydrogenation.
RÉSUMÉ
Cette thèse rapporte l'étude du rôle des additifs 7Zr
+
10Ni et Zr sur la structure cristalline, la microstructure et le comportement de la première hydrogénation des alliages TixV7o-xCr3o (x= 10
à 50). En maintenant la teneur en Cr constante et en faisant varier la proportion relative de Ti et de V, on a également étudié l'effet du rapport Ti / V sur les propriétés de stockage de l'hydrogène. Dans le cas de l'additif 7Zr+
10Ni, tous les alliages étaient multiphases avec une phase principale cubique centrée (cc) et des phases secondaires riches en Zr et Ni. Les mesures de l'hydrogène ont montré que la capacité d'absorption des alliages augmentait avec une teneur en Ti plus élevée et que l'additif renforçait la cinétique de la première hydrogénation.L'effet de l'additif Zr a été étudié sur les mêmes compositions d'alliages TixV7o-xCr3o (x
=
10 à 50). La microstructure de ces alliages a également montré la présence d'une matrice, de phases brillantes et noires. La composition chimique de ces phases s'est révélée différente de celle des phases observées pour les alliages ajoutés 7Zr+
10Ni. Les diagrammes de diffraction X ont révélé que tous ces alliages présentaient la phase cc avant l'hydrogénation. Pour les alliages x=
30 et 40, des phases métastables de Ti-Zr et Ti ont également été observés conjointement avec la phase cc. Lors de l'hydrogénation, la phase ~c s'est transformée en phase cubique à face centrée (cfc) et tétragonale centrée (tc). Seulement pour l'alliage x=
40, une seule phase cfc a été observée. Il a été constaté que le volume de l'hydrogène dans la phase cfc diminuait avec l'augmentation des paramètres de réseau de la phase cc. La capacité d'absorption d'hydrogène de ces alliages augmentait avec la teneur en Ti. Pour l'alliage x=
50, une absorption maximale de 3,7% en poids a été atteinte. La cinétique d'absorption de ces alliages s'est avérée très lente comparée à la cinétique d'absorption des alliages avec l'additif7Zr+
10Ni.L'alliage x = 50 a montré la capacité d'absorption maximale et, étant donné que 7Zr
+
10Ni s'est avéré être un meilleur additif que le Zr, un complément d'étude a été effectué sur l'alliage Ti50V2oCr3o additionné de 7Zr+
10Ni. Le diagramme de rayons X a montré que cet alliage avait une seule phase fcc après l'hydrogénation. Afin d'étudier la phase hydrure et de localiser l'atome d'hydrogène dans la structure cristalline, une diffraction in situ sur neutrons a été réalisée sur un alliage entièrement deutéré. Des diagrammes dediffraction des neutrons ont été pris tout en chauffant l'échantillon de 122 oC à 266 oC. L'affinement Rietveld de l'alliage deutéré a identifié la phase cfc comme étant la phase principale. La dilatation thermique linéaire et le paramètre de réseau de la phase cfc ont été mesurés pour la première fois.
Pour comprendre la microstructure de ces alliages, la matrice et les phases secondaires de l'alliage Ti50 V 20Cr30 avec l'additif 7Zr + 10Ni ont été étudiées individuellement. Ces phases matricielles et brillantes ont été synthétisées en utilisant la même composition élémentaire que celle trouvée dans l'EDS et sont étiquetées respectivement 50TiM et 50TiBP. La microstructure de l'alliage 50TiM a été identifiée comme étant similaire à celle de l'alliage Ti50 V 20Cr30. Cependant, la microstructure du 50TiBP est différente de celle de l'alliage et a une composition chimique différente. L'alliage 50TiM a montré une capacité d'absorption supérieure à celle du 50TiBP. D'autre part, 50TiBP a montré une cinétique d'absorption plus rapide que le 50TiM. Cela semble confirmer l'hypothèse selon laquelle la phase secondaire sert de passerelle pour que l'hydrogène entre dans la phase matricielle.
L'effet de l'atome d'hydrogène sur l'environnement local de 50TiBP avant et après l'hydrogénation a été étudié à l'aide d'EXAFS. Toutes les mesures ont été effectuées sur le bord Ti-K. Les spectres EXAFS normalisés et l'ajustement de l'espace R ont montré que la structure électronique de l'atome de Ti changeait après l'hydrogénation.
ACKNOWLEDGEMENT
Firstly, 1 would like to express my deep gratitude towards my supervisor Prof. Jacques Huot, for giving me Ph.D. position. He is a wonderful person with patience and immense knowledge. This work wou Id not have been possible without his advice and support. 1 hope 1 will be helpful in my life by passing on his valuable pieces of advice. 1 also express my thanks to the rest of my thesis committee: Dr. Ning Chen, Prof. Jaeques Goyette and Dr. Sadesh Natrajan. 1 would like to extend my sincere thanks to Canada government and Queen Elizabeth II Diamond Jubilee Scholarship for giving me financial support. My Ph.D journey was not only limited to lab, even 1 visited sorne beautiful places of Canada and Europe, these visits taught me a lot. As part of the journey 1 also participated in sorne social and cultural activities which enhanced my
self-confidence and communication skills. 1 am really thankful to QES for giving me these great experiences.
1 am thankful to ail of my lab partners for making my life joyful and easy. 1 remember ail those celebrations we had in Chasse galerie and Gambrinus. Salma, 1 will always remember those coffee cups that we had together. You were like a family to me who helped me in tough times. Marc Antony, you gave a new energy to our lab, thank you so much for making me laugh. Thank you Babak, for the moral support and for the nice trip in Ottawa and Mexico.
Thank you Meraj for being su ch a good company and having healthy discussions. Thank you, Peng Lyu, Amol, Sabrine, Natalia, Volatiana, Chourouk, Francia, Priyanka for the wonderful times. 1 had memorable moments with ail of you. 1 will keep ail of these memories in my heart. 1 am really grateful to be part of Jacques group and having you ail in my life.
l'm also thankful to my friends who were not in the lab but always gave me moral support. Thank you Mihira, for giving me new hope and energy to work. Thank you Apama, Prateek, Madina, Vani, Shree priya, Bharti, Amit, and Shashank for the moral support.
At the end, 1 would like ta dedicate my Ph.D. ta my Parents and ta my sister. Vou were my strength here. Thank you sa much for giving me this wonderful life and for encouraging me in every step of my life.
Table of Contents
ABSTRACT ... .iii
RÉsuMÉ ... v
ACKNOWLEDGEMENT ... vii
LIST OF FIGURES ... xii
LIST OF TABLES ... xvi
SECTION A ... 1
Chapter.l ... 2
Introduction of Hydrogen Economy and Hydrogen storage Materials ... 2
l. 1 Introduction of Hydrogen Economy ... 2
1.1.1 Hydrogen Production and Storage ... 3
1.2 Hydrogen Storage in Metal hydrides ... 5
l.2.1 Hydrogen Storage in body centred solid solution alloys ... 8
l.2.2 Hydrogenation characteristics of bcc alloy ... 8
1.2.3 Laves phase related bcc solid solution ... 10
1.3 Aim and structure of the thesis ... Il Chapter 2 ... 12
Description of the Experimental Techniques used for Material Synthesis and Characterization ... 12
2.1 Alloy synthesis by arc-melting ... 12
2.2 X-ray Diffraction ... 13
2.3 Scanning Electron Microscopy ... 17
2.3.1 Secondary electron emission mode ... 18
2.3.2 Backscattered electrons mode ... 18
2.3.3 Energy Dispersive X-ray analysis ... 18
2.4 Extended X-ray absorption fine structure Spectroscopy ... 19
2.4.1 EXAFS Principle ... 20
2.5 Sievert's type apparatus for hydrogen measurements ... 22
2.6 Neutron Diffraction ... 23
Structural, microstructural and hydrogenation characteristics of Ti-V -Cr alloy added
with Zr-Ni ... 27
3.1 Introduction ... 27
3.2 Results and discussion ... ' ... 27
3.2.1 Morphology ... 28
3.2.2 Crystal Structure ... 33
3.2.3 First Hydrogenation ... 36
3.2.4 Pressure composition temperature (PCT) ... .40
3.3 Conclusions ... 41
Chapter 4 ... 43
Investigation of the microstructure, crystal structure and hydrogenation kinetics ofTi-V-Cr alloy with Zr addition ... 43
4.1 Introduction ... 43
4.2 Results and Discussion ... 43
4.2.1 Morphology ... 43
4.2.2 Crystal Structure ... 49
4.2.3 First Hydrogenation ... 51
4.2.4 Comparison between Zr and 7Zr+ 1 ONi additive ... 56
4.3 Conclusions ... 57
Chapter 5 ... 59
Neutron, and EXAFS studies ofTisoV20Cr30 added with 4wt. % of 7Zr+l ONi ... 59
5.1 Introduction ... 59
5.2. Neutron study on TisoV20Cr30 ... 60
5.3 Results and discussion of 50TiM and 50TiBP ... 64
5.3. 1 Morphology of50TiM and 50TiBP ... 65
5.3.2 First Hydrogenation ... 68
5.3.3 EXAFS ... 69
5.4 Conclusions ... 70
Chapter 6 ... 72
Conclusion and future work ... 72
6.2 Future work ... 73 SECTION B ... 74 Articles ... 75 Article 1 ... 76 Article 2 ... 83 REFERENCES: ... 102
LIST OF FIGURES
Fig 1.1 Pressure composition temperature (PCT isotherm) ... .
Fig. 1.2 PCT diagram of V metal. ... ..
Fig 2.1 Arc-melting machine ... .
Fig 2.2 Schematic diagram ofX-ray diffractometer ... .
Fig 2.3 The Bragg-Brentano Parafocusing Circles of a X- ray goniometer ... .
Fig 2.4 Types of the interaction of electron beam while incident on the
specimen ... ..
Fig.2.5 Schematic diagram ofEXAFS ... .
Fig.2.6 Schematic presentation ofX-ray absorption spectrum ... ..
Fig 2.7 Schematic illustration ofEXAFS phenomenon ... ..
Fig.2.8 Homemade Sievert's type apparatus ... ..
Fig.2.9 Different scattering length as a function of atomic weight. ... ..
Fig.2.l0 A schematic diagram of the constant wave length diffractometer ....
Fig.2.ll. A schematic presentation of neutron diffraction pattern ... ..
Fig 3.1 Backscattered electron micrograph and elemental probe analysis of
7 9 13 14 16 17 19 20 21 22 25 26 26 Tix V 70-xCr30 (x
= 10, 20).
... . . . . .. . .. . . .. . . .. . . .. . . .... 28Fig 3.2 Backscattered electfOn micrograph and elemental probe analysis of
Fig 3.3 Chemical analysis of the elements in Matrix (a) and Bright phase (b) with varying Ti concentration x... 33
Fig.3.4 XRD pattern of the Tix V 70-xCr30 (x = 10, 20, 30, 40, 50) alloys with additive in (a) as-cast and (b) hydrided state... 34
Fig.3.5 Plot oflattice parameter and average atomic radius as a function of Ti concentration (x). The straight line is a linear fit of the experimental points... 36
Fig.3.6 Activation curve of the TixV70-xCr30 (x = 10, 20, 30, 40, 50) alloys with additive, under 2 MPa ofhydrogen at 22 oC... 37
Fig.3.7 Ti-content versus lattice parameter and absorption capacity of Tix V 70 -xCr30 (x = 10 to 50)... ... ... ... ... .... 37
Fig.3.8 Desorption PCT curves of TixV70-xCr30 ( x= 40,50) alloy added with 4 wt.% of7Zr+l0Ni at 150°C... 41
Fig.4.1: Backscattered electrons micrograph of the alloys Tix V 70-xCr30 (x = 10,20,30,40,50), added with 4 wt.% of Zr. ... ... ... ... 44
Fig.4.2: Higher magnification backscattered electrons micrograph of the alloys Tix V 70-xCr30 (x = 10, 20, 30, 40, 50), added with 4 wt. % of Zr... ... 45
Fig.4.3. Chemical analysis of the elements in Matrix (a) and Bright phase (b)
with varying Ti concentration x... 48
Fig.4.4 XRD pattern of Tix V 70-xCr30 (x = 1
°
to 50) alloys added with 4 wt. % of Zr in (a) as-cast and (b) hydride state... 49Fig.4.5: Lattice parameter and average atomic radius of bcc phase as a function of Ti-content (x)... 51
Fig.4.6. Activation curve of the Tix V 70-xCr30 (x
=
10, 20, 30, 40, 50) alloysadded with 4 wt. % of Zr, under 20 bar of hydrogen at 22 oC... 52
Fig 4.7: For Tix V70-xCr30 (x
=
20 to 50) alloy, volume ofhydrogen atom infcc phase... 55
Fig.4.8: First hydrogenation kinetics ofTi4o V30Cr30 alloy (a) without additive (b) with 4 wt.% of Zr (c) with 4 wt.% of7Zr+lONi, under 20 bar ofhydrogen at 22 oC... 57
Fig.5.1: Desorption neutron diffraction pattern of fully deuterated
Ti50 V 20Cr30 alloy ... 63
Fig.5.2 Relation between (a) fcc lattice parameter, D-occupancy versus
Fig.5.3: Backscattered electron micrographs of50TiM Ca) and 50TiBP (b)
65
Fig.5.4: Activations curves of the 50TiBP and 50TiM, under 20 bars of
hydrogen at 22
oC...
... ...
69Fig.5.5: EXAFS spectra at Ti K edge for the 50TiBP in as-cast hydrogenated and desorbed state. (a) Normalized EXAFS spectra Cb) R space oscillations... 70
LIST OF TABLES
Table 1.1 Combustion and explosion properties ofhydrogen, methane and
gasoline fuels... 3
Table 1.2: Hydrogen storage technologies... 4
Table 3.1 Nominal and measured atomic percentage ofthe as-cast sample
TilOV60 Cr30 .. Error on the measured values is ±0.5 at.% ... 29 Table 3.2 Nominal and measured atomic percentage ofthe as-cast sample
ThoV50 Cr30. Error on the measured values is ±0.5 at.%... 29
Table 3.3 Nominal and measured atomic percentage ofthe as-cast sample
Tbo V 40 Cr30. Error on the measured values is ±0.5 at... ... 31
Table 3.4 Nominal and measured atomic percentage ofthe as-cast sample
Ti40 V 30 Cr30. Error on the measured values is ±0.5 at. %... 31
Table 3.5 Nominal and measured atomic percentage of the as-cast sample
Ti5oV20 Cr30. Error on the measured values is ±0.5 at.%... 32
Table.3.6 Percentage of the observed phases for the alloy Tix V 70-xCr30 (x =
10 to 50), added with 7Zr+10Ni, as calculated by Image j. Number in
parentheses is the uncertainty on the last significant digit... 32
Table.3.7 Crystal parameters of the TixV70-xCr30 (x= 10 to 50) alloys in
as-cast state. Number in parentheses is the uncertainties on the last significant
digit... 35
Table.3.8 Crystal parameters of the TixV70-xCr30 ( x= 10 to 50) alloys in
hydrided state. Number in parentheses is the uncertainties on the last
Table.3.9 Calculated and experimentally obtained storage capacity of each
alloy. Number in parentheses is the uncertainties on the last significant digit.. 40
Table 4.1: Percentage of the observed phases for the alloy Tix V 70-xCr30 ( x=
10 to 50) added with 4 wt.% of Zr, as determined by imagej. Error on the
measured values is ±0.5 at.%. For inhomogeneous phases, the higher/lower
values are indicated... 45
Table 4.2: Nominal and measured atomic percentage of the as-cast samples
TilOV60Cr30 added with4 wt.% of Zr. Error on measured value is ±0.5 at.%.. 46
Table 4.3: Nominal and measured atomic percentage of the as-cast samples
ThoVsoCr3o added with4 wt.% of Zr. Error on measured value is ±0.5 at.%.. 46
Table 4.4: Nominal and measured atomic percentage ofthe as-cast samples
TboV4oCr3o added with4 wt.% of Zr. Error on measured value is ±0.5 at.%... 47
Table 4.5: Nominal and measured atomic percentage of the as-cast samples
Ti40 V30 Cr30 added with4 wt.% of Zr. Error on measured value is ±0.5 at.%.. 47
Table 4.6: Nominal and measured atomic percentage of the as-cast samples
Tiso V20 Cr30 added with4 wt.% of Zr. Error on measured value is ±0.5 at.%.. 48
Table 4.7: Crystal parameters ofTixV7o_xCr3o (x = 10 to 50) alloy added with
4 wt.% of Zr. Number in the parenthesis is the error on the last significant
digit... .... 50
Table 4.8: Crystal parameter of TixV7o_xCr3o (x = 10 to 50) alloy added with 4
wt.% of Zr in hydride state. Numbers in parentheses is the error on the last
significant digit... 53
Table 5.2 Nominal and measured atomic percentage of the 50TiM. Error on the measured values is ±O.5... 66 Table 5.3 Nominal and measured atomic percentage of the 50TiBP. Error on the measured values is ±O.5... 67 Table.5.4 Percentage of the observed phases for the alloy 50TiM and
50TiBP, as calculated by Image j. Number in parentheses is the uncertainty on the last significant digit... 67
Chapter.l
Introduction of Hydrogen Economy and Hydrogen storage Materials
1. 1 Introduction of Hydrogen Economy
Constant use of hydrocarbon fuels is responsible, to a large extent, for air pollution and global warming. Hydrogen as an energy vector is a promising way to solve these environmental issues [1]. It could be used in conjunction with renewable energies,
mainly solar and wind. Transportation and storage of these energy sources is a problem which could be solved by using hydrogen as energy storage and/or energy vector [2]. Hydrogen has a wide range of other utilization in the energy field su ch as in heat storage,
isotope separation, Ni-MH batteries, heat actuators, etc.
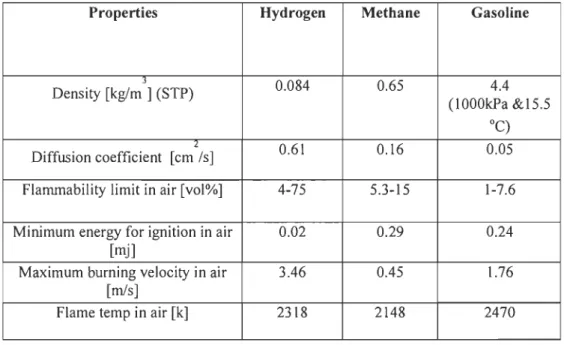
Hydrogen is colourless, tasteless, odourless, nontoxic, nonmetallic and highly combustible diatomic gas at ambient temperature and pressure[l]. Hydrogen is the most abundant element in the universe but on the earth, hydrogen exists only in molecular form su ch as water and molecular compound. It should thus be extracted from these compounds in sorne way. Combustion and explosion properties of hydrogen are compared with the methane and gasoline fuels in table 1.1 [3]. It can be seen from the table that hydrogen has very sm aIl density (0.084 kg/m3) compared to the other natural
gases. It means that to store only 1 kg of hydrogen at ambient pressure, a volume of II.9 m3 is required. Hydrogen has very low critical temperature (Tc
=
30.0K), high diffusivity, wide range of flammability and high burning velocity compared to other natural gases[3]. Hydrogen combustion is completely carbon free and gives a gravimetric energy density between 120 MJ/kg and 142 MJ/kg which is three times higher than the gravimetric energy density ofpetroleum [4]. Hydrogen ignition energy is only 0.017 mJ for mixtures with air, which is smaller than the other hydrocarbon fuels,Properties Hydrogen Methane Gasoline Density [kg/m J ] (STP) 0.084 0.65 4.4 (lOOOkPa &15.5 oC) l 0.61 0.16 0.05 Diffusion coefficient [cm /s]
Flammability limit in air [vol%] 4-75 5.3-15 1-7.6
Minimum energy for ignition in air 0.02 0.29 0.24
[mj]
Maximum burning velocity in air 3.46 0.45 1.76
[mis]
Flame temp in air [k] 2318 2148 2470
Table 1.1 Combustion and explosion properties ofhydrogen, methane and gasoline fuels.
1.1.1 Hydrogen Production and Storage
There are several methods to produce hydrogen such as: electrolysis and thermolysis but currently the method mostly used by the industry is steam reforming [5]. Natural gases are the cheapest source for hydrogen production, but the major byproducts of this process are CO2, CO and other greenhouse gasses. Hydrogen production by electrolysis method is a clean means of production but it consumes a huge amount of electricity which is itself a big issue.
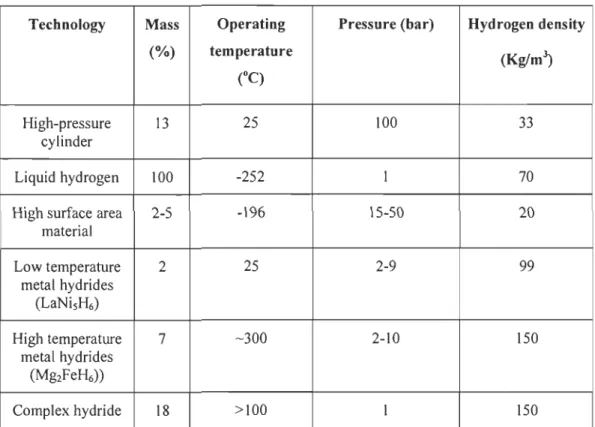
On the other hand, due to the low hydrogen density (0.089 grnll), hydrogen storage is also an important challenge. There are pre senti y three main techniques for hydrogen storage: high pressure, cryogenies and solid state [1]. These technologies are reported in table 1.2 with their typical operating temperature and pressure [3].
Technology Mass Operating Pressure (bar) Hydrogen density (%) temperature (Kg/ml)
eC)
High-pressure 13 25 100 33 cylinder Liquid hydrogen 100 -252 1 70High surface area 2-5 -196 15-50 20
material
Low tempe rature 2 25 2-9 99
metal hydrides (LaNisH6)
High temperature 7 -300 2-10 150
metal hydrides (Mg2FeH6
»
Complex hydride 18 >100 1
ISO
Table 1.2: Hydrogen storage technologies
High pressure storage method is presently the most commonly used method. The conventional steel cylinders are operated at maximum 200 bar pressure. For mobile applications, their size and weight make them impractical [6]. However, light weight composite gas cylinders have been developed and are now used in mobile applications. They can sustain up to 700 bars of pressure, but they are more expensive than the conventional steel cylinders.
For the cryogenie storage, very low temperature «-253°C) and super insulating containers are required which makes this method very expensive. However, this is the method used to transport large quantities of hydrogen over long distances when hydrogen pipeline is not available.
Hydrogen storage in solid state materials is a promising and convenient way to replace high pressure and cryogenie storage [1] . There are two different routes for the solid-state hydrogen storage. The first is in which molecular hydrogen interacts with the
surface of the material with the weak Van der Walls force (physisorption) and the second is in which chemical interaction (chemisorption) of the atomic hydrogen takes place with simple or complex metallic alloys. Physisorption or adsorption is a surface phenomenon which occurs at very low temperature (-195 oC). This type of interaction leads the low adsorption enthalpy which lies between 1 and 10 kJ/mol. The main focus of this thesis being on chemisorption, the following discussion will be limited to this storage technique.
1.2 Hydrogen Storage in Metal hydrides
Metal hydrides have been studied for several applications such as for gas separation and purification, temperature sensing, thermal compression, and refrigeration. However, the main application for metal hydrides is hydrogen storage [7-9]. Depending upon the bonding between hydrogen and metal atom, hydrides are c1assified as ionic hydride,
covalent hydride and metallic hydrides [10]. Most of the hydrides studied for hydrogen storage are metallic hydrides [11]. In metallic hydrides, hydrogen atoms interact with metal atoms and make a metallic bond.
1.2.1 Thermodynamics of Metal Hydrides or Pressure composition Temperature (peT)
Many metals and alloys react with hydrogen according to the following schematic reaction:
x
M
+ -
2 H2 ~ MHx+
Q (1.1)Here M is a metal, solid solution alloy or intermetallic compound, MHx is a hydride, x is the metal to hydrogen ratio and Q is the heat ofthe reaction[1 0].
When a metal is in contact with hydrogen, the hydrogen molecule firstly interacts with the surface through weak Van-der Walls interaction which is known as the physisorption phenomenon. In the case of metal hydride formation, hydrogen overcomes the activation barrier and molecular hydrogen dissociate into hydrogen atoms. After this dissociation,
solution which is known as the a phase. This is schematically represented in figure 1.1. With increasing pressure, the hydrogen concentration increases and at the plateau pressure there is nucleation of the hydride phase. This phase is usually called the ~ phase. In the plateau region a and ~ phases coexist, and the length of this plateau region gives us information about the reversible capacity of the hydride. At the plateau region,
the total number of phases are three (a, ~ and hydrogen gas) and total number of components are two (metal and hydrogen). Phase formation in metal hydride system can be understood by the Gibb's phase rule which is:
F
=
C - P+
2 (1.2)where, F is the degree of freedom, C is the number of components and P is the number of phases.
...
-
... . / ... T.>T,!
ex pha~: T3>T2/
ex+{} phaseHlM
ratio
.
a-phase
-...
-, .,.
-
tI" _ _
,
-
,
---
..
i::lIIC~~ l [ L (, ~""
... ~000Ir CK ') f3 phase~-phase
- -.
14
~
...
....
'
Iiiji ioiiil lIiiI Ijji ioiiil
..
..
Fig 1.1 Pressure composition temperature (peT isotherm)
.JI
J Jt
'lit
-Referring to figure 1.1 and according to the Gibb's rule when the a and ~ phases coexistthere is just one degree of freedom thus giving a plateau region in the pressure-composition diagram. In a and ~ regions, the total degree of freedom is 2. Therefore, in the se regions, hydrogen concentration rises with increasing hydrogen pressure.
As the temperature increases, the plateau pressure of the hydride also increases and at a certain temperature the plateau region completely disappears. This temperature is known as the critical temperature of the hydride. Therefore below the critical temperature, by taking the middle point of the plateau region of each isotherm a graph InP eq versus
ur
can be plotted. This graph is known as Van't Hoff plot by which enthalpy MI and entropy ~S of the hydride are calculated. According to the Van't Hofflaw [10]:
ÂH !::..S
InP = - - - (1.3)
eq RT R
Here enthalpy and entropy are the slope and intercept of the straight line plotting InP eq
versus
ur
[10]. P eq is the equilibrium hydrogen pressure, T is the thermodynamictemperature and R is the gas constant (8.3145 J/K mol).
1.2.1 Hydrogen Storage in body centred solid solution alloys
A solid solution alloy is formed by dissolving the one or more solute elements into a solvent element [12]. For solid solution formation, it is not necessary to have a stoichiometric or near stoichiometric alloy composition.
For hydrogen storage applications, various compositional solid solution alloys such as Pd, Ti and Zr based alloys have been studied [13-17]. In 1982, Ono et.al reported the hydrogen absorption properties of Ti-V solid solution alloy [18]. They measured the pressure composition temperature (PCT) curve of TioA VO.6 alloy and observed that this
alloy took a very long time to attain the equilibrium pressure [19]. This measurement emphasized on the slow reaction rate ofthis alloy. Therefore, due to their slow reaction rate, Ti-V -based alloy was not found suitable for practical application. In 1988, Libowitz and Maeland investigated the effect of the addition of transition elements (Fe, Mn, Cr, Co, Ni) in Ti-V -based alloy and observed that addition of a third element improves the hydrogenation kinetics [20, 21].
1.2.2 Hydrogenation characteristics of bec alloy
Generally in the PCT isotherm of body centred metal and alloys, two plateaus are present [10]. As an example, the pressure composition isotherm of vanadium is shown in
figure 1.2 [19]. Vanadium shows two plateaus at two different equilibrium pressure [19]. Equilibrium pressure of the first plateau, corresponding to the monohydride, is 0.1 Pa at 80 oC as seen in figure 1.2 (a) [22]. The second plateau which is due to the formation of the dihydride is at much higher pressure; for example, 2 MPa at 78 oC as shown in figure 1.2 (b) [22] . '.0 T 5.0
...
4.0..
~78°C 3.0•
2.0..
l
II..
..
J
5 ·3.0 "" -4.0 (a) (b) -5.0 0.0 0.1 0.2 0.3 0.4 0.5 0.6 0.7 0.8 O •• 0.8 1.0 t.2 1.4 1.6 1.8 2.0AIOmIo RatIo X • HIV AIomIc RIUo X .. HIV
Fig.1.2 peT diagram of V metaL
As the plateau of the monohydride phase is usually at a pressure mu ch lower than one bar, this makes it impossible to desorb in most practical applications. The dihydride plateau is at mu ch higher pressure and this phase could be desorbed under a few bars of hydrogen pressure. Reversible capacity is defined by the capacity that could be absorbed and desorbed under the operational conditions of the hydride tank. Therefore, two plateaus in PCT are undesirable.
Besides two plateaus in PCT, difficulty in first hydrogenation (activation) is also an important problem with these alloys. Generally, the surface of the alloy is covered by an oxide layer. During the activation, hydrogen has to break the oxide layer to be absorbed in the bulk of the alloy [23]. To solve the activation problem, heat treatment between 300 and 750
O
c
is usually required for bcc alloys which is not desirable for practical applications [24, 25].For utilization ofbcc alloys for hydrogen storage, the destabilization of the monohydride (in order to improve the reversible capacity) and making the activation possible at room temperature are two important aspects that have to be improved.
1.2.3 Laves phase related bec solid solution
In 1995 Tsukahara et al. studied the V -based multi-phase alloys to make the electrodes for Ni-metal hydride batteries and observed different phases for the different alloy composition [26-29]. For TiV3Nio.56Hfx, (x = 0.046, 0.24) alloy they observed the
presence ofbcc phase with CI4 laves phase [28]. They. found that the combined effect of bcc and C14 laves phases was helpful to obtain higher electrode capacity.
Iba and Akiba in 1997 reported that alloys having a bcc solid solution phase along with Laves phases are very promising for hydrogen storage and they named these kind of bcc phase 'Laves phase related bcc solid solution' to distinguish them from simple bcc phase that is observed in Ti-V system [19]. In their study, they found that Ti-V-Cr alloys have smaller hysteresis th an Ti-V -Mn alloys which makes them more suitable for the practical application [19].
It was reported that Ti-V-Cr alloys absorb up to 3.7 wt.% of hydrogen, but their reversible capacity is around 2.4 wt.% [18, 30, 31]. In order to see the effect of additional phase on sorption kinetics of bcc alloy, Miraglia et al. remelted Ti-V -Cr bcc alloy with 4 wt.% of Zr7NilO [23]. They reported that due to the addition of Zr7NilO, a secondary phase was formed which made the activation possible without prior heat treatment.
Activation kinetics and storage capacity are also affected by the differences in chemical composition. Many groups have studied the effect of different elementary composition on the hydrogenation characteristics of bcc alloys and reported that variation in chemical composition has a direct effect on the plateau pressure and sorption kinetics [19, 31-33]. Yu et al. studied the effect of V-content in Ti-V-Cr-Mn alloy [34]. They found that a higher proportion of vanadium increased the hydrogen capacity, but this made the first hydrogenation much slower.
1.3 Aim and structure of the thesis
The main objective of the thesis is to understand the effect of 7Zr+ 1 ONi and Zr, additives on the microstructure and hydrogen storage properties of Ti-V -Cr alloy. Another objective of this thesis is to study the effect of TiN ratio on the hydrogen capacity and first hydrogenation behaviour. The reason for changing the TiN ratio is that vanadium is an expensive element. Thus, it is advisable to optimize the TiN ratio to obtain the highest hydrogen capacity for the lowest possible vanadium content.
The thesis is made of five chapters. In this first chapter the introduction and basic idea of the research were given. In the second chapter, details of ail the experimental techniques are reported. In the third chapter, the effect of 7Zr+ l ONi on Tix V 70-xCr30 is discussed. In the fourth chapter, the effect of the addition of Zr on Ti-V -Cr alloy is shown. In the fifth chapter neutron, and EXAFS studies on Tiso V20Cr30 alloy added with 4wt.% of 7Zr+ l ONi are reported.
Chapter 2
Description of the Experimental Techniques used for Material
Synthesis and Characterization
This chapter presents ail the experimental techniques that have been used for material synthesis and characterization. Namely:
(i) Arc melting for the synthesis of the Ti-V-Cr alloys.
(ii) X-ray diffraction for the characterization of the crystal structure of the alloys. (iii) Scanning Electron Microscopy (SEM) and associated Energy Dispersive Spectroscopy (EDS) for the microstructure and elemental composition of the alloys. (iv) Extended X-ray Absorption Fine Structure spectroscopy (EXAFS) used to determine the local atomic structure of the alloy .
(vi) Sievert's type apparatus for measuring the hydrogenation properties.
(vii) Neutron diffraction for the phase identification and localization ofhydrogen in the crystal structure.
2.1 Alloy synthesis by arc-melting
Ali raw elements Ti (99.9%), V (99.7%), Cr (99%), Zr (99.2%) and Ni (99.9 %) were purchased from Alfa-Aesar. Ali syntheses were done by mixing the raw elements in the desired propOltion and melting them together.
Arc-melting is a technique which is used in laboratories and industries for alloy synthesis. In order to melt the alloy, heat is produced by generating an electric arc between a tungsten electrode and a copper crucible. Initially, ail the raw elements are placed on the water chilled copper crucible, then the chamber is evacuated and refilled by the argon. This process is repeated three times to remove ail air from the melting chamber.
Fig 2.1 Arc-melting machine
After the final evacuation, a partial pressure of 0.7 bar of argon is established in the melting cham ber. To generate the arc, the tungsten electrode is kept very close to the sam pIe. Once the arc is generated, tungsten electrodes moved up and down to melt ail parts of the sample. This gives high enough temperature to melt the metals and form an alloy. For the Ti-V -Cr alloys, a current of 45 amperes was used. After melting, when the melted alloy is solidified, it is turned over and remelted. This pro cess is repeated three times to make a homogeneous alloy. Figure 2.1 shows the picture of the arc-melting apparatus.
2.2 X-ray Diffraction
X-ray diffraction is used to study the crystal structure of the alloys. For the present study, we used a Bruker D8 Focus X-ray diffractometer having a Bragg-Brentano configuration and with CuKa (Â-a
=
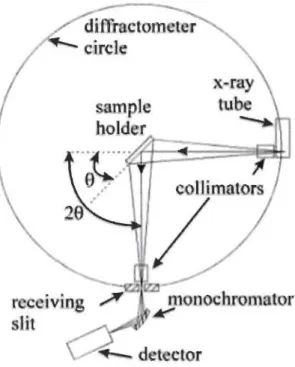
1.54 A) radiation. The crystal structure parameters were evaluated from Rietveld refinement by using Topas software [35]. A schematic diagram ofthe X-ray goniometer is shown in figure 2.2.~
8tmtr
~ciIcler
Fig 2.2 Schematic diagram of the X-ray diffractometer
Figure 2.2 shows the main components ofaX-ray diffractometer : X-ray tube for production of X-ray; slits in order to collimate the X-ray beam; monochromator; to select the wavelength; sample holder; X-ray detector [36]. In the X-ray tube, a tungsten filament and a metal target are arranged in such a way that the metal target is maintained at ground potential and the tungsten filament at negatively high potential. When the tungsten filament is heated up by the filament current a stream of electrons are emitted from the filament and accelerated towards the target [37].These electrons hit the metal target and produce X-ray. Most of the kinetic energy of the electrons is transformed into heat. Therefore, to prevent the metal target from melting, cold water circulation is used. X-ray produced in the X-ray tube contains strong Ka line with weak KJ3 line. This KJ3
component is undesirable and to decrease the intensity of this component relative to the
Ka, a filter is used. The filter material is usually in the form of foil. Choice of the filter depends on the metal target. For Cu metal target, a Ni filter is used.
For the diffraction phenomenon, X-ray beam incident on the sample, interact with the electron cloud surrounding the atom and are scattered. These scattered X-rays have definite phase re\ationship due to the periodic arrangement of atoms on the lattice [37].
These phase relations will produce constructive and destructive interference. If the path difference between the two successive waves is integral multiples ofthe wavelength then constructive interference take place and a diffraction peak is observed. Diffraction condition or Bragg's law is:
2d'/kl
sin
0
= nÂ,where d is the interplanar spacing ofhkl planes, f... is the wavelength and n is an integer number.
Powder diffractometers using the Bragg-Brentano parafocusing geometry gives well-defined diffraction angles. The Bragg-Brentano parafocusing geometry is shown in figure 2.3. In this geometry, sample and a point detector move in such a way that the sample is always at 8 and detector is al ways at 28 to the incident X-ray. Incident and the diffracted beam move on a circle that is centred on the sample. In figure 2.3, X-ray source is denoted by S, detector is denoted by D and the centre of the goniometer circle is denoted by O. Ali these three points lie on a circle known as parafocusing circle and is denoted by green dashed lines in the figure. The goniometer circle is indicated by the black dotted lines on which the detector moves. The goniometer circle has a fixed radius R but the radius of parafocusing circle varies from R/2 to 00.
~
....
---
...,
.... ....,
,
...
:
• / 1.
/ \ .... \ / \..
..
...
.
...
...
.
..
...
..
.
;;.~...\,
/
...
\ D
/
r
...
/ '. /,
...
.
/ 1 ••••• / 1 •.•• 1 \ . 1 \. 1 .... :',
f \ :"
:,
1 \ :,
i
....
'. '. e.. . ... '....
.
...
.
.
...
.
...
.
...
Fig 2.3 The Bragg-Brentano Parafocusing Cireles ofaX-ray goniometer
Owing to this geometrical arrangement, incident and diffracted X-rays (diffracted from any point ofthe sample surface by 28 ) will refocus exactly at the same point D.
'1=
cI»2=
180 -29In this figure a curved sample holder is shown but in practice fiat sample holder is used. That's why diffracted beams do not focus perfectly and create asymmetric broadening towards the low 29 angles in the diffraction pattern.
2.3 Scanning Electron Microscopy
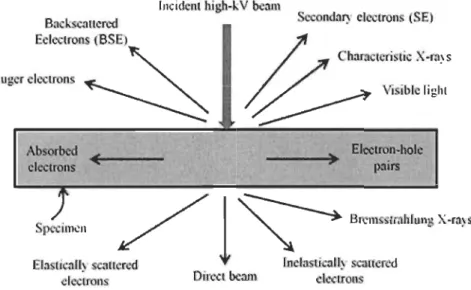
In a Scanning electron microscope (SEM) a highly focused electron beam is used to scan the sample surface. When the high-energy electron beam is incident on the sample, then different interactions take place, which gives different information about the sample such as morphology and chemical composition. These various electron-sample interactions are schematically shown in figure 2.4.
ln id nI hillh·1. V bcam Bo k :Itlcroo EdCClron (B )
"
S"""
"
~
Absorbcd <IIIIi(~--. cleclrons~
--=
te"
,
;
~l
e.- ;
;b" hgh' _ _ _ ...;). Elec~.holc paIrs,
,,;~") "
'
~
l
~,
B~
:
' ~mh
'M
'
'-mlcl trollS Direct bcam cl Irons
Fig 2.4 Types of the interaction of the electron beam with the specimen
In SEM, an electron beam of energy 5 to 30 ke V is bombarded on the target sample [38]. This incidental electron beam participates in various types of scatterings with bound electrons and lattice. These scatterings are known as elastic and inelastic scattering of electrons which are shown in figure 2.4. In the inelastic scattering, incident electrons lose their energy after interacting with the atoms of material's surface. This energy loss is a function of the distance travelled by the electron and dependent on the property of the target material [38]. Inelastic scattering causes the production of secondary electrons. On the other hand, in the case of elastic scattering, electrons are deftected by the atomic nuclei and a very small amount of energy transfer takes place. The energy transfer is minimal because the mass of the nucleus is larger than the mass of the electron.
Therefore elastic scattering is a scattering in which incident electron is detlected by the attractive force (without significant energy loss) by passing close to the positively charged nucleus [38]. Due to the e1astic scattering, backscattered electrons are produced. In the present study, JEOL JSM-5500 scanning microscopy has been used in which EDS (Energy Dispersive Spectroscope from Oxford Instruments) apparatus was attached for the chemical analysis.
2.3.1 Secondary electron emission mode
Secondary electron mode is most commonly used in SEM. Secondary electrons have very low energy compared to back scattered electrons (few electron volts). The number of the secondary electrons produced per incident electron is defined by the secondary electron coefficient
a
[38]. These secondary electrons are detected and gives the high-resolution image of the sample surface.2.3.2 Backscattered electrons mode
The number of the backscattered electrons reaching to the detector is directly proportional to the atomic number of the atom. This mode is helpful for obtaining high resolution compositional maps.
2.3.3 Energy Dispersive X-ray analysis
Energy dispersive X-ray analysis (EDS) is used for chemical characterization. This technique identifies the elements present in the sample and also gives information about their relative abundance. For this analysis, high energy electrons are bombarded on the target sample. These incident electrons interact with the electron shell bound to the nucleus and eject them from the shell. Ejection of the electron create a ho le in the inner shell and to fill this vacancy an electron form the higher energy shell jump into the lower energy shell by emitting the energy equal to the energy difference between these two energy levels. This energy is emitted in the form of X-ray which is known as the characteristic ray. Energies of these rays are detected by the energy dispersive X-ray spectrometer. Each element has a unique set of energy levels, which means that
energy of the X-ray produced by the transition from higher to lower level will be different for different elements.
2.4 Extended X-ray absorption fine structure Spectroscopy
For the present study, EXAFS measurements have been done on HXMA (Hard X-ray Micro-Analysis) 061D-l beam line at Canadian Light Source (Saskatoon, Canada). Ali the experiments have been run on transmission mode. For the EXAFS data analysis winxas software has been used [39]. Extended X-ray absorption fine structure spectroscopy (EXAFS) is used to determine the bond Iength, coordination number and local atomic structure of a material. A schematic diagram of EXAFS is shown in figure 2.5 [40].
scattering a
monochrom310r
ynchrotr n
Fig.2.S Schematic diagram of EXAFS
S:lwple
absorbing atom
As seen from the figure, in EXAFS set up, synchrotron Iight source produces a broad X-ray spectrum, a monochromator is used to select X-X-ray of a particular energy. X-X-ray beam of definite energy is then incident on the target sample. Sorne of the incidental X-rays are absorbed by the atom ofthe target material in which excitation or ejection of the core electron takes place [41]. This X-ray absorption is determined by comparing the intensity of the incident (10) and transmitted (It) beam. This process is repeated with X-ray of slightly different energy. A schematic of the X-ray absorption spectrum is shown in figure 2.6 [42].
XANES EXAFS
Enerav (eV}
Fig.2.6 Schematic presentation ofX-ray absorption spectrum
In this figure, x-axis is the energy of the incident X-ray photon and y-axis is the
absorption of the X-ray by the sample. The sharp rise in the spectra is known as edge,
the peaks and shoulders near the edge are known as X-ray absorption near edge structure (XANES) and graduaI oscillation above the edge is known as EXAFS.
2.4.1 EXAFS Principle
EXAFS is an interference phenomenon between the emitted and the backscattered photo electron wave. Its schematic illustration is shown in figure 2.7. The X-ray photon of energy E is incident on the sample and if this energy is greater than the binding energy of core electron (Eo) then the absorption of this photon generates a photo-electron of energy E-Eo [41]. This emitted photo-electron is backscattered by the neighbouring scattering atoms and interference phenomenon takes place between emitted and backscattered photoelectron waves. If this interference is constructive then the wave
function increases and if destructive then the wave function decreases.
According to the de Broglie relation;
À=h/p ... (2.1)
Where h is the plank constant, À is the wavelength and p is the momentum of the
photo-electron.
Energy of the photoelectron is related to the inomentum by the kinetic energy equation:
E = p2 / 2m ... (2.2)
À
=
h / (2mE)112 ... (2.3)The energy of the ejected photoelectron is E-Eo. Therefore, the wavelength of the ejected photoelectron will be;
À = h / [2m (E -Eo )]1/2 ... (2.4)
When the photoelectron is backscattered from many scattering atoms then it is called
multiple scattering and when it is scattered from only one atom then it is called single scattering.
Continuum
1 t 1 1•••
, •••••• M
1 1 1 1• • • • • • L
1 1 1x-fay
1~\
- = ü - - - * -K
X-ray Absorption Flne-Structure
-,
photo-electron À ~ ( E - Eo)
Absorblng Atom Scatterlng Atom
,~
..r~
Fig 2.7 Schematic illustration ofEXAFS phenomena
XAFS XANES Absorption ProbablIIty >-171 t c w 0 w
In the case of a single scattering, D is defined as the distance between absorbing and
absorber to the scatter atoms so in that case D is defined as half of the total distance travelled by the photoelectron [41].
As seen from the fig.2.7, constructive and destructive interference phenomenon causes the oscillation in EXAFS. Amplitude of these oscillations is proportional to the number of scattering atoms which gives information of coordination number.
EXAFS region is related to only oscillatory part of the X-ray absorption spectrum therefore, background is subtracted from the spectrum and this yield is symbolized by the oscillatory factor X(E) [41]. It is generally convenient to understand EXAFS in terms of photo-electron wavenumber (k) (liA unit), rather than X-ray energy. Therefore, X(E) is converted into the X(k), then Fourier's transformation gives us R-space fitting. R-space fitting helps us to know the radial distance or the bond length between two atoms.
2.5 Sievert's type apparatus for hydrogen measurements
Sievert's is a common technique which is used to measure the hydrogen uptake from the gas phase to the solid host [43]. For the present study ofhydrogen storage, a home-made volumetrie Sievert's type apparatus has been used. This apparatus is designed with several operational modes like absorption-desorption kinetics, pressure composition isotherms and kinetic ramp desorption. A picture of the machine is shown in figure 2.8.
In this apparatus there is a calibrated reference chamber and a sample holder where the sample is kept. The whole apparatus is designed with pressure gauges, connecting tubes and pipe lines. The absorbed amount of the gas is calculated by the pressure changes during absorption or desorption. The amount of the gas molecule in given volume can be calculated by using the virial expansion of the real gas law:
1 1 1
PV
IRT
=
1+
B(T)v
+
ceT) v2+
D(T) v3+
...
(2.5) Where P is the gas pressure, V is molar volume and R is the gas constant.B(T), ceT) and D(T) are the temperature dependent second, third and fourth virial coefficients. Equation (2.5) can be simplified by considering only second order coefficient,
Therefore,
PV = R.T
+
B.P ... (2.6) Since, V = VinV= n (R.T
+
B.P)/P ... (2.7)The number of moles of hydrogen absorbed or desorbed by the alloy is then,
n
=
2.&. VI RT ... (2.8)The factor 2 is because of the dihydrogen. Here, V is the total volume of the tube and sample holder which is constant.
2.6 Neutron Diffraction
In the present study, neutron diffraction has been performed at Delft University of Technology, Netherlands. For the neutron data refinement, the GSAS II software was used [44].
X-ray diffraction is commonly used to study the crystal structure of alloys, but this technique has sorne limitation. Specifically, for metal hydrides, X-ray cannot locate the
hydrogen atom in metal lattice. This is because X-ray interacts with the electron clouds of the atom and as hydrogen is a one electron atom its diffracting power is negligible compared to the other atoms in the alloy or hydride. Neutron powder diffraction is
essentially the only technique that could locate the hydrogen atom in the lattice [45].
Therefore, for the better understanding of our alloys, neutron powder diffraction has
been used.
Fundamentally, XRD and neutron diffraction both follows the Bragg's law which is:
2dhkJ sine
=
nÀ.(where À. is the wave length of the radiation, d is the interplanar spacing of hkl planes and e is the Bragg's angle.)
Neutron scattering is a quantum mechanics phenomenon which takes place due to the interaction between the incident neutron and the nucleus of the atom.
Neutrons interact with the nucleus via the short-range nuclear forces. This interaction is
characterized by a scattering length (b). It can be seen from the figure 2.9 that most of
the elements and their isotopes have positive b but sorne of them have negative b. If the scattering length is positive, it means neutrons are subjected to repulsive potential and if negative it means neutrons are subjected to an attractive potential.
20 Dy ... E 15 68Ni . " b Sc Pm u 10 .0 .I:. 'El c .!!! 5 Cl c 'C Q) t 0 Sm cu l,) II) 'E 7U Q) -5 'H Ti ' -Q) .I:. 0 () 62Ni -10 0 20 40 60 80 100 120 140 160 180 200 Atomic weight (u)
Fig.2.9 Different scattering length as a function of atomic weight
A schematic diagram of a constant wavelength diffractometer is shown in figure 2.10 [45]. For the neutron diffraction experiment, a constant wavelength diffractometer is attached to a neutron source. In the neutron source, due to the thermal fission, U235 split into the two dissimilar mass and produces neutrons. Produced neutrons are thermalized by the moderators. These thermal neutrons of energy 0.04 eV enter into the flight tube where they are collimated and then strike a single crystal monochromator. After diffraction from the monochromator, ail of these neutrons enter into another flight tube and other collimators. Collimated neutrons are then diffracted by the sample. A neutron detector and beam stop are other parts of the diffractometer. Bearn stop ensure that no direct neutron beam is entering into the detector. Signal appears in the detector only
Reactor
1
1. Rndialioll shic\ding
2. Neutl'On llight tnbe llnd collJmalol' J. MonochromalÎlIg rysllll
2
4. Flight tube and secondol'y coLlimator
5. ample
6. Detector Bank 7. BealIl stop
Fig.2.10 A schematic diagram of the constant wave length diffractometer
A schematic presentation of neutron diffraction pattern is shown in figure 2.11. The recorded neutron diffraction pattern is analyzed by the Rietveld refinement which is based on least-square algorithm [45]. By the Rietveld refinement of neutron pattern, crystal parameters (crystallite size, lattice parameter, microstrain), thermal parameters and atomic parameters (position and site occupancy of atoms) can be determined.
120 130 140 150
Scallering Angle. 29 (degrees)
Chapter 3
Structural, microstructural and hydrogenation characteristics of
Ti-V-Cr alloy added with Zr-Ni
3.1 Introduction
Similarly to most metal hydrides, the first hydrogenation of bcc alloys is difficult.The main reason is the presence of oxide at the surface. Usually the way to improve the first hydrogenation and break the surface oxide is to expose the alloy to high temperature and hydrogen pressure. But this solution is tirne consuming and impractical for many applications. In order to improve the first hydrogenation kinetics of bcc alloys, Miragila et al. added Zr7Nito to Ti-V -Cr alloy [23]. They found that addition of Zr7Nito resulted in a microstructure with a Zr and Ni-rich secondary phase that made the activation possible without prior heat treatment[23]. In this chapter, we report the effect of the addition of 7Zr+ 1 ONi on crystal structure, microstructure and hydrogenation kinetics of Tix V 70-xCr30
(x
=
lOto 50) alloy. Besides this, effect of TiN proportion was also investigated, and the results are shown in this chapter.In this work, a different alloy synthesis method than the one used by Miraglia et al. [23] is used. Miraglia et al. synthesized the bcc and Zr7Nito alloy separately and afterward,
the desired proportion of these alloys was mixed and remelted [23]. Therefore, they performed three different melting for each alloy. In the present work, ail the raw elements were mixed in the desired proportions and melted together. Thus, only one melt was done for each alloy. To distinguish our method to the one used by Miraglia et al. the additive name is written as 7Zr+ 1 ONi.
3.2 Results and discussion
In this section, detailed analysis of SEM, XRD and crystal structure of Tix V 70-xCr30 (x =
10,20,30,40,50) alloy added with 4 wt.% of7Zr+l0Ni are reported. Scanning electron microscopy showed that ail alloys were multiphase. X-ray powder diffraction confirmed
the body-centred cubic (bcc) phase as the main phase for the as-cast alloys. Upon hydrogenation, the bcc phase transformed into a face-centred cubic (fcc) phase. For x =
20, 30 and 40 a body-centred tetragonal (bct) phase was found along with fcc phase. Hydrogenation kinetics revealed that absorption kinetics improves with increasing Ti proportion. A detailed presentation ofthese results is shown below.
3.2.1 Morphology
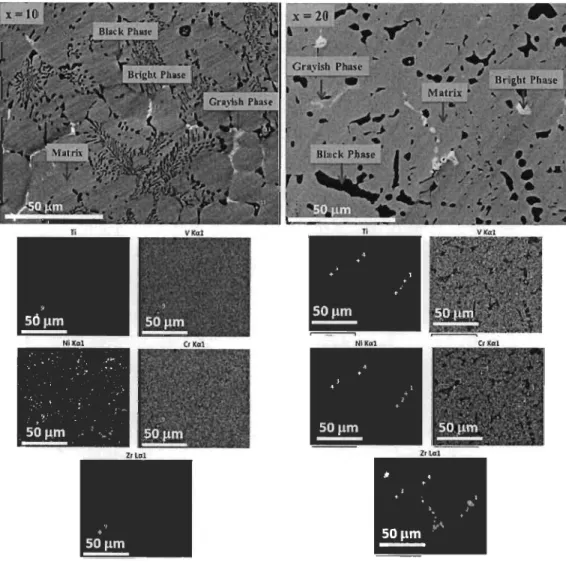
Microstructure of alloys x= 10 and 20 are shown in fig.3.1. It can be seen that four phases are present in these alloys: a matrix and three phases with different shades of grey thereafter called, bright, grayish and black.
Fig 3.1 Backscattered electron micrograph and elemental probe analysis of Ti"V 70-"Cr30 (x = 1 0, 20)
Elemental composition of observed phases has been studied by EDS. Table 3.1 shows the elemental analysis of alloy x = 10. It is clear from the table that matrix phase composition is similar to the bulk nominal value. The bright phase has 60 % of Zr. Nickel concentration is higher in the grayish phase and the black phase is essentially titanium.
Elements Bulk nominal Matrix Bright Grayish Black
value phase phase phase
Ti 9.7 7.9 7.6 32.2 92.8
V 58.2 60.1 19.2 9.3 5.4
Cr 29.3 29.1 8.1 2.9 0.9
Zr 1.1 1.1 62.9 15.4 0.8
Ni 1.6 1.6 2.2 40.2
--Table 3.1 Nominal and measured atomic percentage of the as-cast sample TilOV60 Cr30. Error on
the measured values is ±0.5 at.%.
Table 3.2 is showing the elemental analysis of alloy x= 20. The general features of the different phases are similar to the previous case, but the chemical composition slightly differs for the same phase in the two alloys. Clearly both the alloys, x = 10 and 20 have a discrepancy in the chemical composition ofbright and grayish phases.
Elements Bulk nominal Matrix Bright Grayish Black
value phase phase phase
Ti 19.4 18.7 8.8 29.6 93.1
V 48.6 48.3 3.9 13.4 5.2
Cr 29.2 30.1 2.1 7.8 0.8
Zr 1.1 1.1 85.2 36.4 0.9
Ni 1.6 1.8
--
12.8--Table 3.2 Nominal and measured atomic percentage of the as-cast sample Ti20 V 50 Cr30. Error on the measured values is ±0.5 at.%.
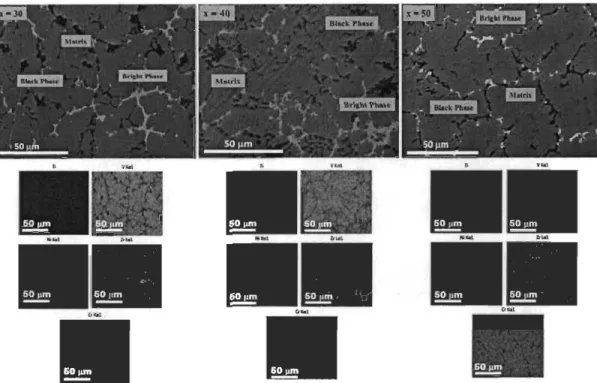
Figure 3.2 is showing the backscattered electron micrographs of alloys x = 30, 40 and 50. Each of these alloys has three phases: matrix phase, bright and black phase. The grayish phase observed in the alloys x= 10 and 20 is not present in the se compositions.
Fig 3.2 Backscattered electron micrograph and elemental probe analysis of Tix V 70_xCr30 (x = 30,
40 and 50)
In order to see the elemental composition of the phases, EDS analysis was done. The results for the alloys x = 30, 40 and 50 are shown in tables 3.3, 3.4 and 3.5 respectively.
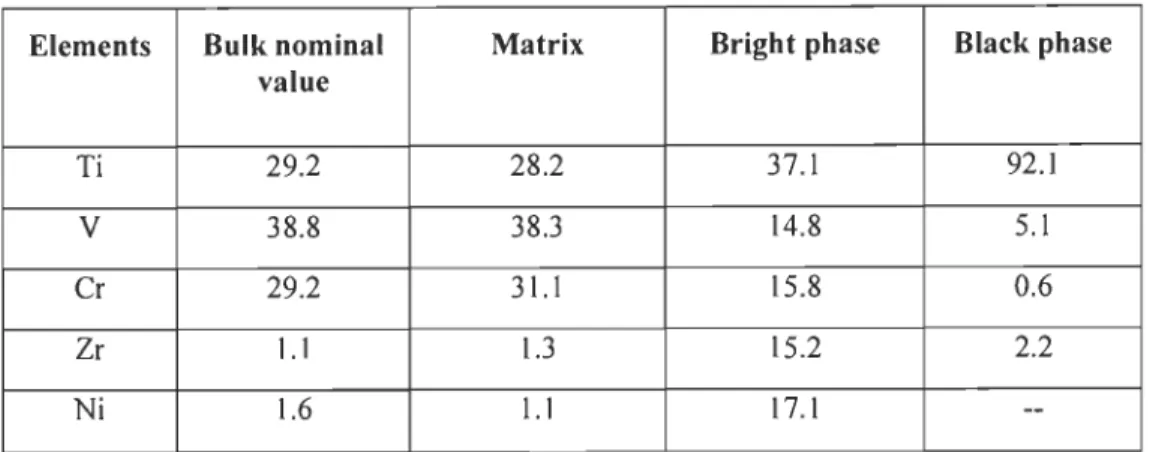
Table 3.3 is showing the EDS analysis for x = 30 alloy. The matrix phase has a composition similar to the bulk nominal value and the black phase is essentially titanium precipitates. In the bright phase, titanium has the highest concentration and all other elements have similar concentrations.
Elements Bulk nominal Matrix Bright phase Black phase value Ti 29.2 28.2 37.1 92.1 V 38.8 38.3 14.8 5.1 Cr 29.2 31.1 15.8 0.6 Zr 1.1 1.3 15.2 2.2 Ni 1.6 1.1 17.1
--Table 3.3 Nominal and measured atomic percentage of the as-cast sample Ti30 V 40 Cr30. Error on the measured values is ±0.5 at.%.
Table 3.4 is presenting the chemical analysis of x
=
40 alloy. The situation is similar to the previous case except that in the bright phase chromium has a slightly higher concentration and vanadium a lower concentration compared to x=
30 alloy.Elements Bulk nominal Matrix Bright phase Black phase value Ti 38.8 40.1 39.4 91.6 V 29.2 29.5 11.8 4.8 Cr 29.2 27.3 20.4 1.4 Zr 1.1 1.3 13.1 2.2 Ni 1.6 1.7 15.3
--Table 3.4 Nominal and measured atomic percentage of the as-cast sample Ti40V30 Cr30. Error on the measured values is ±0.5 at.%.
EDS analysis of alloy x
=
50 is reported in table 3.5. Like the above cases, the matrix phase has a composition close to the nominal one and the black phase is titanium precipitate. The composition of the bright phase is found different than in the previous cases. Here, titanium is found as the most abundant element, but the concentration of vanadium is found lower. The other three elements have shown similar concentrations.Elements Bulk nominal Matrix Bright phase Black phase value Ti 48.6 49.3 46.1 78.2 V 19.4 19.2 7.2 8.1 Cr 29.2 28.5 17.4 10.3 Zr 1.1 1.3 14.4 3.4 Ni 1.6 1.7 14.6
--Table 3.5 Nominal and measured atomic percentage of the as-cast sample TisoV20 Cr30. Error on the measured values is ±0.5 at.%.
On the basis of SEM figure and EDS analysis it is c1ear that varying elemental concentration affects the microstructure and phase chemical composition of the alloy. Phase abundance of each phase of each alloy is reported in table 3.6. 1t shows that, for ail alloys, the matrix phase is by far the most abundant and constitutes the bulk of the alloys. The next most abundant phase is the black precipitates with abundances from 6 to
15 %. The bright and grayish phases are only marginally present.
Alloy Matrix Bright phase Grayish Black Phase
(%)
(%)
Phase(%)
(%)
TilOV60Cr30 83(2) 0.4(2) 0.8(5) 15(1) Ti20 V SOCr30 85(2) 0.2(2) 2.4(5) 13(1) T30V40Cr30 84(2) 6(1) 9(1) Ti40 V 30Cr30 81(2) 7(1) 12(1) Tiso V 20Cr30 88(2) 4(1) 6(1)Table.3.6 Percentage of the observed phases for the alloy TixV70-xCr30 (x = 10 to 50), added with 7Zr+ 1 ONi, as calculated by Image j. Number in parentheses is the uncertainty on the last
A better representation of matrix and bright phases for each al!oy can be seen in figure 3.3 (a) and (b) respectively.
70~---~~---, 60 50 40 30 20 o 10 ~ 7ô 2.8 2.5 2.3 2.0 1.8 1.5 1.3 1.0 0.8 0.5 0.3 0.0 +---r---r--...---r---....--,...---r---l 10 20 30 X (a) 40 50 100 90 80 70 60 50 ~ 40 ..J
"'
27 24 21 18 15 12 9 6 3 0 10 20 30 40 50 x (b)Fig 3.3 Chemical analysis of the elements in Matrix (a) and Bright phase (b) with varying Ti concentration x.
Fig.3.3 (a) shows that in the matrix phase proportion of Ti and V changes towards the
higher x value while Cr, Zr and Ni are almost constant for al! the x values ( x= lOto 50).
This fol!ows the nominal compositions.
From fig 3.3 (b), it is c1early visible that in the bright phase there is a drastic variation in
the elemental composition from x = lOto 30 but after that it seems to stabilize for x = 40
and 50.
3.2.2 Crystal Structure
SEM and EDS determined the morphology and phase composition of Tix V 70-xCr30 ( X =
lOto 50) alloy. In order to study the crystal structure of as cast and hydrided alloys,
X-ray diffraction was performed. Fig. 3.4(a) and (b) shows the powder diffraction patterns
of as cast and hydrided alloys respectively. lt is clear from the fig 3.4(a) that al! the as cast alloys have body centred cubic (bcc) structure. In the diffraction pattern of x = 30