HAL Id: hal-02536031
https://hal.archives-ouvertes.fr/hal-02536031
Submitted on 7 Apr 2020
HAL is a multi-disciplinary open access
archive for the deposit and dissemination of
sci-entific research documents, whether they are
pub-lished or not. The documents may come from
teaching and research institutions in France or
abroad, or from public or private research centers.
L’archive ouverte pluridisciplinaire HAL, est
destinée au dépôt et à la diffusion de documents
scientifiques de niveau recherche, publiés ou non,
émanant des établissements d’enseignement et de
recherche français ou étrangers, des laboratoires
publics ou privés.
Generating Multidimensional Social Network to
Simulate the Propagation of Information
Mathilde Forestier, Jean-Yves Bergier, Youssef Bouanan, Judicaël Ribault,
Grégory Zacharewicz, Bruno Vallespir, Colette Faucher
To cite this version:
Mathilde Forestier, Jean-Yves Bergier, Youssef Bouanan, Judicaël Ribault, Grégory Zacharewicz,
et al..
Generating Multidimensional Social Network to Simulate the Propagation of
Informa-tion.
the 2015 IEEE/ACM International Conference, Aug 2015, Paris, France.
pp.1324-1331,
Generating Multidimensional Social Network to
Simulate the Dissemination of Information
Mathilde Forestier*, Jean-Yves Bergier**, Youssef Bouanan*,
Judicael Ribault*, Gregory zacharewicz*, Bruno Vallespir*, Colette Faucher**
*Bordeaux University, IMS Laboratory, UMR 5218, 351, Cours de la liberation, Talence, F-33400, France [email protected]
**Aix-Marseille University, LSIS Laboratory, UMR 7296, Avenue Escadrille Normandie Niemen 13397 Marseille, France [email protected]
Abstract—Social simulation implies two preconditions: deter-mining a population and simulate the information diffusion within it. A population represents a group of interconnected individuals sharing information. In this paper, the population we generate is detailed by socio-cultural features, specifically the way that people tend to link together. To this end, the use of a social network is a little bit restrictive: people are linked by only one relationship. Multidimensional Social Networks (MSN) model 3D social networks where each dimension represent a kind of relationship [1]. This architecture allows us to better represent the diversity of humans relations but also define distinctive rules for the message diffusion simulation. The inner idea is that information disseminates differently according to the links through which the information propagates. So, we present in this paper the modeling of our MSN based on social science and a simulation using propagation rules set for each dimension.
I. INTRODUCTION
Nowadays, many researchers are interested in developing new and more efficient systems for social simulation. The issues explored include psychology, organizational behavior, sociology, political science, economics, anthropology, geogra-phy, engineering, archaeology and linguistics [2], [3]. Military simulation systems have to support deeply detailed analysis of individual’s behavior. The SICOMORES project, in which we are involved, is a military project whose aim is to model a population of interconnected individuals in order to simulate and observe the reaction of this population face to different information. In the context of modern conflicts, the overall maneuver is an iterative process to achieve a desired effect on the environment. The actions deployed in this context are divided into influence and combat actions. Combat actions is rather limited in the context of stabilization operation, priority is given to actions of influence. These actions of influence can be defined as all the intentional activities to achieve an effect on perceptions in order to change attitudes and / or behaviors. In the context of stabilization phase of a conflict, the support of the population is at stake and people are the major target of such actions. Psychological Operations (PSYOPS) use media to share information customized to info-target’s cultural and linguistic specific features. However, the whole population is not an homogeneous entity easy to convince. It can be indifferent, opponent or ally. So, the aim of the SICOMORES project is to model a population with cultural features allowing to describe and simulate the effects of the operations of influence within it.
Modeling population needs the understanding of the spe-cific norms and ways the society organizes itself, e.g., an European society does not have the same features as an African one. The model of the population has to respect the codes of the society in order to accurately simulate the information diffusion. Furthermore, the relationships between people are too complex to be modeled by one link. Social networks are, for this purpose, a good but simple way to resume relationships between people. Nevertheless, social networks are generally based on only one relationship between people, or an ag-gregation of several relationships into one. Multidimensional social networks (MSN) begin to emerge due to the importance of each relationship in the communication process [4], [5], [6]. Flatten an MSN into a one dimension social network does not allow to consider each relation as a unique way to communicate with its own communication rules. It also does not allow to represent the complexity of an individual social life. In this paper, we model an MSN with the idea that information disseminates differently according to the link through which the information propagates: people do not receive and transmit in the same way an information according to the person who gave them the information. Following this postulate, we present in this paper the general framework of our MSN in order to generate a model of a population based on several relationships. Using social science research we describe some relationships representing a part of the human social life.
This paper proposes a general framework to model a population based on its social structure rules and its cultural features. This framework is really adaptable thanks of the MSN architecture which allows to separate and distinguish the relationships the one from the others, to add or delete a dimension, and to set for each dimension its own features and diffusion rules. The use of an MSN also allows to model the message acceptation and the transmission rules for each dimension.
The remainder of this paper proceeds as follows. In Section II, we introduce the related work. Section III describes our methodology: how we create nodes, what are our dimensions, how we linked people and so on. Then, Section IV-B presents the measures of our MSN and our proxy/sever architecture of simulation of message diffusion in an MSN. Finally, the paper concludes with directions for future work.
II. RELATED WORK
Social network generation, or more specifically graph gen-eration, appeared in 1960 with the Erd˝os and R´enyi [7] From this time to nowadays, researchers have looked to improve the graph generation to respect social network features [8]: degree distribution, assortativity, clustering coefficient, small world structure [9] and group structure. Social networks are not random graph and have special features to respect in order to generate realistic population. Thus, researchers aim to generate automatically social networks according to these features. Following Erd˝os and R´enyi [7], the dyadic models appeared [10], [11], the Markov random graph [12] and the network generation with small world properties [13]. Since 2000s, models are improved to take into account the time effect with the notion of preferential attachment: new nodes link proportionally to high connected previous node in a richer get richer configuration [14]. Newman et al. develop algorithms to create social networks with an arbitrary degree distributions [8]. These algorithms allow to set a distribution degree in order to obtain nodes with a correct number of links. Nowa-days, researchers develop methods allowing to manage several properties as Badham and Stocker who manage the degree distribution, the clustering coefficient and the assortativity [15]. In a military perspective, Svenmarck et al. simulate the dif-fusion of information in a fictive country [16]. They model the XLand population using Hofstede’s cultural dimension [17], with two religions (echos and Delta Christian) several ethnic groups while taking into account the territorial limitations as the access to drinking water. They use a social network where the nodes represent communities. Each community can get over 110 people with an average of 60. After generating nodes and giving them a spatial localization, the authors created links according to their features. We address two issues to their work: (1) using nodes to represent a community do not take into account the human process of acceptance or rejection of an information neither than the ability to transmit it to their network; (2) authors use only one relation between nodes without taking into account the different domains of social life and that people share information differently depending on the network. So, based on this consideration, we define in our work a multidimensional social network (MSN). Since a few decades, research in sociology described multidimensional social network as in [18]. Note that there is a clash in the termi-nology: we can find in literature the terms multilayer networks [19], networks of networks [20], multidimensional networks [1] multiplex networks [21] or multirelational networks [22], and so on. In this paper, we use the term multidimensional social network: the term dimension is frequently used to talk about human relationship in the social sciences literature [23]. As we are working on social networks, using social science theories, we use the closest concept of our work namely the term multidimensional social network. Furthermore the work of Berlingerio et al. gives us strong foundations in multidimensional social networks architecture [4], [1].
Although social networks have long existed, multidimen-sional formalization and modeling is fairly recent. We find a very few works about this subject as in [4], [5], [6]. In their paper, Pappalardo et al. propose a MSN where relations between people come from three websites of social network-ing: Foursquare, Twitter and Facebook [6]. Then, they try to
measure the strength of these links. As for Berlingerio et al., they analyze hubs in a multidimensional network [4]. Actually, measures from social network analysis have to be adjusted to MSN. Finally, Forestier et al. propose a MSN from online discussions where relations are from discussion structure and text content. These relations help to find celebrities in the discussions [5]. So, MSN model has a really big interest in catching the social life diversity of different kinds of people.
III. GENERAL FRAMEWORK
The SICOMORES project aims to simulate the actions of influence happening in the context of stabilization phase of modern asymetric conflicts. These actions of influence can be Psychological Operations (PSYOPS) or Civil Military Coop-eration (CIMIC). Both of these opCoop-erations aim to convince people’s heart and mind. These operations aim to make the local population an ally. Military spread messages to influence info-targets in their behavior.
In order to simulate the message diffusion, we define a multidimensional social network (MSN). Berlingerio et al. de-fined in [1] a multidimensional network as a triple G=(V,E,L) where: V is a set of nodes; L is a set of labels; E is a set of labeled edges, i.e., the set of triples (u,v,d) where u, v ∈ V are nodes and d ∈ L is a label. Also, we use the term dimension to indicate label. Each dimension has its own generation rules according to social science theories.
We define some rules to generate relationship between people according to their features and their socialization rules. The greatest benefit of using an MSN is to keep distinct all the socialization dimensions. It implies three major improvements: • Generate relationships according to sociability rules, e.g., families structures are different from friendship structures;
• MSN proposes a very flexible architecture: we can easily add or delete dimensions;
• Using an MSN allows to define propagation rules for each dimension allowing a more accurate information diffusion simulation.
So, in this section we present how we generate nodes and the dimensions linking them.
A. Individual Information
Each node in the MSN represents an individual who is described by a set of attributes and variables:
• Static attributes such as age, sex, social status, ethnic-ity, language, religion, illiteracy, accessibility by radio, tv and so on.
• Variables such as the attitude, the satisfied-needs, the unsatisfied-needs (according to Maslows classification of human needs [24]).
As we do not have accurate data available, we can not be too specific: we do not assign a specific age or a specific social level to a node but a level group and an age group. To be accurate, algorithms ask for certain information such as the proportion of each ethnicity in the group or the proportion of
each kind of family. If final users do not have these information we generate them randomly. People can also speak several languages but at the time of writing we only take into account one language, i.e., the one the most commonly spoken and understood. For example, if an ethnic group has its own language but also speaks English, we only take into account the English language.
At first, we thought to assign features to node in a random way but it quickly appeared as a bad idea: individual’s features are dependent on each other, e.g., in some cultures, illiteracy can be relative of the social level or the gender.
Finally, the last stable information concerns the access to various communication media. It is necessary to model the individual’s accessibility for media such as radio, TV, cell phone and internet. These information of accessibility help military to choose the pertinent medium to reach the info-targets. In the process of information diffusion it is really important to consider the medium used, all the media do not have the same impact on the population: diffusing a message during a famous TV shows could have more repercussion than in a radio show [25].
B. The three primary dimensions : family, friends and neigh-bors [26]
Fig. 1: Example of a multidimensional social network with the three primary dimensions
We define three permanent dimensions L={family, friends, neighbor} according to [26]. Figure 1 shows the three first social relationships. Each individual, represented by a node, is present on each dimension of the MSN (even if he has any relationship in the dimension). People can be linked in one or more dimensions. Each node is present in each dimension but can be isolated in some dimensions, e.g., a person may have no family, no known neighbors. There are three distinct families on the first dimension (the family dimension). The second dimension shows how people are linked in the friend-ship relationfriend-ship and finally, the way we link people in the neighborhood dimension.
The following three subsections present the generation of each dimension.
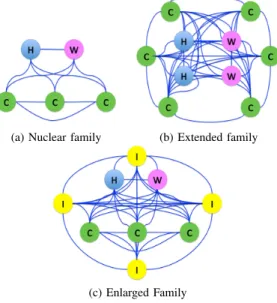
1) Family dimension: Families are the basis of each society in the world. They can be structured in different ways but this dimension belongs to the three first socialization groups. On the overall possibilities throughout the world we decide to select three family structures as shown of Figure 2. As we can see, more than the size of the families, these are the roles of family members that are important. These roles have a big influence in the message spreading. Figure 2a presents a nuclear family composed by a pair of adults (husband H and wife W) and their children (C); Figure 2b presents the extended family, i.e., a family composed of several married couples and their children; finally, the enlarged family in Figure 2c can be defined as a nuclear family with some related individuals (I).
(a) Nuclear family (b) Extended family
(c) Enlarged Family
Fig. 2: The three family structures
Some families can be polygamous. In this case, families are still one of these three structures but with the addition of wives (an husband can have two wives).
During the generation of the family dimension, we assign features to nodes to respect a family cohesion such as an common ethnicity, a common language.
Algorithm 1 shows how we build the families. According to the proportion of each family previously given, we generate families with socio-cultural features (e.g., ethnicity, religion, social level). For now, we assume that a family shares a same religion, a same social level but these assumptions will maybe change. In some parts of the word, finding several religions inside a same family is really common.
Concerning the accessibility of the families, we assume that if one member of the family is reachable by TV or radio, all the others members of the family are also reachable.
Finally, some people do not have a family. In war time it can be frequent, especially in refugee camps. Thus, some nodes do not have any family link. We call them the lonely nodes on algorithm 1.
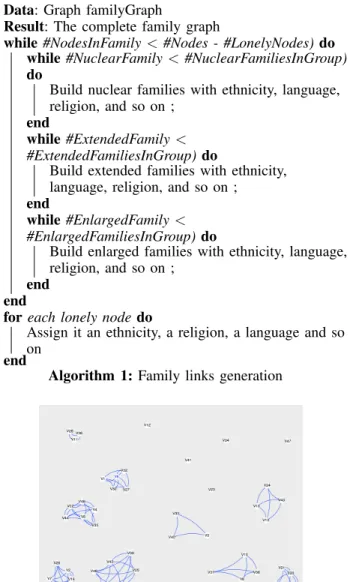
Figure 3 shows a generation of families for a group of 50 people with 10% of lonely nodes, i.e., nodes without family. We clearly see that each family is a clique and can be nuclear, extended or enlarged.
Data: Graph familyGraph
Result: The complete family graph
while #NodesInFamily < #Nodes - #LonelyNodes) do while #NuclearFamily < #NuclearFamiliesInGroup) do
Build nuclear families with ethnicity, language, religion, and so on ;
end
while #ExtendedFamily < #ExtendedFamiliesInGroup)do
Build extended families with ethnicity, language, religion, and so on ; end
while #EnlargedFamily < #EnlargedFamiliesInGroup) do
Build enlarged families with ethnicity, language, religion, and so on ;
end end
for each lonely node do
Assign it an ethnicity, a religion, a language and so on
end
Algorithm 1: Family links generation
Fig. 3: Generation of a population of 50 people with 10% of lonely nodes. The family dimension.
2) Friendship links: We then generate the friendship di-mension. Friendship is based on homophily following the well-known motto birds of a feather flock together, i.e., the way that people tend to link with similar people [27]. We define a measure of homophily based on the individual’s attributes as explained on equation 1.
F riendshipHomophily = wssexe + waage + wscsocialLevel + weethnicity
+wllanguage + wrreligion
(1)
Each parameter is weighted in order to easily advantage or disadvantage one, e.g., in some parts of the world, ethnicity can be more important to become friends than religion or vice versa.
Algorithm 2 presents how we create friendship links in its respective dimension. We first create link between randomly
Data: Graph friendGraph, int averageFriendsThresold, double homophilyThreshold, double ccThreshold Result: The complete friendship graph
while average # of friends < (averageFriendsThresold/ 2) do
node1 ← random node of friendGraph; node2 ← random node of friendGraph; if (homophily(node1,node2) / maxHomophily > homophilyThreshold then
create FriendshipLink(node1,node2) ; end
end
// IMPROVE COEFFICIENT CLUSTERING while average # of friends< (averageFriendsThresold) do
randomNode ← random node of friendGraph; egoFriendGraph ← ego-network of randomNode in the friendGraph ;
while coefficientClustering(egoFriendGraph) < ccThreshold) do
node1 ← random node of egoFriendGraph ; node2 ← random node of egoFriendGraph ; create FriendshipLink(node1,node2) ; end
end
Algorithm 2: Friendship links generation
chosen nodes if their homophily score is higher than a given threshold (homophilyThreshold). We measure the homophily following the equation 1. We repeat this operation until we reach the half of the average number of friends (average-FriendsThresold).
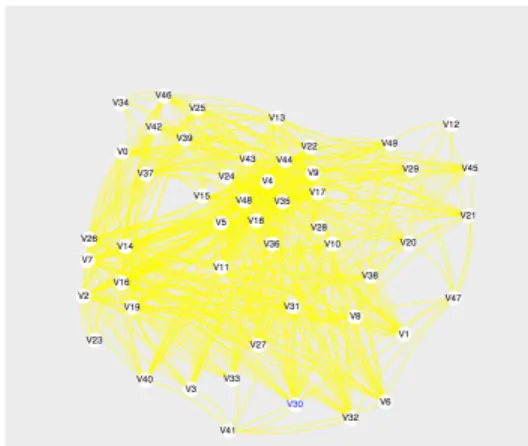
We then raise clustering coefficient because friendship dimension has to have a higher coefficient clustering: friends of my friends are my friends. To make this happen, we add links between nodes of node’s ego-network. For each randomly chosen node, we get its ego-network in the friendship dimension and add links to obtain a clustering coefficient of ccThreshold on this sub-graph. We repeat the addition of links until we reach the average number of friends previously given. We can see on figure 4 the friendship dimension before and after the improvement of the clustering coefficient. We can see on Figure 4b that new links exist between unconnected people on Figure 4a.
3) Neighbor links: The notion of neighbor can be really difficult to apprehend even in one specific culture. People can interpret neighborhood at only people living in the same building level, in the same building, in a area of several buildings or at less than several kilometers. As we do not consider the location of each individual, at least for now, this question is not taken into account. However, as for the friendship dimension we use an average number of neighbors (as shown on algorithm 3). We select four attributes that can allow to model a neighbor: the social level, the language, the ethnicity, and the religion. We create the equation of homophily between neighbor as following:
N eighborHomophily = wscsocialLevel + weethnicity
+wllanguage + wrreligion
(a) The friendship dimension before the improvement of clustering coefficient
(b) The friendship dimension after the improvement of clustering coefficient
Fig. 4: The friendship dimensions
As for the friendship, the parameters are weighted. For example, we can find some rich and poor neighbors in Europe while the ethnicity could be more important in Africa. The possibility to choose the importance of each parameter allows a finest representation of a population.
Data: Graph neighborhoodGraph, int averageNeighborThresold, double homophilyThreshold
Result: The complete neighborhood graph
while average # of neighbor < (averageThreshold) do node1 ← random node of neighborhoodGraph; node2 ← random node of neighborhoodGraph; if (neighborHomophily(node1,node2) /
maxNeighborHomophily> homophilyThreshold then
create neighborhoodLink(node1,node2) ; create neighborhoodLink(nodes1’s family, node2’s family);
end end
Algorithm 3: Neighborhood links generation
Algorithm 3 shows how we create neighborhood links. First we randomly pick two nodes in the neighborhood graph. If the homophily of these two nodes is higher than a certain threshold (homophilyThreshold), we generate a neighborhood link between them but also between their respective families. As we see a family as a located group of people, each member of the first node’s family is necessarily a neighbor of the second node’s family. We repeat this operation until we reach the average number of neighbors given in input. Note that we create neighborhood links firstly for the lonely nodes: a person without family should firstly try to socialize with the closest located people.
Fig. 5: The neighborhood dimension.
Figure 5 shows the neighbor dimensions. C. The war time dimensions
We just presented in the previous section the three primary dimensions of our MSN. These three dimensions form the basis of social life and should be represented for all the future population we want to generate. However, in war time, new forms of socialization could appear according to the kind of conflict the military are deployed to stop. So we define two kinds of war-time socialization: the ethnicity and the religious. When the situation is critical, people tend to segregate according to a kind of conflict. For now, we model two forms of communitarianism: the religion one (e.g., the Central African Republic civil war) and the ethnic one (e.g., the genocide in Rwanda). During this critical phase, we activate the dimension according to the chosen context. So this new socialization could dominate the three primary kinds of socialization (even if they still exist). One of the best asset of MSN is the possibility to add or delete dimensions to better represent interaction between people.
Algorithm 4 presents how we generate the war-time dimen-sion. We first create the link in the war time dimension using previously created links between nodes and their friends and neighbors who share the same ethnicity or religion (according to the segregation choice). Then we raise the coefficient clustering by adding links between nodes sharing a same ego-network. In this dimension, it does not exit a way to communicate between two nodes with a different religion or ethnicity.
Figure 6 shows the war-time dimensions based on the religion. We clearly see that people are split into two groups without gate between these two.
IV. EXPERIMENT AND RESULTS
A. Social network measures
The following experiment is based on sociological studies of sub-Saharan African societies. We analyze these societies to highlight some cultural features we can use to generate the populations. For example, the notion of neighborhood is really important in sub-Saharan social life (while it can have a very poor diffusion impact in some European Area) [28].
Data: Graph warTimeGraph, int averageThresold, double ccThreshold, segregationChoice Result: The complete war time graph for each node in warTimeGraph do
Retrieve friends and neighbors who share the same religion or ethnicity;
Generate Links between each node and its friends and neighbors who share the same religion or ethnicity;
end
// IMPROVE COEFFICIENT CLUSTERING while average # of friends < (averageThresold) do
randomNode ← random node of warTimeGraph; egoWarTimeGraph ← ego-network of randomNode in the warTimeGraph ;
while coefficientClustering(egoWarTimeGraph) < ccThreshold) do
node1 ← random node of egoWarTimeGraph ; node2 ← random node of egoWarTimeGraph ; create warTimeLink(node1,node2) ;
end end
Algorithm 4: the war time links generation
Fig. 6: The war-time dimension based on the religion
We generate three populations as defined in table I. For all populations, we generate the three family structures, we give an average number of friends of 10, an average of 20 neighbors, and an average of 30 religious connections in the war time dimension.
TABLE I: Our three generated population
Population #1 Population #2 Population #3
# of people 500 1000 5000
average # of degree 64 64 69
min 9 6 4
max 140 168 190
average of shortest past between two nodes
MSN 2.09 2.33 2.76 family dimension 1 1 1 friendship dimension (1) 4 4.47 4.59 friendship dimension (2) 3.08 3.83 3.54 neighbor dimension 3.4 4.6 5.17 religious dimension (1) 2.3 2.6 2.95 religious dimension (2) 2 2.27 2.78
Table I presents the average degree in the MSN and the
average of shortest past between two nodes in the MSN and in each dimension. We can see that, even if the average number of neighbors is very close for the three populations, the average shortest past in the MSN is close from 3 in the population #3 while it is close from 2 for the population #1. Concerning the family dimension, the average shortest past is 1: people inside a family are connected to each other member of teh family. The friendship dimension (1) and (2) present the average shortest past (1) before and (2) after increasing the clustering coefficient. We can see that it decreases the shortest past of approximately 1 (a little bit less for the population #3). Regarding the religious dimension, the average shortest past does not decrease in the same proportion. It is due to the fact that the population is split in two distinct groups (as shown on figure 5). Finally, concerning the neighbor dimension, the average shortest past increases with the size of the population. We are close from the small world effect for the population of 5000 people.
(a) Multidimensional social net-work
(b) Friendship dimension
(c) Neighbor dimension (d) Religious dimension
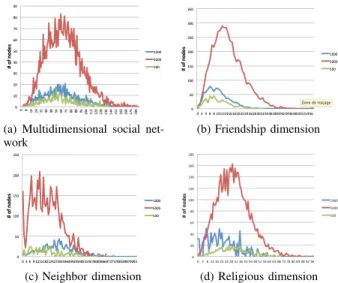
Fig. 7: Distributions of degree
Figure 7 shows the degree distributions for the MSN and for each dimension. Green curves represent the population #1, the blue curves represent the population #2 and the population #3 is in red. The curves look more like a normal law distribution than a power law. We have to adjust our algorithms to respect the power law distribution. We are thinking to less randomize the choice of the nodes in choosing the nodes to link. We also think to avoid lonely nodes in the friendship dimension. We can see in Figure 4 four lonely nodes in a population of fifty people.
B. Using MSN in simulation
The use of an MSN is fairly new in simulation. We use in our project the DEVS (Discrete EVent System Specifica-tion) formalism on a VLE (Virtual Laboratory Environment) plateform. We proposed in [29] an MSN implementation architecture and a VLE model to simulate the dissemination of information. Our architecture is based on a proxy/server architecture. This proxy/server architecture presented in Figure 8 aims to isolate a node (called servernode) to its rules of diffusion (proxies) for each dimension. In this way the servernode a contains all the information about the individual
Fig. 8: Example of the proxy server architecture for multidi-mensional social network
such as his ethnicity, his age, his religion. Servernode a has as many proxies as there are dimensions. Proxies are represented by the circles a1, aiand an. These proxies contain the diffusion
rules for the dimensions 1, i and n. Thus, when a servernode has an information, it sends it to its proxies which decide if they send the information to the node’s ego-network for each dimension.
This architecture is flexible and sensitive to a changing environment. As it is easy to add or delete a dimension using an MSN model, it is still easy to add or delete dimensions in our proxy/server architecture without modifying the whole structure. Furthermore, using this proxy/server architecture, we can adapt each propagation rules to each dimension, with the inner idea that we do not transmit and receive information in the same way with families, friends and so on.
The following simulation presents an example of some propagation rules we can define for each simulation. Note that for now, these rules are very simple but they will be improved using social science theories. The rules of diffusion are not validated, but the following simulation shows how it is simple to add / delete /modify rules in each dimension using our proxy / Server architecture. The validation will be held with experts of the domain (military) in order to validate the final results of the simulations.
I the following simulations, each message contains a con-text on which military want to influence the population. We define for now two different contexts: security and health care. These two contexts control the diffusion of the message according to each dimension. Table II presents the probabilities we use for each context and dimension. We also use a message strength to stop the simulation when this strength decreases under a given threshold. This decrease of strength varies for each dimension.
Figure 9a presents the initialization of the simulation. The population contains 100 nodes. We initialize one node as info-source (the green node) and one node as immune (the node has no interest in the information and will not transmit it
TABLE II: Probability values for each proxy and each message context
DIMENSION PROBABILITIES MESSAGE STRENGTH
Family 0.9 security
O.9 health care message strength -1
Friendship O.4 security
0.6 health care message strength -2
Neighbor O.1 security
0.4 health care message strength -3
(a) Initialization of the simulation
(b) Result of the simulation with a message of security
(c) Result of the simulation with a message of health care
Fig. 9: Results of simulation with several message contexts
to its ego-network). We then begin the simulation with two algorithms: we set the probabilities of message transmission according to the context of the message (security or health care) and the dimension. We can see on both Figures 9b
and 9c that the population does not receive and transmit the message in the same way. So, these simulations, even if the diffusion rules are quite simple, show that it is very important to consider the relationships, and detail for each one some rules of propagation.
V. CONCLUSION AND PERSPECTIVE
We present in this paper the architecture of our multidi-mensional social network for modeling relationships between people. We use an MSN architecture to generate each dimen-sion with its own rules: the friendship dimendimen-sion is different than the neighbor dimension and can not be generated in the same way. So, using an MSN allows a partitioning of each social dimension of human life. Furthermore MSN also allows to define distinct propagation rules for each dimension. We can easily modify such as the strength of the message, the time of the day, the probability of acceptance for each dimension.
We will modify our algorithms to obtain distributios of degree following a power law distribution. The first idea is to decrease the randomness in the way that we choose nodes. We are also thinking about adding links for nodes with small degrees. One of the greatest things using an MSN is its adaptability. We can easily add or delete a dimension in respect of the population’s features.
Finally, the work presented in this paper is part of a military project but opens many possibilities for various applications. Generating a population with an unseen level of cultural features can be used in marketing to simulate the adoption of a new product, in politics to see the diffusion of an idea or the way a politician’s reputation changes...
.
ACKNOWLEDGMENT
This work is supported by the SICOMORES Project n132936073 funded by French DGA (Direction G´en´erale de l’Armement). It involves the following partners: IMS Univer-sity of Bordeaux, LSIS UniverUniver-sity of Marseille and MASA Group.
REFERENCES
[1] M. Berlingerio, M. Coscia, F. Giannotti, A. Monreale, and D. Pedreschi, “Multidimensional networks: foundations of structural analysis,” World Wide Web, vol. 16, no. 5-6, pp. 567–593, 2013.
[2] S. Takahashi, D. L. Sallach, and J. Rouchier, Advancing social simula-tion: the first world congress. Springer, 2007.
[3] Y. Bouanan, M. B. El Alaoui, G. Zacharewicz, and B. Vallespir, “Using devs and cell-devs for modelling of information impact on individuals in social network,” in Advances in Production Management Systems. Innovative and Knowledge-Based Production Management in a Global-Local World. Springer, 2014, pp. 409–416.
[4] M. Berlingerio, M. Coscia, F. Giannotti, A. Monreale, and D. Pedreschi, “The pursuit of hubbiness: analysis of hubs in large multidimensional networks,” Journal of Computational Science, vol. 2, no. 3, pp. 223– 237, 2011.
[5] M. Forestier, J. Velcin, and D. Zighed, “Extracting social networks to understand interaction,” in Advances in Social Networks Analysis and Mining (ASONAM), 2011 International Conference on. IEEE, 2011, pp. 213–219.
[6] L. Pappalardo, G. Rossetti, and D. Pedreschi, “How well do we know each other? detecting tie strength in multidimensional social networks,” in Proceedings of the 2012 International Conference on Advances in Social Networks Analysis and Mining (ASONAM 2012). IEEE Computer Society, 2012, pp. 1040–1045.
[7] P. Erd˝os and A. R´enyi, “On the evolution of random graphs,” Magyar Tud. Akad. Mat. Kutat´o Int. K¨ozl, vol. 5, pp. 17–61, 1960.
[8] M. E. Newman, S. H. Strogatz, and D. J. Watts, “Random graphs with arbitrary degree distributions and their applications,” Physical Review E, vol. 64, no. 2, p. 026118, 2001.
[9] S. Milgram, “The small world problem,” Psychology today, vol. 2, no. 1, pp. 60–67, 1967.
[10] P. W. Holland and S. Leinhardt, “An exponential family of probability distributions for directed graphs,” Journal of the american Statistical association, vol. 76, no. 373, pp. 33–50, 1981.
[11] E. Lazega and M. Van Duijn, “Position in formal structure, personal characteristics and choices of advisors in a law firm: a logistic regression model for dyadic network data,” Social networks, vol. 19, no. 4, pp. 375–397, 1997.
[12] O. Frank and D. Strauss, “Markov graphs,” Journal of the american Statistical association, vol. 81, no. 395, pp. 832–842, 1986.
[13] D. J. Watts, “Networks, dynamics, and the small-world phenomenon 1,” American Journal of Sociology, vol. 105, no. 2, pp. 493–527, 1999. [14] A.-L. Barab´asi and R. Albert, “Emergence of scaling in random
networks,” science, vol. 286, no. 5439, pp. 509–512, 1999.
[15] J. Badham and R. Stocker, “A spatial approach to network generation for three properties: Degree distribution, clustering coefficient and degree assortativity.” Journal of Artificial Societies & Social Simulation, vol. 13, no. 1, 2010.
[16] P. Svenmarck, M. J. Huibregtse, A. van Vliet, D. A. van Hemert, M. M. Lundin, M. E. Sj¨oberg, and M. P. J. van Amerongen, “Message dissemination in social networks for support of information operations planning,” 2010.
[17] G. Hofstede, G. J. Hofstede, and M. Minkov, Cultures and organiza-tions. McGraw-Hill New York, 1997.
[18] D. Krackhardt, “Cognitive social structures,” Social networks, vol. 9, no. 2, pp. 109–134, 1987.
[19] M. Kivel¨a, A. Arenas, M. Barthelemy, J. P. Gleeson, Y. Moreno, and M. A. Porter, “Multilayer networks,” Journal of Complex Networks, vol. 2, no. 3, pp. 203–271, 2014.
[20] G. D’Agostino and A. Scala, Networks of networks: the last frontier of complexity. Springer, 2014.
[21] L. M. Verbrugge, “Multiplexity in adult friendships,” Social Forces, vol. 57, no. 4, pp. 1286–1309, 1979.
[22] S. Wasserman and K. Faust, Social network analysis: Methods and applications. Cambridge university press, 1994, vol. 8.
[23] S. Alkire, “Dimensions of human development,” World development, vol. 30, no. 2, pp. 181–205, 2002.
[24] A. H. Maslow, “A theory of human motivation.” Psychological review, vol. 50, no. 4, p. 370, 1943.
[25] M. McLuhan, Understanding media: The extensions of man. MIT press, 1994.
[26] H. Cooley Charles, “Social organization: A study of the larger mind,” Charles Scribner’s Sons, New York, 1909.
[27] M. McPherson, L. Smith-Lovin, and J. M. Cook, “Birds of a feather: Homophily in social networks,” Annual review of sociology, pp. 415– 444, 2001.
[28] O. Walther, “Au-dela de lopposition entre villes et campagnes. ele-ments pour un modele territorial dynamique en afrique de l’ouest,” L’information geographique, no. 4, pp. 308–319, 2004.
[29] Y. Bouanan, M. Forestier, J. Ribault, G. Zacharewicz, and B. Vallespir, “Simulating information diffusion in a multidimensional social network using the devs formalism,” in Spring Simulation Multi-Conference (SpringSim’15), 2015.
View publication stats View publication stats