HAL Id: hal-01929220
https://hal.archives-ouvertes.fr/hal-01929220
Submitted on 11 Dec 2019
HAL is a multi-disciplinary open access
archive for the deposit and dissemination of
sci-entific research documents, whether they are
pub-lished or not. The documents may come from
teaching and research institutions in France or
abroad, or from public or private research centers.
L’archive ouverte pluridisciplinaire HAL, est
destinée au dépôt et à la diffusion de documents
scientifiques de niveau recherche, publiés ou non,
émanant des établissements d’enseignement et de
recherche français ou étrangers, des laboratoires
publics ou privés.
Electronic and nuclear magnetic anisotropy of
cobalt-doped ZnO single-crystalline microwires
Adrien Savoyant, O. Pilone, S. Bertaina, Fabian Delorme, Fabien Giovannelli
To cite this version:
Adrien Savoyant, O. Pilone, S. Bertaina, Fabian Delorme, Fabien Giovannelli. Electronic and nuclear
magnetic anisotropy of cobalt-doped ZnO single-crystalline microwires. Superlattices and
Microstruc-tures, Elsevier, 2019, 125, pp.113-119. �10.1016/j.spmi.2018.10.024�. �hal-01929220�
Electronic and Nuclear Magnetic Anisotropy of Cobalt-doped ZnO
Single-crystalline Microwires
A. Savoyant,1 O. Pilone,1 S. Bertaina,1 F. Delorme,2 and F. Giovannelli2 1Aix-Marseille Universit´e, CNRS, IM2NP UMR 7334, 13397 Marseille Cedex 20, France
2
Universit´e de Tours, CNRS, INSA CVL, GREMAN UMR 7347, IUT de Blois, 15 rue de la chocolaterie, CS 2903, 41029 Blois Cedex, France.
Using electron paramagnetic resonance (EPR), we investigate the electronic and nuclear magnetic properties of ZnO:Co single crystals, grown by the optical furnace method. The high crystal quality of the studied samples allows for the determination of the full hyperfine and g tensors. We explain how the local magnetic anisotropy of the Co2+ impurities is used as a very fine probe for the local symmetry and crystal quality of the host. The temperature- and power-study of EPR intensities recorded in three static- and microwave-field configurations give a qualitative insight into the dy-namics of spin-lattice and spin-spin relaxations. In addition, in the context of nanostructures, we explain how a detailed analysis of the intensities anisotropy can reveal the proportion of ordered and disordered phases.
PACS numbers: 61.72.uj, 75.30.Gw, 75.50.Pp, 76.30.Fc
I. INTRODUCTION
ZnO micro- and nanocrystals, doped or not with magnetic impurities, are very interesting materials for a wide range of applications1–5,
particularly because of their inverse and direct piezoelectric (PZ) properties combined with their semiconducting n-type character6–10. For
exam-ple, if the contact between a ZnO micro-crystal and a metal results in a Schottky barrier, a micro-scaled mechanical-to-electrical convertor is realized. These PZ properties arise on the one hand from the ionic and binary character of ZnO and, on the other hand, from the absence of inver-sion symmetry at each site of the ZnO wurtzite structure. Different crystal-grain orientations within a given sample results in a destructive PZ effect, so that this latter is positively correlated with the crystal quality of the considered sample. The obtention of very high crystal quality ZnO micro- and nano-structures is thus a key point to maximize the direct and inverse PZ effects to be used in concrete applications.
Besides, inserting magnetic ions in such a PZ semiconductor could result in interesting electrical, optical or magneto-mechanical couplings11–17. Apart from these hoped-for magnetic properties, cobalt-doping of ZnO nanostructures is also realized for many other reasons: to reduce some intrinsic defects18, to
en-hance the PZ response and dielectric constant8,9,
to improve crystal quality19, etc., these different effects being certainly linked together. Aside of these cobalt-induced properties, this doping is also performed for probing crystallinity of single crystals20 or orientation’s coherence of a set
of nanorods21, subjects on which we will focus thereafter. In particular, the use of Electron Paramagnetic Resonance (EPR) techniques allows
for detecting very low impurities contamination or weak crystal-grain disorientation, provided that the resonant centers are sufficiently diluted and display a notable magnetic anisotropy. This is the case of ZnO:Co diluted magnetic semiconductor in which, at low temperature, the localized electronic spin of Co2+ shows a preferred orientation within the hexagonal plane of the wurtzite structure. The effective g-factor in a direction perpendicular to the c−axis is about twice that in the parallel di-rection. As a consequence, each local environment around a Co2+ ion gives EPR lines at a specific position, depending on its environment’s orien-tation. Then, the total EPR spectrum contains information about the orientation’s distribution, which can be extracted from suitable simulation. However, when dealing with very few numbers of paramagnetic impurities (as often in a nanostruc-ture context), high-power microwave is required in order to detect something. This often leads to a saturated regime beyond the current-simulation possibilities. Thus, experimental reference spectra of single crystals for any microwave power are desirable data for understanding the saturated regime of nanostructures.
In this paper, we present the EPR results ob-tained on ZnO:Co single crystalline microwire (MW), grown by the optical furnace method. In this material, the nuclear hyperfine interaction of the 59Co2+ ions displays a quite unusual large
anisotropy (A∥/A⊥ = 5.4). Due to its low value in the perpendicular direction (A⊥ = 2.98 × 10⁻⁴ cm−1 ≡ 0.3 mT ), the full hyperfine tensor can only be resolved in very high crystal-quality samples, for which the EPR line width is signif-icantly lower than 0.3 mT. We show that such a crystal quality can be reached in the studied ma-terial, which allows for the electronic and nuclear magnetic anisotropy characterization, through the
2
determination of the full g-factor and hyperfine tensors. Three different static- and microwave-field configurations are used, for which the temper-ature and microwave-power dependence are stud-ied. The fits of the temperature-dependent inten-sities confirm the correctness of the spin 3/2 model for each configuration, while the power-dependent intensities curves reveal the different dynamics of each. Qualitative analysis of these data shows that the spin-lattice relaxation time T1 has axial
anisotropy, while the spin-spin one T2 is almost
isotropic. Then, in the wider context of nanos-tructures, we explain how the power-study of the intensity ratio I∥/I⊥ allows for the separation be-tween signals arising from ordered and disordered phases when working in an EPR saturated regime.
II. EXPERIMENTAL
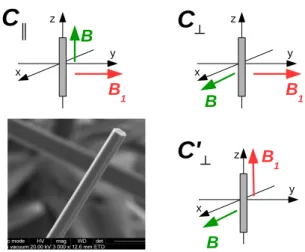
The wurtzite-crystallized ZnO:Co MW under study has been grown by the optical furnace method, described in previous papers20,22. The
SEM image in Fig. 1 shows a typical MW, with its hexagonal cross section. In all cases, the c-axis of the wurtzite structure is parallel to the long dimension of the MW, which is also taken to be the z-axis of the laboratory frame (see Fig. 1). In order to obtain the smallest EPR line width necessary to resolve the perpendicular hyperfine coupling (A⊥ ≡ 0.3 mT), the least Co-doped MW was chosen, among the completely transparent ones (green coloration increases with Co-doping20). Thus, dipolar broadening is
at its minimum and only excited-level lifetime and structural disorder, respectively, contribute to homogeneous and inhomogeneous EPR line broadening. For the intensity measurements in the three configurations, another MW slightly more doped has been used: in this one, all intensities are increased but also the line width so that the perpendicular hyperfine coupling A⊥ is not resolved.
The X-band (ν = 9.621 GHz) EPR spectra were recorded using a Bruker EMX spectrometer equipped with a standard TE102 cavity. The low
temperature (5 K) equilibrium was obtained by using a continuous helium-flow cryostat stabilized with an Intelligent Temperature Controller (Ox-ford, ITC 503). Regarding the orientation of the static (B) and of the microwave (B1) fields with
respect to the c-axis of the wurtzite MW, three configurations are possible, depicted in Fig. 1 and denoted by C∥, C⊥ and C⊥′ . Each of them gives a particular EPR intensity, with its own power- and temperature-dependence.
Sensitivity improvement was achieved by the use of a lock-in amplifier modulating the static B-field at a 100 kHz frequency. The amplitude of this
mod-Figure 1: (color online) Top and bottom-right: Schematic of the three field-configurations, C∥, C⊥and
C⊥′ , with respect to the c−axis (∥ z) of the wurtzite MW. Bottom-left: SEM image of individual ZnO:Co microcrystal showing the hexagonal section.
ulation was set to always avoid over-modulation phenomena (while keeping sufficiently intense sig-nal) down to 0.05 mT. Regarding the saturation recovery measurements, the incident microwave power P was controlled by an attenuation A = 10 log(P0/P ), with P0= 200 mW.
ZnO:Co MW images were performed in a FEI Quanta 200 scanning electron microscope (SEM).
III. RESULTS
A. Experimental and simulated spectra
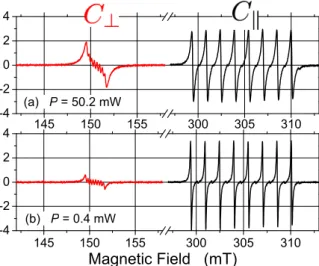
The experimental spectra of the ZnO:Co MWs recorded at T = 5 K in the C∥ and C⊥ field con-figurations are shown in Fig. 2 for high and low microwave power. The C⊥′ configuration spectrum is not shown because of the too low signal/noise ratio (see Sec. III C). No other signal than the Co-related one is detected, indicating the absence of contamination with paramagnetic impurities. In particular, none of the intrinsic defects observed in ZnO nanostructures are detected. The anisotropy of the S = 3/2 electronic spin of the Co2+ ion
is clearly seen by the different spectra position for the two orientations, while that of the hyper-fine coupling is represented by the different spac-ing between two adjacent lines of the octet spec-trum. Such spectra can be simulated by the follow-ing spin Hamiltonian, actfollow-ing in the 32-dimensional space produced by the electronic and nuclear spins, S = 3/2 and I = 7/2 respectively:
H = DSz2+ µB−→S .˜g.→−B +−→S . ˜A.−→I (1)
A Experimental and simulated spectra 3
uniaxial anisotropy (D > 0, easy plane), the Zeeman interaction (˜g) and the hyperfine coupling ( ˜A). The principal components of the ˜g and ˜A tensors can be directly read on these spectra, without any simulation, and independently of the microwave power. These are in accordance with the usual ZnO:Co values, g∥ = gef f∥ = 2.256 and g⊥ = gef f⊥ /2 = 2.283, A∥ = 16.07× 10⁻⁴ cm−1 and A⊥ = 2.98× 10⁻⁴ cm−1. We remark that the measurement of the A⊥ value necessitates a very low line width (< 0.3 mT), only reachable in very high quality single crystals. Only three previous works have reported such a measurement on ZnO:Co, Estle & De Wit (bulk material, 1967)23, Hausmann (bulk material, 1969)24 and
Jedrecy et al. (thin film, 2004)25. Here, the
crystal quality is such that the apparent EPR line width is as low as 0.08 mT, allowing for a precise determination of A⊥. This value can be used for simulation of low-resolved spectra. The determination of the axial anisotropy parameter D can not be directly performed with such X-band EPR spectra, but a relation linking it to the difference ∆g = g⊥− g∥= 0.027 has been derived in a previous work21, which gives an identical result here (D = 2.57 cm−1). 145 150 155 300 305 310 -4 -2 0 2 4 145 150 155 300 305 310 -4 -2 0 2 4 (b) P = 0.4 mW Magnetic Field (mT) (a) P = 50.2 mW
Figure 2: (color online) EPR spectra of ZnO:Co MW in C⊥(left, red) and C∥ (black, right) configurations, recorded in saturating (a) and off-saturating (b) con-ditions, at T = 5 K. All intensities are normalized.
While these spin Hamiltonian parameters are in-trinsically power-independent, we observe that the EPR line width and intensities vary with the in-cident microwave power (Fig. 2). This is because these are characteristics of the EPR resonance phe-nomena described by the time-dependent Hamilto-nian H1(t) = µBS.˜g.B1(t), with B1∝
√
P , and not of the material itself. Line width reaches its mini-mum as the incident power goes to zero, when the
resonance is not saturated. The intensities (double integration of spectra) obtained in C∥and C⊥ con-figurations appear to depend on the incident mi-crowave power, as well as their ratio I∥/I⊥. Within the experimental power range, this ratio varies be-tween 1 and 2; this cannot be accounted for by spectra simulation. Indeed, spectra obtained by simulation softwares as Easyspin26 do not include power dependence, which relies on complex relax-ation phenomena, but do describe a non-saturating limit, when P tends to zero and intensity is pro-portional to √P . By trying to simulate the two-orientations spectra of figure 2, only that with the lowest microwave power (P = 0.4 mW) gives a sat-isfactory result (Fig. 3) indicating a non-saturating regime. No parameter adjustment allows for a rea-sonable fit of the high power (P = 50.2 mW) mea-surement, which is then supposed to be saturated, out of current-simulation possibilities.
148 149 150 151 152 153 -8 -4 0 4 8 298 300 302 304 306 308 310 312 -60 -40 -20 0 20 40 Exp. Sim. Magnetic Field (mT) Exp. Sim.
Figure 3: (color online) Experimental EPR spectra of the ZnO:Co MW in C∥ (up, black circles) and C⊥ (down, red circles) configurations, recorded at T = 5 K and P = 0.4 mW (same data as Fig 2-b). Blue lines show simulated spectra from Eq. 1 with parameters discussed in the text.
The best obtained simulation with Easyspin26
shown in figure 3 includes a slight g-strain within the hexagonal cross section, that is a normalized narrow gaussian distribution of g⊥values of δg⊥= 0.002 width. This g-strain is likely to arise from minute stress within the hexagonal MW section. We remark that the line shape is Lorentzian, in-dicating a predominance of homogeneous broaden-ing. The global agreement between simulated and off-saturation experimental spectra in both config-urations C∥and C⊥is satisfactory, so that we con-clude that the S = 3/2 and I = 7/2 model coupled to the Hamiltonian (1) well describe substitutional Co2+ ions in ZnO.
A Experimental and simulated spectra 4
B. Temperature dependence
In order to test the validity of the model in the three configurations C∥, C⊥, and C⊥′ , we ex-amine the temperature dependence of their inten-sity obtained by the double-integration method. These measurements have been performed on an-other MW, a bit more cobalt-doped in order to increase the C⊥′ EPR intensity, but with the con-sequence that the line width is increased so that the perpendicular hyperfine coupling is no longer resolved. However, this increase in the line width does not affect at all the intensities, which might be fitted by EPR intensity formulae as well. In off-saturating conditions, the EPR intensities in the three configurations are described by formula (2), (3) and (4). These take into account the transition probability and the Boltzmann population differ-ence between the two resonating levels, but also the important frequency-to-field conversion factor27,28 and theT2∥ andT2⊥ transverse relaxation times30.
These latter can be passed in the K constant when fitting only one line, just as in Ref. 21, but not in the present case.
I∥(T ) = K g 2 ⊥T2⊥ √ P g∥T (1 + e−2D/kT) (2) I⊥(T ) = K g⊥T ⊥ 2 √ P 2T (1 + e−2D/kT) (3) I⊥′ (T ) = K g 2 ∥T2∥ √ P g⊥8T (1 + e−2D/kT) (4) The K-factor takes account for all other experi-mental parameters (static-field modulation, etc.) identical in the three configurations. Although the same in the three configurations, the √P dependence is explicitly written for completeness of the involved physical parameters. In order to reduce the number of parameters, we have fitted the experimental intensities by taking T2⊥ = T2∥, so that only the common factor K has been adjusted to obtain the fit of figure 5. Considering the uncertainty on the intensity measurement (from about 5% at low temperature to 10% at high temperature), the fitting agreement can be considered as fully satisfactory. Taking into account different transverse relaxation times (T2∥ ̸= T2⊥) results in a very poor improvement of the fits, so that these two relaxation times may reasonably assumed to be almost identical.
As the temperature tends to zero, the theo-retical ratio I∥/I⊥ (in non-saturating condition, P = 0.4 mW) tends to 2g⊥/g∥, that is 2.05, to be compared with the experimental ratio of 1.94 at T = 5 K. The temperature dependence of this ratio is slight and not of great importance because
5 10 15 20 0 2 4 6 8 10 12 E P R i n t e n s i t y ( a . u ) Temperature (K)
Figure 4: (color online) Open circles, squares and tri-angles: experimental EPR spectra intensities in C∥, C⊥ and C⊥′ field configurations, recorded in non-saturating condition (P = 0.4 mW). Solid lines: corresponding calculated intensities from Eq. (2), (3) and (4).
the EPR intensity in the three configurations rapidly goes to zero (for relaxation reasons), as the temperature exceed 15 K. On the contrary, this I∥/I⊥ ratio highly depends on incident microwave power P , as discussed now.
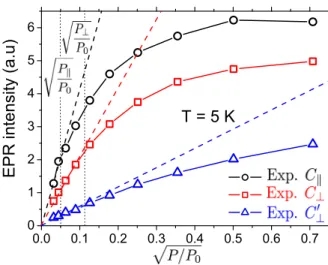
C. Power dependence
Aside of the precise determination of the spin Hamiltonian parameters from EPR spectra simulations and the temperature dependence study, it is interesting to study the spin dynamics in the three configurations. Such information can be partially extracted from the study of the EPR intensity-saturation curves (Fig. 5). Off-saturation regime is characterized by an intensity proportional to √P (see Eqs. (2), (3), (4)), thus appearing as straight lines at low power in figure 5. Saturation occurs when the rate of absorption become greater than the rate of relaxation, so that the Co2+ions can no longer absorb all the incident photons. Indeed, for the absorption phenomenon to reach a stationary state, the excited state lifetime must be much smaller than the mean time between two photon incidences, this latter depending on microwave power. In other words, the faster a set of microwave-excited Co2+ ions go back to their ground state by evacuating quantized energy toward the lattice, the more it can absorb microwave power.
Qualitatively, the power saturation phenomenon arises naturally from the classical Bloch equations. In the simple case of isotropic magnetic moment and without any inhomogeneous broadenning, the
C Power dependence 5
following factor can multiply the intensities (2), (3) and (4) in order to give account for the saturated regime29:
(1 + C.T1.T2.P )−1 (5)
where C is a constant assumed to be identical in the three configurations, T2 is the isotropic
trans-verse (along B1field) relaxation time discussed
be-fore, and T1 the longitudinal (along B field), or
spin-lattice, relaxation time. T1is equal to its
par-allel (T1∥) or perpendicular (T1⊥) value, according to the B-field orientation in the considered con-figuration (see Fig. 1). Then, qualitatively, the EPR phenomenon will enter a saturated regime even more rapidly as theT1T2 product gets larger,
which will be visible in the saturation curves by departure from the straight dashed-line.
0.0 0.1 0.2 0.3 0.4 0.5 0.6 0.7 0 1 2 3 4 5 6 E P R i n t e n s i t y ( a . u ) T = 5 K
Figure 5: (color online) Saturation curves of EPR in-tensities recorded at T = 5 K and 0.5 G modulation for the three magnetic-field configurations. Dashed lines illustrate the off-saturating regime while dotted lines indicate saturation occurences.
Thus, recalling that T2∥ = T2⊥, it is expected that C⊥ and C⊥′ configurations will saturate at the same power (because both have the same B-field orientation) which is indeed observed in figure 5. On the other hand, C∥ and C⊥ configurations have different B-field orientation, so that each of them is characterized by a different spin-lattice relaxation time, respectively T1∥ and T⊥
1 . As saturation occurs at lower power in
the C∥ configuration (see Fig. 5: P∥ < P⊥), we deduce that T1∥ > T1⊥. We can then conclude
that there is some anisotropy in the spin-lattice coupling, which is stronger in the hexagonal plane (shorter relaxation) than along the c-axis of the wurtzite structure (longer relaxation). It must be stressed out that the considered relaxation times are phenomenological parameters arising from the
classical isotropic Bloch equations, so that they can in fact include some other parameters such as the component of the effective ˜g-tensor. Access to the real relaxation times can be quantitatively reached by the combination of pulsed EPR meth-ods and fitting of the saturation curves including inhomogeneous phenomena, thus giving greater insight into the spin dynamics.
Another interesting information to be extracted from the saturation curves in figure 5 is the maximum power to which the resonance, in both configuration C∥ and C⊥, is off-saturation and can then be properly simulated by Easyspin software. Beyond this power, no adjustment of any parameter can give a satisfactory fitting. It is to be noted that this power can slightly depend on various experimental conditions, such as cavity quality-factor, sample volume, filling factor, etc, and must then be regarded as an approximate value. Figure 5 shows that the first apparition of saturated regime occurs in the C∥ configuration at a power defined by √P∥/P0 = 0.05, that is P∥= 0.5 mW.
D. Intensities anisotropy
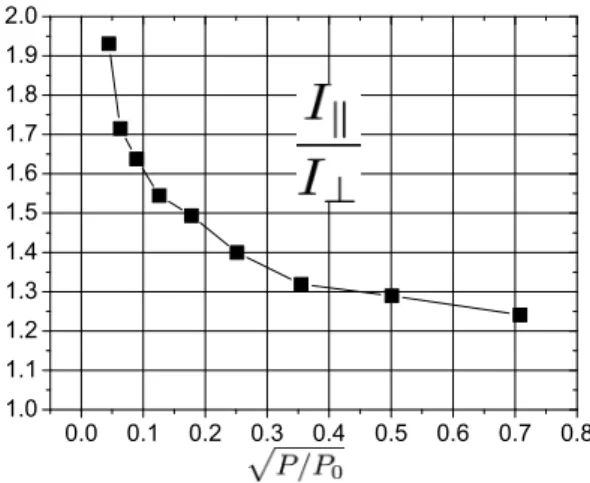
We now turn to the study of the I∥/I⊥ratio. As pointed out before, this ratio only slightly depends on temperature in the range 5-10 K, but notably does on the incident microwave power (see Fig. 6). Starting from a non-saturating regime in which I∥/I⊥ ≃ 2 at low temperature (around 5 K), each intensity increases as the incident microwave power is augmented, as shown in Fig. 5. However, due to different spin-lattice relaxation times in C∥ and C⊥configurations, the increase has a different rate and maximum value in each case, so that the intensity ratio changes with power.
The strongest interest for the knowledge of this I∥/I⊥ ratio power-dependence in single a microcrystal is that this latter is equivalent to an ideally orientated set of nanorods or nanowires. In this context of ZnO:Co nanostructures, the number of spins is weak so that high incident mi-crowave power is often required in order to obtain a detectable signal, leading to a saturated regime. Thus, a simple EPR simulation is not relevant and, as shown in a previous work18, the
exper-imental I∥/I⊥ ratio is systematically lower than 1, that is out of the figure 6 curve. The simplest interpretation for this deviation is that some other signal positively contributes to the I⊥ intensity, thus leading to a reduction of the considered ratio. Indeed, this contribution is likely to arise from a disordered phase of the ZnO:Co nano-objects
D Intensities anisotropy 6 0.0 0.1 0.2 0.3 0.4 0.5 0.6 0.7 0.8 1.0 1.1 1.2 1.3 1.4 1.5 1.6 1.7 1.8 1.9 2.0
Figure 6: Evolution of the I∥/I⊥ intensities ratio as a function of the microwave power (P0 = 200 mW),
recorded at T = 5 K.
which, in the case of totally random orientations (powder), give the spectrum of Fig. 7-c, that is a single assymmetric line located at the same B-field as for the C⊥ configuration (∼ 150 mT). This hypothesis is strongly supported by the shape of the I⊥ intensity observed in Ref. 18, which shows a pronounced asymmetry just as in the powder spectrum signal (Fig. 7).
150 200 250 300 -0.8 0.0 0.8 -80 0 80 Magnetic field (mT) (c) Powder (b) -400 0 400 (a)
Figure 7: (color online) EPR spectra simulations of ideally orientated [(a) and (b)] and totally disordered (c) sets of ZnO:Co nanorods.
In this scenario, the ZnO:Co nanostructures EPR spectra would be the superposition of ordered- and disordered-phase signals. In a non-saturating resonance regime, the total signal can be simulated, which directly gives access to
the proportion of ordered and disordered phases. However, as seen before, the maximum power for such a non-saturating case is very low (0.5 mW) so that, in many cases, the incident microwave power will be greater than that, which correspond to an abscissa greater than 0.05 in figure 6. Then, at such a given microwave power, the knowledge of the single-crystal I∥/I⊥ ratio would permit, if it exists, to determine the amount of non-ordered signal intensity at 150 mT. Appropriate simulation of this remaining intensity would thus allow for the approximate quantification of Co2+ ions in
ordered and disordered phase. Refinement of this quantification could be reached by considering ori-entated powder, or other particular distribution of spin orientations, rather than a totally disordered phase. Finally, the only difficulty would be to correctly simulate the (oriented-) powder spectra for any microwave power, including the saturated regime.
IV. CONCLUSION
Electronic and nuclear magnetic properties of
59Co2+ ions embedded in a tetrahedral local
sym-metry, as arising in ZnO:Co, show interesting and sizeable orientation dependence. In this pa-per, we have reported the use of these magnetic anisotropies for the crystal-quality characteriza-tion of low-doped ZnO:Co microcrystals. The use of three EPR configurations and the study of each resulting intensity temperature- and power-dependence have allowed for the validation of (S = 3/2, I = 7/2) model with easy-plane uniaxial elec-tronic spin anisotropy. By the way, these studies have shown that the phenomenological spin-spin relaxation time must be isotropic, while the spin-lattice relaxation time appears to be anisotropic, with T1∥ > T1⊥. Finally, in the context of ori-entated nanostructures as nanorods or nanowires, we have shown how the power dependence of the I∥/I⊥ ratio can reveal the proportion of ordered and disordered phases.
V. ACKNOWLEDGEMENT
This work was supported by the NATO project Science for Peace (SfP) 984735, Novel nanostruc-tures. A. Savoyant acknowledges Prof. Andr´e Ghorayeb for fruitful discussions and corrections.
1 H. Ohno, Science 281, 951 (1998). 2 ˇ
Zuti´c I, Fabian J and das Sarma S 2004 Rev. Mod.
Phys. 76 323
3
Neu-7
mark G F 2004 Appl. Phys. Lett. 85 3833
4 Willander M, et al 2009 Nanotechnology 20 332001 5
U. Ozgur, D. Hofstetter and H. Morkoc, Proc. IEEE vol. 98, no. 7 , pp. 1255-1268, 2010.
6 Z. L. Wang and J. Song, Science 312, 242 (2006). 7
Y. Xi, J. Song, S. Xu, R. Yang, Z. Gao, C. Hu, and Z. L. Wang, J. Mater. Chem., 2009, 19, 9260-9264.
8 H. Parangusan, D. Ponnamma, and M. Al Ali
Al-Maadeed, Sci. Rep. 8, 754 (2018).
9
W. Zang, P. Li, Y. Fu, L. Xing, and X. Xue, RSC
Adv., 2015, 5,84343.
10
K. Momeni, G. M. Odegard, and R. S. Yassar, Acta
Materialia 60 (2012), 5117-5124.
11 Duan L B, Chu W G, Yu J, Wang Y C, Zhang L N,
Liu G Y, Liang J K and Rao G H 2008 J. Magn.
Magn. Mater. 320 1573
12 Lin C Y, Wang W H, Lee C-S, Sun K W and Suen
Y W App. Phys. Lett. 94, 151909 (2009)
13
Gandhi V, Ganesan R, Syedahamed H H A and Thaiyan M, J. Phys. Chem. C 2014, 118 (18), pp 9715-9725
14
Kumar S, Song T K, Gautam S, Chae K H, Kim S S and Jang K W 2015 Mat. Res. Bull 66 76
15 Chanda A, Gupta S, Vasundhara M, Joshi S R,
Mutta G R and Singh J, RSC Adv. 2017, 7, 50527-50536
16 S. M. Siagian et al. 2017 J. Phys.: Conf. Ser. 795
012009.
17
P. Sati et al. 2006 phys. Rev. Lett. 96 017203.
18 A. Savoyant, H. Alnoor, O. Pilone, O. Nur, and M.
Willander, Nanotechnology 28, 285705 (2017)
19
C.-W Liu, S-J Chang, S. Brahma, C-H Hsiao, F. M. Chang, P. H. Wang, and K-Y Lo, J. Appl. Phys.
117, 084315 (2015).
20
A. Savoyant, F. Giovannelli, F. Delorme, and A. Stepanov, Semicond. Sci. Technol. 30 (2015) 075004.
21
A. Savoyant, H. Alnoor, S. Bertaina, O. Nur, and M. Willander, Nanotechnology 28, 035705 (2017)
22 F. Giovannelli, G. Rajonson, J. Wolfman, and F.
Delorme, Mater. Lett. 107, 194 (2013).
23
T. Estle, M. De Wit, Bull. Am. Phys. Soc. 6, 445 (1961).
24 A. Hausmann, Phys. Status Solidi 31 (1969) K131. 25
N. Jedrecy, H. J. von Bardeleben, Y. Zheng, and J-L. Cantin, Phys. Rev. B 69, 041308(R) (2004).
26 S. Stoll and A. Schweiger, J. Magn. Reson. 178, 42
(2006).
27
J. R. Pilbrow, J. Magn. Reson. 58, 186 (1984).
28 R. Aasa and T. V¨anng˚ard, J. Magn. Reson. 19, 308
(1975).
29
J. A. Weil and J. R. Bolton, Electron Paramagnetic
Resonance, Wiley-Interscience p. 314.
30 T
2times characterizes the relaxation time along the
microwave field B1 direction, with a priori two