HAL Id: hal-01694006
https://hal.archives-ouvertes.fr/hal-01694006
Submitted on 7 May 2018HAL is a multi-disciplinary open access archive for the deposit and dissemination of sci-entific research documents, whether they are pub-lished or not. The documents may come from teaching and research institutions in France or abroad, or from public or private research centers.
L’archive ouverte pluridisciplinaire HAL, est destinée au dépôt et à la diffusion de documents scientifiques de niveau recherche, publiés ou non, émanant des établissements d’enseignement et de recherche français ou étrangers, des laboratoires publics ou privés.
111 facet growth laws and grain competition during
silicon crystallization
V. Stamelou, M. G. Tsoutsouva, T. Riberi-Beridot, G. Reinhart, G. Regula, J.
Baruchel, Nathalie Mangelinck-Noël
To cite this version:
V. Stamelou, M. G. Tsoutsouva, T. Riberi-Beridot, G. Reinhart, G. Regula, et al.. 111 facet growth laws and grain competition during silicon crystallization. Journal of Crystal Growth, Elsevier, 2017, 479, pp.1-8. �10.1016/j.jcrysgro.2017.09.013�. �hal-01694006�
1
{111} facet growth laws and grain competition during silicon crystallization
V. Stamelou1, M.G. Tsoutsouva1, T. Riberi-Béridot1, G. Reinhart1, G. Regula1, J. Baruchel2 and N. Mangelinck-Noël1,*
1
Aix Marseille Université, CNRS, IM2NP UMR CNRS 7334, Campus St Jérôme, case 142, 13397 Marseille Cedex 20, France
2
ESRF, 71 avenue des Martyrs, CS40220, 38043 Grenoble Cedex 9, France
Abstract
Directional solidification from mono-crystalline Si seeds having different orientations along the growth direction is studied. Due to the frequent twinning phenomenon, new grains soon nucleate during growth. The grain competition is then characterized in situ by imaging the dynamic evolution of the grain boundaries and of the corresponding grain boundary grooves that are formed at the solid-liquid interface. To perform this study, an experimental investigation based on Bridgman solidification technique coupled with in situ X-ray imaging is conducted in an original device: GaTSBI (Growth at high Temperature observed by X-ray Synchrotron Beam Imaging). Imaging characterisation techniques using X-ray synchrotron radiation at ESRF (European Synchrotron Radiation Facility, Grenoble, France) are applied during the solidification to study the growth dynamics. Facetted / facetted grain boundary grooves only are studied due to their importance in the grain competition because of their implication in the twinning mechanism. The maximum undercooling inside the groove is calculated from the groove depth knowing the local temperature gradient. Additionally, thanks to dynamic X-ray images, the global solid-liquid interface growth rate and the normal growth rate of the {111} facets existing at the grooves and at the edges are measured. From these measurements, experimental growth laws that correlate the normal velocity of the {111} facets with the maximum undercooling of the groove are extracted and compared to existing theoretical models. Finally, the experimental laws found for the contribution to the undercooling of the {111} facets are in good agreement with the theoretical model implying nucleation and growth eased by the presence of dislocations. Moreover, it is shown that, for the same growth parameters, the undercooling at the level of the facets (always lower than 1 K) is higher at the edges so that there is a higher probability of twin nucleation at the edges which is in agreement with the grain structure development characterised in the present experiments as well as in the literature.
*Manuscript
2
Keywords: A1. Directional solidification; A1. Characterization; A1. Growth laws; A1. {111}
facets; A2. Growth from melt; B2. Semiconducting silicon.
Introduction
The acute need for alternative sources of energy to fossil fuels is widely accepted but it is not free from economic constraints, and brings new technological and scientific challenges. In the last decades, renewable energies and more precisely photovoltaics (PV) have emerged as a source of more environmentally friendly source of energy production.
Crystalline silicon (c-Si)-based photovoltaic cell technology is well-established and currently represents about 90% of the world PV market but faces regularly new challenges due to the constantly renewed demand for higher performance together with a decrease of the cost. Among the main steps of Si material fabrication, the central one is the solidification from melted silicon. Indeed, grain structure, impurities and structural defects (the major ones being dislocations) induced during this crystal growth process have a major impact on the final PV efficiency. However, the involved fundamental mechanisms and growth laws that define the final grain structure are still not fully established preventing an efficient and reproducible control and modelling of the silicon crystallization [1].
In fact, the grain structure in multi-crystalline silicon largely depends on a series of phenomena related to faceting/undercooling of the solid-liquid interface during growth as for example twinning [2-4].
Facets at the solid-liquid interface can be found at the edges of the samples or inside the grain boundary grooves formed at the intersection of a grain boundary with the solid-liquid interface [5]. In the case of crystalline silicon, all the crystallographic orientations are rough except the {111} planes which have a facetted morphology, as confirmed by the calculation of the Jackson criterion for the main crystallographic orientations [6]. The presence of {111} facets is thus an essential feature of silicon grain growth and competition. Indeed, frequent twinning nucleation take place at the level of the {111} facets in the grain boundary grooves or at the edges of the samples [7, 8].
Grain boundary grooves can have one of the three following configurations, depending on the crystallographic orientation of the adjacent grains [5, 9]: i) rough solid-liquid interface on both sides of the groove ii) rough/facetted groove and iii) facetted/facetted groove, when the grain boundary groove consists of two facets. It is essential to study the groove dynamics as it
3
is directly linked to the grain competition [10] because of its interdependence with the grain boundary orientation relatively to the solidified direction [11].
In general, the normal growth velocity at the solid-liquid interface can be expressed as a function of the undercooling and is typically expressed by:
(1)
where β(T) is the kinetic coefficient and ΔΤ the kinetic undercooling. The kinetic
coefficient can be a function of the undercooling and is different for different types of growth. Indeed, the incorporation of a structural unit at the interface is not always favoured. The increase of the interfacial energy needs to be compensated by a gain in volume enthalpy. The key parameter is the geometric configuration of the system and the number of atomic neighbours. The incorporation is all the more difficult as the interface is smooth as on {111} facets [12]. In the case of a facetted {111} Si solid-liquid interface, two theoretical laws are proposed in the literature.
First, bi-dimensional nucleation can be considered. In that situation, the proposed relation is given for example by the following equation [13]:
in (2).
Depending on the authors, the constants can differ but this does not change significantly the resulting law and typical groove undercooling values [14]. The result of this approach is that a high undercooling (several degrees) is needed in the case of growth on {111} silicon facets (solid black line Figure 1) which is not what is observed during experiments [15].
Fig. 1: Theoretical growth law curves relating the facet velocity Vf to the undercooling T at the
level of a {111} facet. Bi-dimensional law from Miller [13] in solid black line, quadratic law from Voronkov [17] in dotted black line.
Another mechanism implying defect presence was thus theoretically proposed. If the crystal is not perfect, for example due to the presence of a screw dislocation emerging at the solid-liquid interface, the smooth facetted interface is no longer perfectly flat but shows a step [16]. The presence of steps implies that the facet can grow at lower undercooling compared to the case of bi-dimensional growth. When atoms are added, the step persists and for a single screw dislocation, the result is a spiral. The growth rate as a function of the undercooling is then controlled by a quadratic law and can be generally written as:
4
(3)
where K is a constant parameter dependent on the dislocation density.
Voronkov [17] also explained theoretically and confirmed experimentally how a single dislocation can significantly modify the facet size and undercooling. Finally, from theoretical considerations and comparison to Czochralski Si fabrication process experiments, he proposed a value for the kinetic coefficient in equation (3) giving the following law:
in m.s-1
(4).
Importantly, growth laws from equations (2) and (4) give values of undercooling that differ by one order of magnitude as can be seen figure 1.
Abe [18] confirmed experimentally for Czochralski growth that dislocations intersecting the {111} facets in silicon decrease the growth undercooling. Indeed, this author showed that, in his experiments for pulling rates between 1.3 x 10⁻⁵ and 2.5 x 10⁻⁵ m.s-1, the facet undercooling in Si crystals containing dislocations and dislocation-free <111> Si crystals is respectively T = 7 x 10⁻¹ K and T = 9 K. These values are in agreement with the above considerations as concern the order of magnitude when comparing dislocation free Si and Si crystals containing dislocations. However, a value of K between 2.7 x 10⁻⁵ and 5.1 x 10⁻⁵m.s
-1
.K-2 is obtained with equation (3) for the experimental data provided by Abe [18]. This value is one order of magnitude smaller than the coefficient proposed by Voronkov [17].
As seen above, theoretical models of the {111} facet growth laws exist but there is a striking lack of experimental validation in particular for directional solidification used widely for the fabrication of multi-crystalline ingots and for which process modelling is needed.
In the work presented here, our main objective has been to determine the contribution to the undercooling of the {111} facets in both grain boundary grooves and at sample edges during directional solidification of silicon using X-ray imaging, to derive corresponding {111} facet growth laws and then to compare them with theoretical growth models reported in the literature.
Experimental Procedure
GaTSBI (Growth at high Temperature observed by Synchrotron Beam Imaging) is a unique device to study the solidification of Si that allows following in real time the solidification process during growth. It is a specially designed instrument composed of a high temperature directional solidification (DS) furnace coupled with synchrotron radiation X-ray
5
imaging techniques (Bragg diffraction imaging and radiography). The directional furnace is based on two resistive heating elements (top and bottom). The silicon sample, housed in a boron nitride crucible, is introduced inside the DS furnace. The front and back sides of the sample (38 mm × 5.8 mm × 0.3 mm) are in contact with the crucible walls. Solidification experiments are performed under dynamic vacuum (~10-6 mbar).
The polychromatic synchrotron radiation illuminates the Si sample during the whole crystal growth process. In the X – ray radiography mode used here, after passing through the sample, the polychromatic beam is monochromated at 17.5 keV using a vertically diffracting Si (111) double-crystal monochromator. Experiments were carried out at beamline BM05 at the European Synchrotron Radiation Facility (ESRF). The X – ray radiography images are recorded using a specific CCD camera developed at the ESRF named FReLoN (Fast Readout Low- Noise) with 2048×2048 image pixel size. In the experiments described in the following, an optics giving 5.8 μm pixel size and 11.9 × 11.9 mm2 field of view was used.
The obtained X-ray radiography images are absorption contrast images due to the differences in absorption of the solid and liquid phases. However, the absorption coefficients of the solid and liquid silicon depend on the corresponding mass densities whose values are close to each other (ρs = 2.31 g/cm3 and ρl = 2.56 g/cm3) which means that the solid-liquid
interface in the raw images is hardly distinguishable. In order to observe the shape of the interface more accurately (rough or facetted for instance), image processing which consists in dividing successive images, i.e. dividing the current image by the previous image [19], to enhance the solid-liquid interface contrast is performed. After the image processing is done, images of the solid-liquid interface during the solidification are obtained in which the denser liquid and the solid appear in dark and light grey respectively.
The X-ray radiography mode allows extracting information concerning the interface morphology, its dynamic evolution, to calculate its velocity and to study the grooves between two grains formed by the intersection of the grain boundary separating them with the solid-liquid interface. A more detailed description of the whole equipment, of the imaging techniques, of the image processing and of the previously obtained results can be found elsewhere [7, 11].
In experiments described in the following, a constant temperature gradient, GAPP = 37.5
K/cm, is imposed between the two heating resistances. Three different Si samples obtained by the floating zone process (SIL’TRONIX intrinsic monocrystalline silicon with a resistivity higher than 5000 cm) are solidified. These samples are cut from the same Si <110> wafer in order to study different orientations along the growth direction. To ease the reading, the
6
three samples are referred as FZ<100>, FZ<111> and FZ<110> with respectively <100>, <111> and
<110> seed crystallographic orientations parallel to the growth direction. Initially, the samples are partially melted to be able to initiate growth from the seed then, the crystal is solidified first taking up the initial orientations of the seed. Directional solidification of the remaining liquid is obtained by applying a cooling rate R = 1 K/min on both heaters. Several melting / solidification cycles are carried out with each sample to obtain a better statistic on the measurements.
Experimental results
As a first step, the average solid-liquid interface velocity is calculated from the radiograph successive images for the three different samples submitted to the same applied processing conditions (temperature gradient and cooling rate). In order to do so, the height of the interface is measured in different snapshots and the progress of the interface from one snapshot to another is calculated. It is important to notice that as the solid-liquid interface is not perfectly flat, to improve the accuracy, measurement are carried on at the same point of the solid-liquid interface and some averaging is performed. As the precise time difference between the images is known, the solid-liquid interface growth rate (Vg) can be calculated.
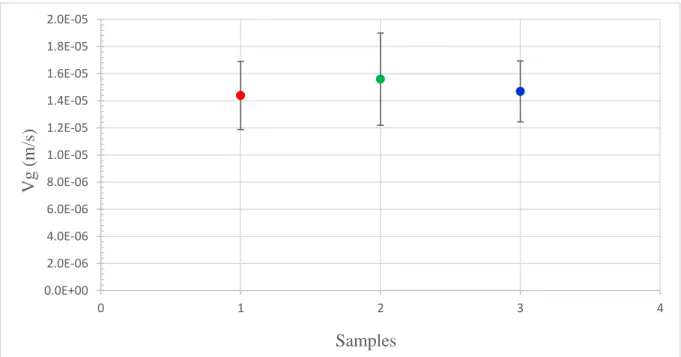
The results of these measurements for the three different samples are depicted in figure 2.
Fig. 2: Mean growth rate (Vg) of the solid-liquid interface for the three different samples analysed.
The FZ<100> (red point), FZ<111> (green point), and FZ<110> (blue point) samples have respectively
<100>, <111> and <110> seed crystallographic orientation parallel to the growth direction. Bars are given by the standard deviation of the growth rate distribution. Processing conditions: applied
temperature gradient GAP = 37.5 K/cm, cooling rate R = 1 K/min.
As can be seen in the graph of figure 2 showing also the standard deviation of the distribution, the growth rate of the solid-liquid interface of the three samples is comparable for the same processing conditions ensuring reproducibility of our experiments as was also verified in previous experiments.
Second, in order to determine {111} facet growth laws, the grain boundary grooves observed at the solid-liquid interface have been geometrically characterized by their angle and depth as can be seen in figure 3 in the case of an ideal facetted/facetted groove [20].
Fig. 3: Sketch of a facetted/facetted grain boundary groove at the solid-liquid interface with its characteristic parameters [20]: groove angle (), normal facet growth rate (Vf), groove depth (h),
7
These geometrical parameters of the grain boundary grooves are measured directly on the radiography images collected during solidification. Moreover, the kinetic parameters which are the growth velocity of the interface (Vg) and the normal growth velocity of the groove
facets (Vf) are also measured thanks to in situ and real-time X-ray imaging of the solid-liquid
interface. It is worth noting that in all experiments, the crystallographic orientation of the facets was checked after the experiments using EBSD measurements. Facets observed in our experiments are always {111} facets as expected in silicon [6].
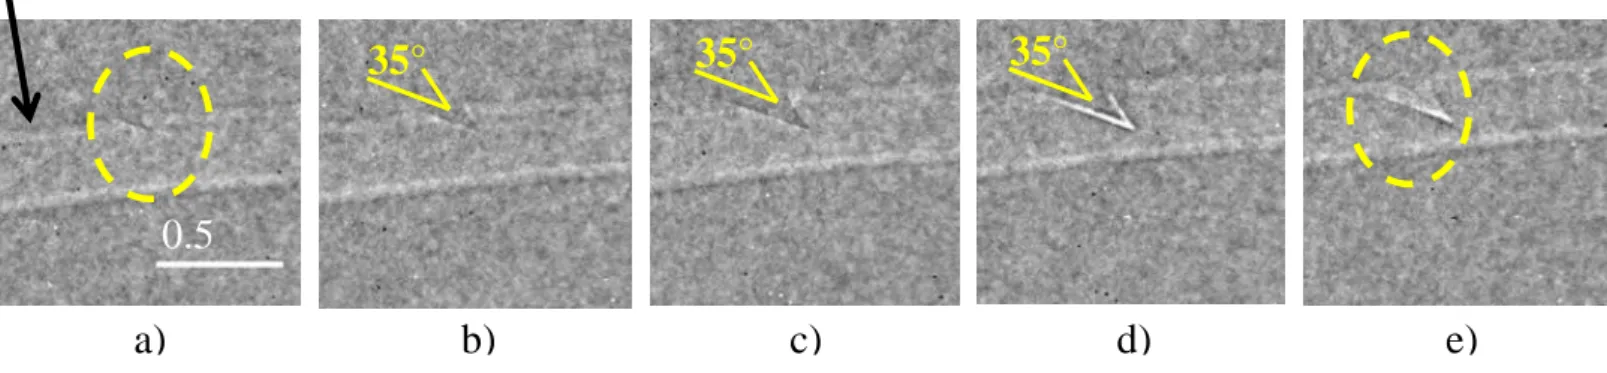
The evolution during solidification of a typical facetted / facetted grain boundary groove observed at the solid-liquid interface is shown in figure 4.
Fig. 4: Image sequence showing the evolution of a typical facetted/facetted groove at the solid-liquid interface during directional solidification of the FZ<100> Si sample. Applied temperature
gradient: GAPP = 37.5 K/cm, cooling rate R = 1 K/min at t0, a) t0 + 352 s, b) t0 + 355 s, c) t0 + 358 s, d)
t0 + 361 s, e) t0 + 364 s.
In figure 4, we follow a grain boundary groove at the solid-liquid interface (Figure 4a). The groove gets deeper (Figure 4b-d) while keeping the same angle during growth and at last, there is a nucleation inside the groove (Figure 4e). This sequence is typical for the majority of the grooves detected in our samples.
From the depth measurement, the thermal undercooling inside the grain boundary groove can be calculated knowing the local temperature gradient.
First of all, the local temperature gradient is determined experimentally making the assumption that the cooling rate is the same in the whole sample and that it corresponds to the imposed cooling rate applied to the heaters. So, the local temperature gradient is calculated with the following equation:
(5)
where R (K/min) is the cooling rate imposed to the heaters and Vg is the measured growth
rate of the solid-liquid interface.
Then, the undercooling ΔΤ (Κ) inside the groove is determined by the following equation:
8
where h is the depth of the groove. As the groove depth is evolving during growth, we calculate the maximum undercooling inside the grooves using equation (6) taking the grain boundary groove maximum depth for h in the equation.
Additionally, from the radiograph images obtained during our experiments, the normal velocity of the {111} facets in the grooves is measured.
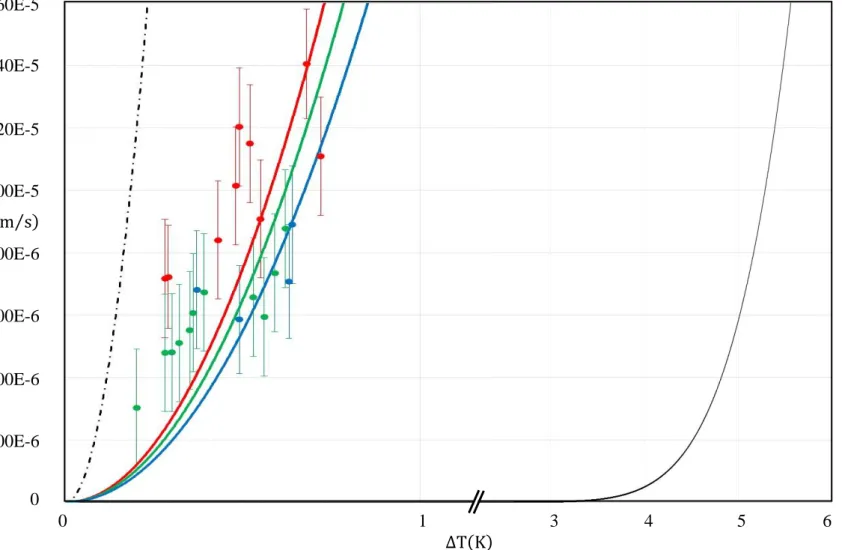
Eventually, the results of the mean facet velocity measurements as a function of the undercooling, inside the grain boundary grooves, can be seen in figure 5. Polynomial fits are also plotted with the reasonable hypothesis that the facet velocity is equal to zero when there is no undercooling. The black dotted curve in this graph represents the Voronkov quadratic law (equation 4) and the bi-dimensional exponential law (equation 2) is shown in solid black line. Finally, the adjustment of a quadratic growth law (equation 3) to our experimental points results in the following equations for the contribution of the facets to the undercooling:
. FZ<100>: Vf (m/s) = 2.8 x 10⁻⁴ ΔT2 (K),
. FZ<110>: Vf (m/s) = 1.0 x 10⁻⁴ ΔT2 (K).
If all experimental points are considered together, the resulting quadratic law obtained is: Vf (m/s) = 1.2 x 10⁻⁴ ΔT2 (K).
Fig. 5: Mean facet normal velocity (Vf) in grain boundary grooves for FZ<100> (red points and adjusted
curve) and FZ<110> (blue points and adjusted curve) samples as a function of the maximum
undercooling. Error bars are calculated by . The black dotted curve corresponds to the Voronkow law [17] and the black solid line curve to the bi-dimensional law [13].
Apart from the formation of grooves at the solid-liquid interface, facets at the edges of the samples are also frequently observed as shown in figure 6. Indeed, {111} facets are generally existing at the edges of the solid-liquid interface in the ingots and lead to the occurrence of twinning ultimately competing with the central grain growing from the seed [3, 7].
Fig. 6: FZ<100> Si sample: a) Crystallographic orientation of the grains along the growth direction
obtained by EBSD after sample solidification (Inverse pole figure map). b) Radiograph image at the level of the solid-liquid interface showing {111} edge facets.
As a consequence, the normal velocity has also been measured at the level of edge facets and points are gathered as a function of the undercooling in figure 7. The projection effect due to the radiography method was corrected to obtain the normal velocity Vf that we want to
9 Fig. 7: Mean facet normal velocity at the sample edges for FZ<100> (red points and adjusted curve),
FZ<111> (green points and adjusted curve), FZ<110> (dark blue points and adjusted curve) samples as a
function of the maximum undercooling. Error bars are calculated by . The black dotted curve corresponds to the Voronkow law [17] and the solid black line to the bi-dimensional law
[13].
For {111} facets at the edges, the experimental laws are given by:
. FZ<100>: Vf (m/s) = 2.0 x 10⁻⁵ ΔT2 (K),
. FZ<111>: Vf (m/s) = 3.0 x 10⁻⁵ ΔT2 (K),
. FZ<110>: Vf (m/s) = 3.0 x 10⁻⁵ ΔT2 (K).
If all experimental points are considered together, the resulting quadratic law obtained is: Vf (m/s) = 3.0 x 10⁻⁵ ΔT2 (K).
For the three seed growth orientations, the kinetic coefficient of the quadratic growth law for {111} facets at the edges is one order of magnitude smaller than the one found for {111} facets in a groove.
Discussion
From the observation of the solid-liquid interface during solidification by X-ray radiography of three samples with initial seeds oriented <100>, <111> and <110> along the growth direction, we can first conclude that the solid-liquid interface is morphologically stable for our processing conditions.
As can be seen on figure 2, the mean global interface growth rate depends solely on the processing conditions applied, that are identical for the three samples, and this proves that thermal conditions are reproducible and well controlled.
Locally, grooves are observed at the solid-liquid interface due to the presence of grain boundaries in the sample and highlight the existence of several grains even though the initial seed is monocrystalline. This is due to twin nucleation inducing subsequent grain competition as already discussed in our previous work [7].
From the measurement of the global interface growth rate, we can also conclude that as expected, the pristine orientation of the seed does not affect the mean velocity of the solid-liquid interface during directional solidification.
Moreover, when comparing the growth rate of the global solid-liquid interface (Figure 2) for the three samples to the {111} facet growth rates (Figures 5 and 7), it appears that the growth rates of the {111} facets either inside the grooves (Figure 5: Vf = 7.2 x 10⁻⁶ m/s in
10 average, standard deviation = 2.2 x 10⁻⁶ m/s) are in any case smaller than the one of the global solid-liquid interface (Figure 2: Vg = 1.5 x 10⁻⁵ m/s in average, standard deviation = 6.2 x 10⁻⁷
m/s). This can be expected because of the slower kinetics of the {111} planes. Indeed, the {111} facets have a slower kinetics than the other orientations so that they are lagging behind them. Consequently, they appear below the global solid-liquid interface on the images.
Recently, we showed that there exists undercooling of the global solid-liquid interface of a few kelvins for the processing parameters used in our experiments [21]. Thus, the measured undercooling inside the grain boundary groove or at the level of the edge facets is an additional component to the undercooling. A major consequence is that the undercooling is higher in the groove and at the level of the edge facets compared to the one at the level of the global solid-liquid interface. This favours nucleation events inside grooves and at the edge facets that are indeed often observed in real time during our experiments.
Inside a facetted / facetted groove as can be seen for example in figure 4, until nucleation can take place, both facets grow at the same growth rate as can be concluded from the constant angle and orientation of the groove in all observed facetted/facetted grain boundary grooves studied. This conclusion is also sustained by the X-ray radiography images contrast as can be seen in figure 4d and in our previous work [5]. Indeed, in figure 4d, the white areas on the facets evidence the new grown solid between two successive images because of the image processing performed. These white regions have the same thickness on both facets; this is due to the concomitant growth at the same rate of both facets seen in figure 4d. Inside a particular facetted / facetted grain boundary groove, the growth kinetics is thus equivalent on both facets. Moreover, according to the images, it seems that growth is homogeneous on the facets along the depth of the groove even though the undercooling should not be constant from the bottom to the top of the grain boundary groove. Moreover, inside the grain boundary grooves, the measured maximum undercooling is always lower than 1 K ranging from 1 x 10⁻¹ to 4 x 10⁻¹ K.
At the level of the edge facets, the measured maximum undercooling is also always lower than 1 K as for facets inside grain boundary grooves. However, higher values (ranging from 2 x 10⁻¹ to 8 x 10⁻¹ K) compared to the undercooling inside grain boundary grooves (ranging from 1 x 10⁻¹ to 4 x 10⁻¹ K) are measured at the edges. We consider that this result is significant because the same evolution is obtained for several samples and for both grooves at the edges independently from possible sample particularities.
In solidification experiments, the solid-liquid interface is generally not perfectly planar because of isotherm shape which in our experiments is slightly convex. Due to the latter, a
11
greater undercooling of the facets observed at the edges can indeed be expected in comparison with the one of the facets in the grain boundary grooves. Part of the undercooling of the facets at the sample edges close to the crucible walls can be attributed to the Gibbs-Thomson effect at the corner of the solid-liquid interface [3]. The Gibbs-Thomson effect in crystal growth refers to the fact that the melting point of a crystal is decreased with decreasing radius of curvature of the interface. Additionally, the interface with vacuum at the edges modifies the equilibrium shape balance adding vacuum to the solid-liquid-crucible equilibrium and might induce an increase of the facet height at the edges of the sample [22].
The higher undercooling measured at the level of the facet at the edges has a significant impact on the grain structure obtained at the end of the solidification by increasing the nucleation probability during growth. This is clearly confirmed by the grain structure obtained in the samples at the end of the experiments (Figure 6) for which twin nucleation is frequent at the far edges of the facets. This major contribution of twins nucleating on edge facets to grain competition and final grain structure was previously reported [3, 7].
At last, growth rate was also measured at the level of grain boundary grooves and edge facets. According to the large difference of the order of magnitude of the characteristic undercooling obtained for the corresponding {111} facet growth velocity, bi-dimensional nucleation growth mechanism can be excluded. Indeed, as seen above, undercooling inside the grain boundary grooves and at the level of edge facets is always lower than 1K. As a consequence, the experimental results concerning {111} facets kinetics in our experiments can only be compared to the theoretical law corresponding to a growth mechanism eased by the presence of dislocations (Figures 5 and 7). This is in agreement with the fact that dislocations are expected to be easily generated during silicon growth and found emerging at the level of facets as shown for example in [7, 8, 23]. On the one hand, the kinetic quadratic law coefficient obtained in the case of grain boundary grooves is consistent with the one obtained by Voronkov [17]. On the other hand, the coefficient obtained for the quadratic law at the edges is one order of magnitude lower than the one determined for the grain boundary grooves which is a direct consequence of the higher undercooling measured at the edges for the same growth rate. It is worth noting that the obtained quadratic law coefficient is then very comparable to what was measured by Abe [18].
However, the most important result remains that the undercooling either inside grain boundary grooves or at the level of facet edges is in any case lower than 1 K.
12
Conclusion
In situ radiography imaging was successfully used to characterise the {111} facets kinetics during seeded silicon growth. As a first step, from the successive image videos created for each sample during solidification, the growth velocity of the global solid-liquid interface is measured. For the same process conditions, the velocity is identical disregarding of the sample seed orientation from which we conclude that the orientation of the starting seed does not play any role on the establishment of the general solid-liquid interface growth rate and that the thermal conditions are reproducible for identical process parameters applied.
The angle and depth of the grain boundary grooves are measured directly and the velocity of the facets that form the groove is calculated from the successive images recorded during solidification. The maximum undercooling for each groove is calculated from the groove maximum depth and calculated local temperature gradient. The first main result is that the facet undercooling value is in all cases limited to less than one Kelvin. Moreover, from these measurements, an experimental law that correlates the normal velocity of the {111} facets with the contribution to the undercooling of the groove is extracted. This experimental law is adjusted to a quadratic law with the reasonable assumption of a zero value for the growth rate in the case of no undercooling. The quadratic law has been chosen because it is the only theoretical law available leading to undercooling with an order of magnitude corresponding to the one measured in our experiments i.e. lower than 1 K. Indeed, the other available theoretical law developed for {111} facet growth, namely bi-dimensional growth law, cannot be compared successfully with the experimental results. As quadratic theoretical laws were derived for the situation of nucleation and growth eased by the presence of dislocations, we can conclude that we are most likely in this situation in our experiments. This can be expected because dislocations, twins or stacking faults are always present in PV cast silicon and in our samples as observed regularly and previously in our experiments [7]. More precisely, quadratic growth law coefficient for {111} facets inside grain boundary grooves can be compared successfully to the value determined by Voronkov [17] in the case of Czocralski process for {111} facets containing dislocations.
During Si growth, facets at the edges of the samples are also observed in the radiography images. At the level of the edge facets, the angle that they form with the edge of the crucible, the depth and the {111} facet normal velocity is measured as well. An experimental law correlating the facet normal velocity with the contribution to the undercooling at the edges is extracted in this case too. As for the {111} facets in the grooves, the measured undercooling
13 value (lower than 1 K) can only correspond to theoretical laws derived for the situation of nucleation and growth facilitated by the emergence of dislocations on facets. However, the results show that the experimental undercooling at the edges is higher than inside the grooves. The origin of this difference is attributed to the effect of the shape of the interface and to complex equilibrium balance of surface energies at the edges including vacuum and crucible. As a consequence, the coefficient of the quadratic growth law extracted for facets at the edges is lower by an order of magnitude compared to the one measured inside the grain boundary grooves. The major impact of this measured higher undercooling although always lower than 1 K is that a higher nucleation probability is expected at the edges. This is in perfect agreement with the repeated nucleation of twins observed at the edges of the sample during the experiments.
Acknowledgments
This work was funded by the ANR Project CrySaLID (N° ANR-14-CE05-0046-01). The ESRF (European Synchrotron Radiation Facility) BM05 team is acknowledged for support during the X-ray imaging experiments. Laurent Barrallier and Fabrice Guittonneau are greatly acknowledged for the EBSD measurements.
References
[1] T. Duffar, Comprehensive review on grain and twin structures in bulk photovoltaic silicon, Recent Developments Crystal Growth, 5 (2010) 61-111.
[2] B. Gallien, T. Duffar, S. Lay, F. Robaut, Analysis of grain orientationin cold crucible continuous casting of photovoltaic Si, Journal of Crystal Growth, 318 (2011) 208-211.
[3] M. Trempa, C. Reimann, J. Friedrich, G. Müller, D. Oriwol, Mono-crystalline growth in directional solidification of silicon with different orientation and splitting of seed crystals, Journal of Crystal Growth, 351 (2012) 131-140.
[4] T. Duffar, A. Nadri, On the twinning occurence in bulk semiconductor crystal growth, Scripta Materialia, 62 (2010) 955-960.
[5] A. Tandjaoui, N. Mangelinck-Noel, G. Reinhart, B. Billia, T. Lafford, J. Baruchel, Investigation of grain boundary grooves at the solid–liquid interface during directional solidification of multi-crystalline silicon: in situ characterization by X-ray imaging, Journal of Crystal Growth, 377 (2013) 203-211.
[6] K.A. Jackson, Crystal Growth Kinetics, Materials Science & Engineering, 65 (1984) 7-13. [7] M.G. Tsoutsouva, T. Riberi – Béridot, G. Regula, G. Reinhart, J. Baruchel, F. Guittonneau, L. Barrallier, N. Mangelinck-Noël, In situ investigation of the structural defect generation and evolution during the directional solidification of <110> seeded growth Si, Acta Materialia, 115 (2016) 210-223.
[8] V.A. Oliveira, B. Marie, C. Cayron, M. Marinova, M.G. Tsoutsouva, H.C. Sio, T.A. Lafford, J. Baruchel, G. Audoit, A. Grenier, T.N. Tran Thi, D. Camel, Formation mechanism and properties of twinned structures in (111) seeded directionally solidified solar grade silicon, Acta Materialia, 121 (2016) 24-36.
14
[9] T. Duffar, A. Nadri, The grain–grain–liquid triple phase line during solidification of multi-crystalline silicon, Comptes Rendus Physique, 14 (2013) 185-191.
[10] A. Nadri, Y. Duterrail-Couvat, T. Duffar, Two-dimensional numerical modeling of grain structure in multi-crystalline silicon ingot, Journal of Crystal Growth, 385 (2014) 16-21. [11] T. Riberi-Béridot, N. Mangelinck-Noël, A. Tandjaoui, G. Reinhart, B. Billia, T. Lafford, J. Baruchel, L. Barrallier, On the impact of twinning on the formation of the grain structure of multi-crystalline silicon for photovoltaic applications during directional solidification, Journal of Crystal Growth, 418 (2015) 38-44.
[12] J.P. Garandet, Croissance Cristalline en phase liquide: éléments théoriques., Société Française d'Optique, 8 (2003) 23-55.
[13] W. Miller, Some remarks on the undercooling of the Si(111) facet and the “Monte Carlo modeling of silicon crystal growth” by Kirk M. Beatty & Kenneth A. Jackson, J. Crystal Growth 211 (2000) 13, Journal of Crystal Growth, 325 (2011) 101-103.
[14] K.A. Jackson, Response to: Some remarks on the undercooling of the Si(1 1 1) facet and the “Monte Carlo modeling of silicon crystal growth” by Kirk M. Beatty & Kenneth A. Jackson, J. Crystal Growth 211 (2000), 13 by W. Miller, Journal of Crystal Growth, 325 (2011) 104.
[15] H. Miyahara, S. Nara, M. Okugawa, K. Ogi, Effect of twin growth on unidirectional solidification control of multicrystal silicon for solar cells, Mater Trans, 46 (2005) 935-943. [16] M.C. Flemings, Solidification Processing, United States of America, 1974.
[17] V.V. Voronkov, Supercooling at the facet developing on a a rounded crystalization front, Soviet Physics - Crystallography, 17 (1973) 807-813.
[18] T. Abe, The growth of Si single crystals from the melt and impurity incorporation mechanisms, Journal of Crystal Growth, 24–25 (1974) 463-467.
[19] A. Tandjaoui, N. Mangelinck-Noël, G. Reinhart, B. Billia, J.J. Furter, T. Lafford, J. Baruchel, X. Guichard, Real time observation of the directional solidification of multicrystalline silicon: X-ray imaging characterization, Energy Procedia, 27 (2012) 82-87. [20] J.G. Dash, V.A. Hodgkin, J.S. Wettlaufer, Dynamics of Faceted Grain Boundary Grooves, Journal of Statistical Physics, 95 (1999) 1311-1322.
[21] T. Riberi-Béridot, M.G. Tsoutsouva, G. Regula, G. Reinhart, I. Périchaud, J. Baruchel, N. Mangelinck-Noël, Growth undercooling in multi-crystalline pure silicon and in silicon containing light impurities (C and O), Journal of Crystal Growth, 466 (2017) 64-70.
[22] S. Epure, T. Duffar, L. Braescu, Comparison between analytical and numeric determination of the interface curvature during dewetted Bridgman crystal growth, Journal of Crystal Growth, 310 (2008) 1559-1563.
[23] T. Ervik, G. Stokkan, T. Buonassisi, Ø. Mjøs, O. Lohne, Dislocation formation in seeds for quasi-monocrystalline silicon for solar cells, Acta Materialia, 67 (2014) 199-206.
Fig. 1: Theoretical growth law curves relating the facet velocity Vf to the undercooling T at
the level of a {111} facet. Bi-dimensional law from Miller [13] in solid black line, quadratic law from Voronkov [17] in dotted black line.
Fig. 2: Mean growth rate (Vg) of the solid-liquid interface for the three different samples
analysed. The FZ<100> (red point), FZ<111> (green point), and FZ<110> (blue point) samples have
respectively <100>, <111> and <110> seed crystallographic orientation parallel to the growth direction. Bars are given by the standard deviation of the growth rate distribution. Processing conditions: applied temperature gradient GAP = 37.5 K/cm, cooling rate R = 1 K/min.
Fig. 3: Sketch of a facetted/facetted grain boundary groove at the solid-liquid interface with
its characteristic parameters [20]: groove angle (), normal facet growth rate (Vf), groove
depth (h), solid-liquid interface growth rate (Vg).
Fig. 4: Image sequence showing the evolution of a typical facetted/facetted groove at the
solid-liquid interface during directional solidification of the FZ<100> Si sample. Applied
temperature gradient: GAPP = 37.5 K/cm, cooling rate R = 1 K/min at t0, a) t0 + 352 s, b) t0 +
355 s, c) t0 + 358 s, d) t0 + 361 s, e) t0 + 364 s.
Fig. 5: Mean facet normal velocity (Vf) in grain boundary grooves for FZ<100> (red points and
adjusted curve) and FZ<110> (blue points and adjusted curve) samples as a function of the
maximum undercooling. Error bars are calculated by . The black dotted curve corresponds to the Voronkow law [17] and the black solid line curve to the bi-dimensional law [13].
Fig. 6: FZ<100> Si sample: a) Crystallographic orientation of the grains along the growth
direction obtained by EBSD after sample solidification (Inverse pole figure map). b) Radiograph image at the level of the solid-liquid interface showing {111} edge facets.
Fig. 7: Mean facet normal velocity at the sample edges for FZ<100> (red points and adjusted
curve), FZ<111> (green points and adjusted curve), FZ<110> (dark blue points and adjusted
curve) samples as a function of the maximum undercooling. Error bars are calculated by . The black dotted curve corresponds to the Voronkow law [17] and the solid black line to the bi-dimensional law [13].
0.00E+00 2.00E-04 4.00E-04 6.00E-04 8.00E-04 1.00E-03 0 2 4 6 8 10
Fig. 1: Theoretical growth law curves relating the facet velocity Vf to the undercooling T at the level of a
{111} facet. Bi-dimensional law from Miller [13] in solid black line, quadratic law from Voronkov [17] in dotted black line.
T (K)
Fig. 2: Mean growth rate (Vg) of the solid-liquid interface for the three different samples analysed. The
FZ<100> (red point), FZ<111> (green point), and FZ<110> (blue point) samples have respectively <100>, <111>
and <110> seed crystallographic orientation parallel to the growth direction. Bars are given by the standard deviation of the growth rate distribution. Processing conditions: applied temperature gradient GAP = 37.5
K/cm, cooling rate R = 1 K/min.
0.0E+00 2.0E-06 4.0E-06 6.0E-06 8.0E-06 1.0E-05 1.2E-05 1.4E-05 1.6E-05 1.8E-05 2.0E-05 0 1 2 3 4 Vg ( m/ s) Samples Figure 2
Fig. 3: Sketch of a facetted/facetted grain boundary groove at the solid-liquid interface with its characteristic
parameters [20]: groove angle (), normal facet growth rate (Vf), groove depth (h), solid-liquid interface
growth rate (Vg).
Fig. 4: Image sequence showing the evolution of a typical facetted/facetted groove at the solid-liquid interface
during directional solidification of the FZ<100> Si sample. Applied temperature gradient: GAPP = 37.5 K/cm,
cooling rate R = 1 K/min at t0, a) t0 + 352 s, b) t0 + 355 s, c) t0 + 358 s, d) t0 + 361 s, e) t0 + 364 s.
0.5
mm
Solid-liquid interface
35°
35°
35°
a)
b)
c)
d)
e)
Figure 4Fig. 5: Mean facet normal velocity (Vf) in grain boundary grooves for FZ<100> (red points and adjusted curve)
and FZ<110> (blue points and adjusted curve) samples as a function of the maximum undercooling. Error bars
are calculated by . The black dotted curve corresponds to the Voronkow law [17] and the black solid line curve to the bi-dimensional law [13].
0 0.5 3 4 5 6 0 2.00E-6 4.00E-6 6.00E-6 8.00E-6 1.00E-5 1.20E-5 1.40E-5
Figure 5
Fig. 6: FZ<100> Si sample: a) Crystallographic orientation of the grains along the growth direction obtained by
EBSD after sample solidification (Inverse pole figure map). b) Radiograph image at the level of the solid-liquid interface showing {111} edge facets.
III
II
5.8 mm a) b) 500 µm 111 110 100 Figure 6Fig. 7: Mean facet normal velocity at the sample edges for FZ<100> (red points and adjusted curve), FZ<111> (green points
and adjusted curve), FZ<110> (dark blue points and adjusted curve) samples as a function of the maximum undercooling.
Error bars are calculated by . The black dotted curve corresponds to the Voronkow law [17] and the solid black line to the bi-dimensional law [13].
0 1 3 4 5 6 0 2.00E-6 4.00E-6 6.00E-6 8.00E-6 1.00E-5 1.20E-5 1.40E-5 1.60E-5 Figure 7

![Fig. 3: Sketch of a facetted/facetted grain boundary groove at the solid-liquid interface with its characteristic parameters [20]: groove angle (), normal facet growth rate (V f ), groove depth (h), solid-liquid interface growth rate (V g](https://thumb-eu.123doks.com/thumbv2/123doknet/14638292.735013/19.892.179.696.191.465/sketch-facetted-facetted-boundary-interface-characteristic-parameters-interface.webp)