HAL Id: tel-03191622
https://tel.archives-ouvertes.fr/tel-03191622
Submitted on 7 Apr 2021HAL is a multi-disciplinary open access
archive for the deposit and dissemination of sci-entific research documents, whether they are pub-lished or not. The documents may come from teaching and research institutions in France or abroad, or from public or private research centers.
L’archive ouverte pluridisciplinaire HAL, est destinée au dépôt et à la diffusion de documents scientifiques de niveau recherche, publiés ou non, émanant des établissements d’enseignement et de recherche français ou étrangers, des laboratoires publics ou privés.
Florian Berton
To cite this version:
Florian Berton. Immersive virtual crowds : evaluation of pedestrian behaviours in virtual reality. Graphics [cs.GR]. Université Rennes 1, 2020. English. �NNT : 2020REN1S056�. �tel-03191622�
T
HESE DE DOCTORAT DE
L'UNIVERSITE
DE
RENNES
1
ECOLE DOCTORALE N°601
Mathématiques et Sciences et Technologies de l'Information et de la Communication Spécialité : Informatique
Immersive Virtual Crowds: Evaluation of Pedestrian Behaviours in
Virtual Reality
Thèse présentée et soutenue à Irisa, le 14/12/2020 Unité de recherche : Inria
Thèse N° : (8)
Par
Florian Berton
Rapporteurs avant soutenance :
PELECHANO Nuria Professeure associée Université Polytechnique de Catalogne (UPC) BOULIC Ronan Chercheur Senior à l’Ecole Polytechnique Fédérale de Lausanne (EPFL)
Composition du Jury :
Président : MARCHAND Eric Professeur à l’Université Rennes 1 Examinateurs : O’SULLIVAN Carol Professeur au Trinity College Dublin
WARREN William Professeur à l’Université Brown
PELECHANO Nuria Professeur associée Université Polytechnique de Catalogne (UPC)
BOULIC Ronan Chercheur Senior à l’Ecole Polytechnique Fédérale de Lausanne (EPFL)
Dir. de thèse : PETTRE Julien Directeur de recherche à l’INRIA Rennes Co-encadrants de thèse : OLIVIER Anne-Hélène Maître de conférence de l’Université Rennes 2
iii
Contents
Contents iii 1 Introduction 1 1.1 Context . . . 1 1.2 Our Approach . . . 3 1.3 Contributions . . . 4 1.4 Overview. . . 62 State of the art 7 2.1 Crowd Simulation . . . 8
2.1.1 Approaches . . . 9
2.1.2 Local Interaction Models . . . 11
2.2 Pedestrian Interactions in Real Environment . . . 15
2.2.1 Trajectory Analysis . . . 15
2.2.2 Vision and Locomotion . . . 21
2.3 Virtual Reality . . . 29
2.3.1 Technology . . . 29
2.3.2 Evaluation of Virtual Reality . . . 31
2.3.3 Experiment . . . 34 2.4 Conclusion . . . 40 3 Experimental Tools 43 3.1 CrowdMP . . . 44 3.1.1 Experimental Procedures . . . 45 3.1.2 CrowdMP Architecture . . . 46
3.1.3 Virtual Reality Displays . . . 49
3.2 Tobii Tools . . . 50
3.2.1 TobiiController . . . 50
4 Influence of Virtual Reality Setup on Gaze Activity during Col-lision Avoidance 55 4.1 Methods . . . 57 4.1.1 Participants . . . 58 4.1.2 Task . . . 58 4.1.3 Environment . . . 58 4.1.4 Experimental Design . . . 59 4.2 Analysis . . . 61 4.2.1 Collected Data . . . 61 4.2.2 Time Variables . . . 62
4.2.3 Collision Avoidance Trials . . . 62
4.2.4 Kinematics of the Collision Avoidance Task. . . 63
4.2.5 Gaze Behaviour . . . 64 4.2.6 Statistics. . . 65 4.3 Results . . . 66 4.3.1 Locomotion . . . 66 4.3.2 Gaze Behaviour . . . 67 4.4 Discussion . . . 70
4.4.1 Collision Avoidance Behaviour . . . 70
4.4.2 Fixations and Gaze Allocation . . . 71
4.4.3 Gaze and Head Angles . . . 72
4.4.4 Limitations . . . 73
4.5 Conclusion . . . 74
5 Navigation in Crowds: Influence of Virtual Reality and Crowd Density 77 5.1 Introduction . . . 78
5.2 Overview. . . 79
5.2.1 Apparatus & Task . . . 79
5.2.2 Participants . . . 80
5.2.3 Analysis . . . 81
5.3 Real vs. Virtual Validation . . . 84
5.3.1 Procedure . . . 85
5.3.2 Analysis & Results . . . 86
5.3.3 Discussion . . . 89
5.4 Effect of Crowd Density on Eye-gaze Behaviour . . . 90
5.4.1 Procedure . . . 90
v 5.4.3 Discussion . . . 93 5.5 General Discussion . . . 94 5.5.1 Crowd Simulation . . . 94 5.5.2 Limitations . . . 94 5.6 Conclusion . . . 96
6 Impact of Haptic Rendering of Collisions During Navigation through a Virtual Crowd 97 6.1 Virtual Realty and Collision Rendering . . . 99
6.2 Experimental Overview . . . 101
6.2.1 Materials & Methods . . . 101
6.2.2 Environment & Task . . . 104
6.2.3 Protocol . . . 105 6.2.4 Participants . . . 106 6.2.5 Hypotheses . . . 106 6.3 Analysis . . . 107 6.3.1 Collected Data . . . 107 6.3.2 Trajectories . . . 107 6.3.3 Body Motions . . . 108 6.3.4 Collisions . . . 110
6.3.5 Presence and Embodiment . . . 110
6.3.6 Statistical Analyses . . . 113
6.4 Results . . . 113
6.4.1 Trajectory Analysis . . . 113
6.4.2 Body Motion . . . 114
6.4.3 Collisions . . . 115
6.4.4 Presence and Embodiment . . . 117
6.5 Discussion . . . 119
6.5.1 Trajectories . . . 119
6.5.2 Avoidance Behaviour . . . 119
6.5.3 Haptic Rendering After-effects . . . 120
6.5.4 Embodiment & Presence . . . 121
6.5.5 Limitations . . . 121
6.6 Conclusion . . . 122
7 Conclusion and Perspectives 125 7.1 Virtual Reality as a Relevant Tool to Study Human Behaviour . . 126
7.1.2 Recommendations to Design Virtual Experiments . . . 128
7.2 Future Works . . . 131
7.2.1 Short Term Perspectives . . . 131
7.2.2 Long Term Perspectives . . . 132
Acronyms 137
List of Figures 139
List of Tables 147
1 Chapter
1
Introduction
Contents
1.1 Context . . . . 1 1.2 Our Approach . . . . 3 1.3 Contributions . . . . 4 1.4 Overview . . . . 61.1
Context
During this thesis, we were interested in acquiring new insights about collective behaviour in the case of a moving crowd. To this end, we have worked on the design and the evaluation of an experimental platform in virtual reality to study pedestrians’ behaviour, which is at the core of collective behaviour. Our research applies to the field of crowd simulation, which aims at computing the movement of a crowd of individuals to reproduce their real behaviour. Such simulations are of interest for several fields of applications, such as entertainment (Figure 1.1-Left) or crowd management (Figure 1.1-Right), each of them having their own performance standards. Indeed, agents in a virtual crowd in a video game may be required to interact with the player. It is therefore necessary to design a simulation that enables real-time interactivity, thus inducing high performance in computation time. This is not the case for cinema, where one may be asked to simulate a
crowd of several thousand agents with highly visually realistic movements and the possibility to edit all these animations. Performance is also of course implies in such cases as it directly affects the budget, but visual quality remains the prime element. In the case of evacuation scenario in the frame of event planning, or architecture, it is important to generate realistic predictive simulations that can be adapted to any situation, which requires evaluating all possible effects of the parameters on the crowd simulator model. This category of model is used to choose the best locations for exits or to evaluate various safety criteria such as the evacuation time or the minimal physical distancing maintained between people in the context of Covid (Figure 1.1-Right).
Figure 1.1 – Left: battle scene from the Game of Thrones series using Goalem Software’s crowd simulator, Right: MassMotion crowd simulator developed by Oasys and used to test the ability of the Arup Liverpool office to comply with physical distancing measures during Covid.
To satisfy the requirements of these applications and comply with these per-formance standards, several simulation methods have been developed. They can be divided into three main categories:
1. Flow-based methods aim at simulating very large crowds of people by con-sidering the crowd as a whole.
2. Data-driven methods aim at mimicking crowd movements from real data. 3. Agent-based methods simulate the behaviour of each virtual agent within
the crowd. Global crowd motion then emerges from the combination of local interactions.
In this thesis, we aim at improving agent-based methods by providing new methods to analyse pedestrians’ behaviour at the local scale. Local interactions when walking within a crowd are diverse and include following tasks, walking in a group, reaching someone as well as avoiding a collision. Our work specifically focused on the collision avoidance task during goal directed locomotion, where an
1.2 Our Approach 3
individual is moving towards a goal while avoiding any collision with other pedes-trians. Several models of such an interaction have been proposed in the literature and are based on Physics principles (e.g., repulsive forces influenced by the inter-personal distance between walkers) or considered relative speeds of walkers. The complexity in such modeling is to understand which agent within a crowd influ-ences the motion of the walker. This is named “interaction neighbourhood”. It goes without saying that when we walk in the street, our movements and actions do not take into account all the people in the street but a subset around us. The definition of such an interaction neighbourhood has received little attention in the literature and is a challenging task. Indeed, understanding and modelling this neighbourhood is equivalent to inverting the injective process by which multiple sources of interactions combine to influence a single trajectory of lower dimension. However, we believe that the improvement of current agent-based crowd simula-tion models relies on a better definisimula-tion of this neighbourhood. It requires then a deep analysis of how a human behaves at the local scale when navigating in populated environments.
1.2
Our Approach
This thesis aims to improve current crowd simulation models by understanding how pedestrian motion is controlled. In that context, our approach relies on the ecological theory of visual perception developed by Gibson [1958]. According to Gibson, “We must perceive in order to move, but we must also move in order to
perceive”. Gibson considers the system agent-environment, where interactions can
be described as a perception-action loop, illustrated Figure 1.2. In this approach, perception is considered as direct, meaning that the agent has an immediate per-ception of high level variables, directly available in the sensory flow. The agent, therefore, perceives the environment through their perceptual systems (vision, touch, hearing ...) and control their action accordingly which will in turn mod-ify the perceived environment. This approach has been used as the theoretical basis for other researchers, such as Warren [1998, 2006] who introduces in this perception-action loop the notion of behaviour law to describe the interactions between the environment and the agent.
Following this theory, we believe that in order to understand pedestrians in-teractions in a complex environment, including their interaction neighbourhood, we have to consider both motion, i.e., the pedestrian kinematics, and perception. In particular, we would like to analyse pedestrians’ gaze activity, since it has been shown that vision is the main perceptual system used during locomotion to
Figure 1.2 – The Perception and Action loop proposed by Gibson [1958].
take information about the physical characteristics of the environment but also about the (relative) position and motion of the observer and the elements of the environment [Warren, 1998, Patla,1997].
To this end, we designed our experiments in Virtual Reality (VR), as it pro-vides strong control over the experimental conditions which is very challenging in a real environment full of people. Interestingly, it enables to reproduce the exact same visual stimuli for several trials of the same participant and across par-ticipants, which is an essential element for experimental studies. This control is crucial in our approach, as a difference in the visual stimulus can have a significant impact on gaze activity. Furthermore, VR also provides direct access to the envi-ronment perceived by the participant, so that we know exactly what they looked at based on their gaze’s coordinates and without making additional computa-tions. However, since previous works have shown that modification of perception and action can occur in VR, it is necessary to evaluate the effect of VR on gaze activity for the study of interaction between pedestrians. Indeed, differences in human behaviour between a real and virtual environment must be identified in order to be able to transfer results observed in virtual reality to situations in real environments.
1.3
Contributions
This thesis proposed three main contributions based on three experimental studies that rely on the development of two technical platforms presented in Chapter 3.
1.3 Contributions 5
In our first contribution, we focused our research on the impact of virtual reality on gaze activity in a pairwise collision avoidance task. For this purpose, we carried out an experiment in a real and a virtual environment with four different kinds of VR setup. During this experiment, participants had to walk toward a target while avoiding another pedestrian. We chose this situation as it represents one of the majority interactions when walking in a crowd. Our results showed that gaze activity was qualitatively similar for all conditions with some quantitative differences. In particular, there were more head rotations in VR and a larger amplitude for gaze angle. In conclusion, VR seems to be adequate as a tool to study gaze activity during a pedestrian interaction. This work was presented at IEEE VR 2019 conference [Berton et al.,2019].
We extended this contribution in a second experiment where we were interested in the analysis of gaze activity during navigation in a crowded street. However, as this situation is more complex than a single pedestrian interaction, we first validated that our previous results were similar for this situation, by comparing real and virtual crowded situations. We then investigated the impact of crowd density on gaze activity in order to gain new insights on the neighbourhood of in-teraction. Our results suggest that as the crowd density increases, the exploration of the environment by the eyes becomes narrower without changing its frequency and that the gaze is concentrated on the pedestrians in front of the participants. Such results may indicate, for instance, to consider a constant number of pedes-trians in the “interaction neighbourhood” regardless of the density of the crowd. This work was presented at IEEE VR 2020 conference [Berton et al., 2020].
However, when walking in a dense crowd, it is usual to collide with other pedestrians, which can be challenging to reproduce in VR. In a third contribu-tion, we have investigated the effect of simulating such physical contacts on human behaviour in VR. To this end, we conducted an experiment where participants had to navigate through a dense virtual crowd with or without haptic rendering of collisions. Our results show that haptic rendering of collisions does not al-ter the trajectories taken by the participants, which is consistent with previous studies [Warren, 1998, Patla, 1997] indicating that vision is the main perceptual system used when walking. However, the introduction of haptic rendering of col-lision altered participants’ local movements with an increased shoulder rotation as well as a decreased walking speed in order to move through the dense crowd. These results suggest continuing to use haptic rendering when performing VR ex-periments in dense crowds. This work has been submitted to the journal TVGC and is currently under minor revisions.
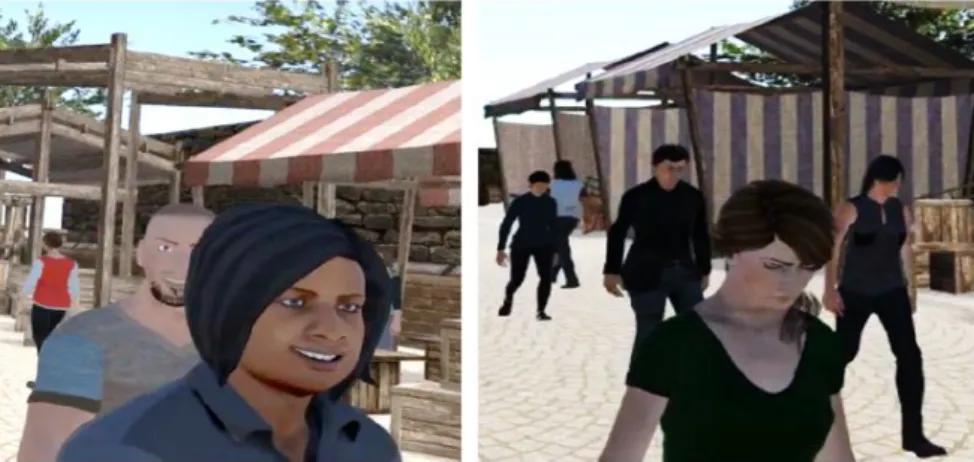
related to crowd simulation and the study of human behaviour when interacting with virtual pedestrians. A study [Duverne et al., 2020] was performed to under-stand the influence of the social environment on human behaviour. In particular, we explored the effect of the transgression of personal space at a train station and in a sports fan zone, which was conducted in a real and virtual environment. In this work, I was involved in the analysis of VR data and the writing of the exper-imental design. Our results suggest that proxemics norms vary according to the subjective relationship of the individual to the social settings in real environments. However, while we were able to show that social norms still exist in VR, our re-sults did not show a main effect of the social settings on participants’ sensitivity to the transgression of proxemics norms. Another collaboration [van Toll et al.,
2020] focused on crowd simulation where we proposed a method to reproduce several agent-based models using a cost function optimization. My contribution to this collaboration was mainly on the representation of the results. Finally, I actively participated in the development of a software (Chaos1) to visualize crowd
movements based on numerical trajectories. This software also enables to record several kinds of data that can be used as a database for deep learning algorithms.
1.4
Overview
This thesis is structured as follows: Chapter 2 presents the state of the art in the different fields related to this thesis. In particular, it focuses on the presentation of different approaches to crowd simulation, as well as studies on trajectories and gaze activity during interactions between pedestrians in real and virtual environ-ments. Chapter 3 describes the different platforms created and used to design our experiments. Chapter 4 introduces a first study on the impact of virtual reality on gaze activity during a collision avoidance task between two pedestrians. Chap-ter 5 presents a second study on the impact of virtual reality on gaze activity, in a more complex scenario, when navigating in a crowd. This study also explores the effect of crowd density. Chapter 6 investigates haptic rendering of collision when navigating in a virtual dense crowd. Finally, Chapter 7 presents a general conclusion of these contributions and future perspectives.
1
7
Chapter
2
State of the Art
Contents
2.1 Crowd Simulation . . . . 8
2.1.1 Approaches . . . 9
2.1.2 Local Interaction Models . . . 11
2.2 Pedestrian Interactions in Real Environment. . . . . 15
2.2.1 Trajectory Analysis . . . 15
2.2.2 Vision and Locomotion . . . 21
2.3 Virtual Reality . . . . 29
2.3.1 Technology . . . 29
2.3.2 Evaluation of Virtual Reality . . . 31
2.3.3 Experiment . . . 34
2.4 Conclusion . . . . 40
In this thesis we are interested in the analysis of human behaviour when navi-gating in a virtual crowd, in order to subsequently improve crowd simulators. This thesis is thus at the intersection of three main domains which are: crowd simu-lation, human behaviour studies, and virtual reality, as shown in the Figure 2.1. This chapter first introduces crowd simulation, detailing the different approaches and models. Then, it presents the different studies on human behaviour when
interacting with pedestrians in a real environment. This presentation focuses es-pecially on studies on trajectory analysis and studies on vision and walking, as these are the main research topics of this thesis. Finally, as virtual reality (VR) is a major tool in this thesis, the last section presents some of the biases induced by VR and studies on human behaviour.
Figure 2.1 – This thesis, on the analysis of human behaviour when navigating in a crowd, is at the intersection of three main domains: Crowd Simulation, Human behaviour Analysis and Virtual Reality
2.1
Crowd Simulation
This section introduces crowd simulation, and to do so it is first necessary to define the concept of a “crowd”. There is no exact definition, however, many works [Duives et al.,2013, Challenger et al., 2009,Hoogendoorn and Bovy, 2004,
Wijermans, 2011] define a crowd as several pedestrians moving in the same place and at the same time. Furthermore, the number of pedestrians to define a crowd is quite variable, ranging from more than 2 [Challenger et al., 2009] to more than 100 [Duives et al., 2013]. Then a second important aspect about crowds is the
“collective behaviour”. This notion is introduced by Sumter et al. [2012] and is
2.1 Crowd Simulation 9
of the individuals. Therefore, we can define crowd simulation as the creation of mathematical models to simulate collective behaviour in a virtual crowd. This topic has been of interest for several years, and over these years a wide variety of algorithms has been implemented. In Section 2.1.1, we present the main ap-proaches that constitute the crowd simulation field, then we detail some models that focus on the simulation of interactions between pedestrians in Section 2.1.2.
2.1.1
Approaches
It is possible to divide the field of crowd simulation into three main approaches named: Flow-based, Data-driven and Agent-based, which are illustrated in Figure 2.2 and are each based on different principles.
Figure 2.2 – Illustration of the three main approaches for crowd simulation Flow-based [Treuille et al., 2006] (left), Data-driven [Lee et al., 2007] (middle) and Agent-based [Dutra et al.,2017] (right)
2.1.1.1 Flow-based
In this approach, also called the macroscopic approach, the crowd is considered as a whole or as a “Continuum” [Hughes,2002,2003]. A “Continuum” is, according to Gan and Yong [2012], “A body whose matter is continuously distributed and
fills the entire region of space it occupies”, with in our case the crowd as the body
and pedestrians as the matter. These pedestrians are then set in motion while respecting some basic principles such as the preservation of matter and other con-straints from various disciplines. For instance, some works [Shimizu et al., 2003,
Pimenta et al., 2008, Kerr and Spears, 2005] consider the whole crowd as a con-tinuous fluid, where the movement of the fluid particles (the pedestrians) is driven by the dynamics of fluids. Some other algorithms [Jin et al.,2008,Chenney,2004,
the crowd without collisions with obstacles present in the environment. These ve-locity fields are either created manually, extracted from video or mathematically computed. These kinds of approaches are very interesting to simulate very dense crowds because of their complexity and the associated computation costs depend on the discretisation of the space chosen. However, they also lead to the creation of some artefacts such as the interpenetration between the visual representation of the crowd agents. A further disadvantage is that it is also not possible to indi-vidualise the behaviour of agents. To remedy this, Narain et al. [2009] proposed a hybrid approach in order to avoid constraining agents to follow a uniform model at all times. In regions with high crowd density, his algorithm use principles from fluids dynamics with agents represented as incompressible granular materials. For areas with lower density, agent velocity is obtained by interpolating velocity from a fluid dynamics model and the preferred agent velocity in order to reach their objective.
2.1.1.2 Data-driven
For this approach, crowd simulation is performed using collected data. For in-stance, some works [Lee et al.,2007,Lerner et al.,2007] simulate the agent move-ments by looking for the closest real situation in order to replicate the same actions. In the case of Lerner et al. [2007], this search is based on the position and speed of the agents at a given time. Lee et al. [2007], on the other hand, code the state of an agent according to several variables (speed, formation of neigh-bours, ...) and use a statistical model (PCA) to predict the next action from the database of examples they have. Another method [Yersin et al., 2009] creates patches of crowd movements from real data and assembles them together. Char-alambous et al. [2014] also proposed a perception-action graph to simulate agent’s action. Each edge of this graph represents an agent personal state obtained from trajectories and each node is the action that transforms one state to another. Fi-nally, new methods start to use machine and deep learning algorithms to model the crowd, predict and generate future movements of the agents in that crowd [Amirian et al., 2019,Zhong et al., 2016,Pellegrini et al., 2012,Zhao et al., 2019,
Gupta et al., 2018,Alahi et al.,2016].
These methods therefore provide a relatively realistic simulation of crowd movements with a computation cost that differs according to the method cho-sen. However, a limitation is that they are dependent on the database provided as input.
2.1 Crowd Simulation 11
2.1.1.3 Agent-based
This approach is also known as microscopic approach. Each agent in the crowd is considered as an intelligent one with certain properties and a goal to reach. In most cases, a path planner gives the direction and the path to the goal that he has to reach [Van Toll et al.,2016,Bruneau and Pettré,2017]. Furthermore, each agent uses a model to simulate the local interactions he has with the other pedestrians that are near him (interaction neighbourhood) and to avoid the obstacles present in the environment (trees, walls...). These local interactions with pedestrians can be numerous, the most recurrent being the avoidance of collision, but there are others such as following a person or walking in a group. In order to simulate them a lot of algorithms have been designed such as physics-based [Helbing and Molnár, 1995, Karamouzas et al., 2014, Reynolds, 1999], velocity-based [Paris et al.,2007,van den Berg et al.,2011,Moussaïd et al.,2011a,Pettré et al.,2009], vision-based [Dutra et al.,2017,López et al.,2019] or rule-based [Moussaïd et al.,
2011b] models.
In this thesis we are particularly interested in this kind of approach, even if compared to other approaches, they are more expensive in terms of computation time. One of their major benefits is that they enable the simulation of hetero-geneous crowds, which are more realistic in terms of local pedestrian behaviour. Indeed, pedestrians in a crowd do not have a uniform behaviour, for instance they do not walk at the same speed, some of them pay attention to their environment while others do not. Therefore, the agent-based approach provides a way to easily model such diversity by varying the parameters of the local interaction model and the interaction neighbourhood associated to each agent. The next section details the different existing algorithms in order to better understand the principles and thus be able to improve them.
2.1.2
Local Interaction Models
This section presents in detail several models of agent-based crowd simulators, by describing the computation of the local interactions as well as the interaction neighbourhood.
2.1.2.1 Physics-based Models
Physics-based models use the laws of physics to set crowd agents in motion. In physics-based models, an attractive force is used between each agent and the goal they have to reach in order to put them in motion. Furthermore, interactions
between each agent are represented by repulsive forces for them to avoid colli-sions. Finally, the direction vector of an agent corresponds to the sum of all the forces that are applied to it, as illustrated in Figure 2.3. The first model to ex-ploit such representation, named “Social Forces”, was introduced by Helbing et
al. [1995]. In this model the intensity of the repulsive forces is correlated to the
distance between the agents, so beyond a certain distance, these forces will be in-significant. Therefore, without any other process, the interaction neighbourhood corresponds to all agents at a certain distance. This model has been improved several times since, in particular by Karamouzas et al. [2014], who tied the inten-sity of the repulsive force to the time-to-collision between agents. This modelling directly changes the interaction neighbourhood (see Figure), with the selection of agents now being based not on distance but on the risk of collision, as illustrated Figure 2.3.
Figure 2.3 – Illustration of physics-based model (Left [Helbing and Molnár, 1995] and Right [Karamouzas et al.,2014]) on a agent (red-circle), with the repulsive forces from the other agents (green arrows), the attractive force (red arrow) toward the goal and the final velocity vector (black arrow).
2.1.2.2 Velocity-based Models
The general principle of velocity-based models comes from the work of Fiorini and Shiller [1998] who introduced the concept of Velocity Obstacles. The purpose of this algorithm is to compute for an agent A, the set of all velocities V OA
B for which
a collision with agent B (or an obstacle) will occur, as shown in Figure 2.4-left. Then, the velocity of agent A is modified in order to not be part of V OA
B while
being as close as possible to the velocity vector towards the agent’s goal. One of the most known algorithms in crowd simulation is called Reciprocal Velocity Obstacles (RVO) and is based on this principle. In RVO, Van Den Berg et al. [2008] modify the choice of the agent’s velocity by using the average between the agent’s current velocity and the desired velocity to avoid any collision. This difference avoids
2.1 Crowd Simulation 13
a phenomenon of oscillation by the agents. RVO has been implemented and improved in the literature multiples times [van den Berg et al., 2011, Yeh et al.,
2008, Golas et al., 2013, Godoy et al.,2014].
Figure 2.4 – Illustration of the set of velocities V OBAthat cause a future collision for an agent A with an agent B (left), and extension to a case with multiple interactions (right)
Concerning multiple interactions (Figure 2.4-right), the set of velocities to avoid is represented by the union of V OA
Bi where i is the number of agents in the
interaction neighbourhood. In the case of RVO, this interaction neighbourhood is defined by a region around the agent, however we can find other methods for the selection of neighbours. In particular, Bruneau and Pettre [2017] proposed to use an area represented by a large semi-circle in front of the agent and a smaller semi-circle behind him, since a pedestrian perceives mainly the environment in front of him. Paris et al. [2007], for their part, use the field of vision of the agents as an interaction neighbourhood, furthermore, they do not consider agents hidden by an obstacle. Finally, Pettre et al. [2009] consider only the agents with which interaction occurs, and they restrict the interaction neighbourhood to a maximum of 7 neighbours.
2.1.2.3 Vision-based Models
Vision-based algorithms use the field of view of each agent to extract information in the environment, process them in order to move them toward their goal without collision. In an obstacle-free environment, Warren et al. [2001] proposed a visual control law using the egocentric direction towards the objective to be reached and the rotation towards it weighted by the optical flow. This work was then extended by proposing a new visual control law [Warren and Fajen,2008] using this time the bearing angle in order to navigate an agent toward his goal and avoiding the other obstacles present in the environment. Then some models proposed to compute the agent’s motion by processing the image of the environment. For instance, Dutra et
al.[2017] computed two images representing the future time and distance at which
the agent will be closest to other elements. Lopez et al. [2019] use the optical flow of the agent to create characteristics on each agent. These different pieces of information related to the risk of collision are then used in a cost function in addition to the agent’s speed and goal. Then, this function calculates the speed of the agent to minimize the risk of collisions with all obstacles while maximizing the direction towards the agent’s objective. This logic, illustrated in Figure 2.5, is very similar to the action-perception loop presented in Section 1.2. Furthermore, for these two last methods, the interaction neighbourhood is computed indirectly, since only pedestrians present in the agent’s field of view are taken into account.
Figure 2.5 – Illustration of the main loop used in Lopez et al. [2019] to update and move an agent.
In conclusion, the modelling of collision avoidance has been extensively studied for agent-based models, which is less the case regarding the interaction neighbour-hood. Several definitions have been proposed either arbitrarily or based on basic concepts such as field of view. In this thesis, we are interested in experimental studies for understanding multiple interactions, and more especially the neigh-bourhood of interaction. The purpose of conducting experiments in specific situ-ations is to understand the human behaviour in order to be able to later simulate it. Indeed, several works have already adopted this strategy in order to propose or improve agent-based model. For instance, in the case of simulation of follow-ing behaviour, Rio et al. [2014] proposed a visual control law from the results of two experiments where participants had to follow another pedestrian. Then they conducted more experiments [Dachner and Warren, 2014, Rio and Warren,
2014, Rio et al.,2018] in order to study multiple interactions. From their results, they improved their model on following behaviour and proposed a new definition
2.2 Pedestrian Interactions in Real Environment 15
for the neighbourhood of interaction for such situations. The next section thus presents the various works carried out on the analysis of pedestrian interactions in a real environment.
2.2
Pedestrian Interactions in Real
Environ-ment
Navigating within a crowd involves many interactions between pedestrians such as following, walking together, as well as collision avoidance. In this thesis, we are particularly interested in collision avoidance behaviour, which is essential for safe navigation. Collision avoidance behaviour is strongly linked to the notion of proxemics. Proxemics is the study of people’s perception and use of space [Hall,
1963]. The exploration of this field of study emerged in the 1960’s as an in-terdisciplinary approach to understanding complex human behaviour in crowds. Proximity was shown to be influenced by cultural aspects [Hall, 1963], as well as by gender [Brady and Walker, 1978], age [Remland et al., 1995], attractiveness [Kmiecik et al.,1979] or speed of movement and density [Seyfried et al., 2005b].
In his work, Hall introduces several inter-personal distances in humans repre-senting the spaces around them. Four spaces, namely intimate, personal, social, and public spaces have been described according to the nature of social interac-tions that occur within these spaces (Figure 2.6) [Hall, 1966]. In that context, the collision avoidance task, which requires the pedestrian to identify if and when a collision will occur [Cutting et al., 1995], not only aims at avoiding physical contact but also at preserving social distances. In particular, the term personal space (PS) is used to describe the minimum social distance from other pedestrians when walking [Gérin-Lajoie et al., 2005].
In this section, we review research works that focused on 1-to-1 and 1-to-N pedestrian interactions, especially during a collision avoidance task. We first con-sidered studies that analysed pedestrian trajectories to understand the pedestrian movements during the interaction.
2.2.1
Trajectory Analysis
Research on human interactions and navigation can be divided into two major categories. The first one, referred as “pairwise experiment”, concerns controlled laboratory experiments during which one participant is going to walk towards a goal while encountering another pedestrian. The second concerns studies
involv-Figure 2.6 – Proxemics distance
ing multiple human interactions, whether with a group of individuals or even a crowd. In order to record pedestrian trajectories when interacting with each other, several tools are at the disposal of scientists. When an experiment is performed in a laboratory with a small number of participants, researchers most often use op-toelectronic systems to record human motion as illustrated in Figure 2.7-left. By using 3D markers fixed on the participants and tracking cameras (e.g., Qualisys1,
Vicon2), it is possible to record their trajectories. However, this kind of equipment
cannot be used for outdoor use or with a large number of people. Therefore, some works rely solely on video recording such as the experiments described by Boltes and Seyfried [2013] and illustrated Figure 2.7-right. In this kind of work partic-ipant’s trajectories can either be annotated by hand or detected using tracking algorithms.
2.2.1.1 Pairwise Experiment
Pairwise experiments were performed in controlled laboratory settings. Typically, experimenters ask two walkers (either two participants, or one participant and one confederate), to walk through the experimental area to reach a target straight ahead. During this task, one walker encounters the other arriving from a certain angle, also known as the crossing angle, and must avoid any collision with him. However, no other indication is given to participants. Therefore, it is for them to
1
https://www.qualisys.com
2
2.2 Pedestrian Interactions in Real Environment 17
Figure 2.7 – Illustration of two systems to record trajectories during experiments about interactions between pedestrians. Motion capture system (e.g, Vicon) are used in the left image from Olivier et al. ’s experiment [2012], whereas videos and annotations are used in the right image from Boltes and Seyfried [2013] works .
judge whether a collision is actually going to occur, and to decide which movement they have to perform in order to avoid it.
In each experiment, the researchers focus on only one or two factors in or-der to unor-derstand their influence on the participant’s locomotion. To this end, the creation of the experience is standardized so that the participant’s behaviour should only be influenced by these factors. In their works, Olivier et al. [2012,
2013] designed an experiment where one participant encountered a confederate crossing at a 90◦ angle. The initial positions of the two walkers have been
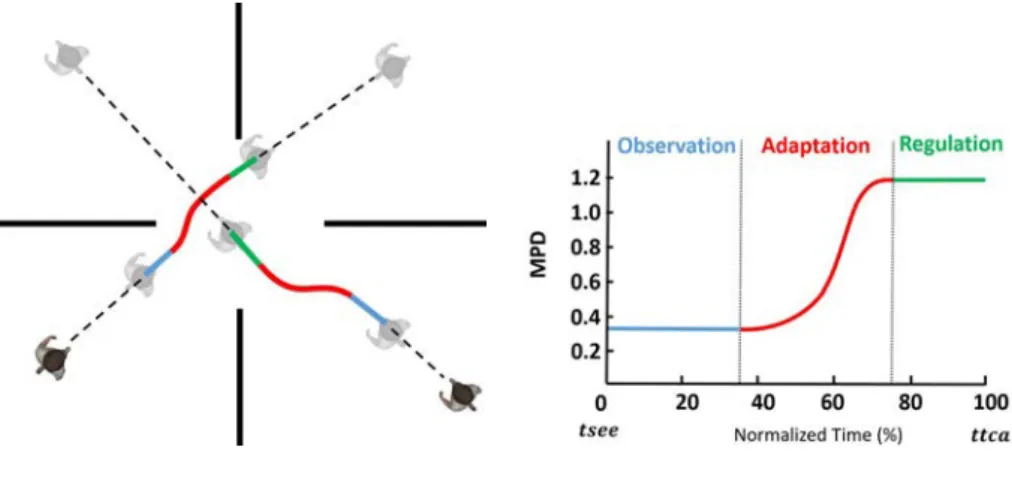
ma-nipulated to ensure that they passed at a minimum distance d from each other if they walked without any change in their locomotion. During the experiment, the authors varied d between 0 and 2 meters in order to see the impact on the participant’s locomotion. Furthermore, they set up walls between the two people, as illustrated in Figure 2.8, so they could not see each other at the beginning of the experiment but only after a certain time (tsee), in order to ensure that they had the time to reach comfort speed.
In order to analyse collision avoidance behaviour, Olivier et al. [2012] intro-duced a variable called minimum predicted distance (mpd). This variable, com-puted at a time (t), corresponds to the future crossing distance between two walkers if they keep walking at their current speed. The evolution of this minimal predicted distance, which is associated to the time to closest approach (ttca), is displayed in Figure 2.8. This metric relates to mutual motion adaptation since any change in one or both participants’ trajectory will induce variations of mpd.
It has first been shown that walkers adapt their motion only if required. In-deed, motion adaptations were only observed when the initial mpd was less than 1m. When considering situations where the initial future crossing distance is
Figure 2.8 – Setup used during Olivier et al. ’s experiment [2012]. The participant (red) and the confederate (blue) start to see each other at time tsee. During the experiment the minimum distance between them (mpd) takes place at the time ttca.
less than 1m, the evolution of mpd during the interaction can be described into 3 phases, that were associated with 3 steps in motion adaptations, illustrated in Figure 2.9. First, mpd(t) remains constant (“observation phase”): since no motion adaptation is performed. Second, mpd(t) is increased so as to reach a comfortable crossing distance (“reaction phase”). Third, mpd(t) remains constant at a com-fortable distance until the actual crossing (“regulation phase”) and shows that the collision avoidance task is solved before walkers cross each other.
Figure 2.9 – Collision avoidance between two pedestrians can be described as a 3 step process (Observation (blue), reaction (red) and regulation (green)) when considering the evolution of the minimum predicted distance (mpd), which is the future distance of closest approach.
2.2 Pedestrian Interactions in Real Environment 19
involved in the interaction [Olivier et al.,2013] the contribution of each walker dif-fers depending on their order at the crossing: the walker passing first contributes less than the second. This result was discussed with respect to the asymmetry of the personal space (PS). In addition, Huber et al. ’s research[2014] focuses on the influence of the crossing angle on collision avoidance strategies. By study-ing several situations, they showed that collision avoidance requires a change in trajectory and speed. Moreover, the velocity adjustment was more important in the case of acute angles (i.e. 45◦ and 90◦), which is consistent with previous
work[Basili et al.,2013].
Some studies have also investigated the influence of individual characteristics such as height, gender, or age on locomotion during collision avoidance [Grundberg et al., Rapos et al., 2019, Knorr et al., 2016, Bourgaize et al., 2020]. Overall, participants showed similar avoidance strategies whatever their specific individual characteristics. However, some quantitative differences could be noticed with more risky behaviour in older adults [Grundberg et al.], or larger crossing distance with larger pedestrians [Bourgaize et al., 2020].
2.2.1.2 Multiple Interactions
If we consider multiple interaction situations, we can first present studies that explored collision avoidance between a participant and two other walkers [Dicks et al., 2016, Meerhoff et al., 2018b]. Dicks et al. [2016] designed an experiment where a participant was interacting with one or two pedestrians on a head-on collision course, who could be reading a message on their mobile phone or not during a street crossing task. Their results showed that participants took more time to complete the crossing when they encountered two pedestrians. Further-more, the participant’s speed was lower when these pedestrians were looking at their phones. Meerhoff et al. [2018b], on the other hand, showed that tryadic interactions in a 90◦ collision avoidance task can result in both sequential or
si-multaneous interactions, but they mentioned that additional work is required to identify the conditions which invite for such interactions.
Also as part of a laboratory experiment but with a much larger number of participants, Seyfried et al. [2005a] were interested in the impact of crowd den-sity on the walking speed. They conducted an experiment, illustrated in Fig-ure 2.10-left, where N participants (N ∈ [1, 34]) had to walk in a circular corridor with different widths. Their results show a negative linear relationship between the participant’s velocity and the density of people (Figure 2.10-right). However Chattaraj et al. [2009] showed that this can be dependent on cultural differences.
In a similar context, Gorrini et al. conducted several controlled experiments on crowds walking in corridors. The first [Gorrini et al.,2013] focused on the impact of corridor curvature on walking speed with a crowd consisting of either individu-als or groups. They found that groups walk slower than individuindividu-als and that the curvature of the corridor has an impact on the movement of the crowd. A sharp curve reduces the walking speed and thus the flow rate of the crowd. The second experiment [Gorrini et al.,2016] concerned the influence of crowd flow on pedestri-ans’ walking speed. By changing the type of flow (unidirectional or counter-flow) and the flow’s density, they showed that increasing the flow reduces walking speed. Moreover, in the case of a counter-flow condition, this effect was greater for groups than for single individuals, as this situation presents more turbulent trajectories.
Figure 2.10 – Left: laboratory setup used during Seyfried et al. ’s experiment[2005a]. Right: Resulting fundamental diagram which represents the relation between N participants velocity and density with N ∈ [15, 20, 25, 30, 34]
There are also several studies using outdoor situation videos to analyse crowd behaviour. In this context, Costa[2010] studied groups of people walking in the street, and he noticed that groups composed only of men were more dispersed and their speeds were higher than groups composed of women or mixed groups. He also noticed that groups composed of 3 people (known as triads) moved in a triangular arrangement (”<“). Gorrini et al. [2015], for their part, studied the constitution of a crowd in a tourist passageway using videos. They showed that this crowd was mainly composed of groups (84%), with the majority being groups of two (44%). Their results indicated that groups generally walked slower than indi-viduals and that two-person groups tended to be less dispersed than other groups. It can be noticed that all these studies focusing on crowds considered general attributes, such as average walking speed, and not on the behaviour of a specific subject in a crowd. Indeed, it can be difficult to understand trajectory formation
2.2 Pedestrian Interactions in Real Environment 21
in such situations, as it is equivalent to inverting the injective process by which multiple sources of interactions combine to influence a single trajectory of lower dimension. To do so, another possibility is to understand what elements pedestri-ans have taken into account, which are ultimately part of the elements they have perceived over time, as explained in section 1.2. In that context, it has been shown that vision is a major perceptual system that guides locomotion [Warren, 1998,
Patla, 1997, Berthoz, 2000]. We will then present in the next section the general concepts linked to the visual systems as well as the studies which investigate its role during human locomotion.
2.2.2
Vision and Locomotion
This section first introduces some terminology and terms in relation to the vision that are important to vision and gaze activity in Section 2.2.2.1. Then Sec-tion 2.2.2.2 focuses on the presentaSec-tion of the gaze activity and its analysis. Fi-nally, Section 2.2.2.3 presents the different experiences related to locomotion and gaze activity.
2.2.2.1 Concepts about Vision
Vision is a perceptual system using the eyes (Figure 2.11) as a sensing organ to perceive the environment [Vickers, 2007]. In order to create an image of the envi-ronment, the rays of light reflected or emitted by all elements in the envienvi-ronment, enter the eye through the pupil, an orifice surrounded by the iris. Then, each ray of light goes through the cornea and the pupil in order to finally reach the retina. Finally, the retina converts these light signals into electrical signals and sends them to the brain via the optic nerve in order to process it. Furthermore, a por-tion of the retina name fovea is the locapor-tion where the visual acuity is maximum, allowing thus to see visible small details on objects.
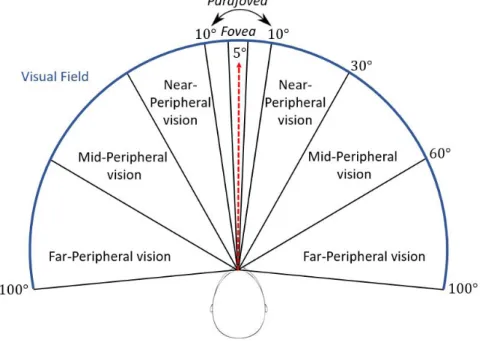
The portion of the environment perceived by the eyes is called visual field [Spector,1990] or field of vision and is often expressed in degrees. For monoc-ular vision (one eye), the field of view is approximately 100° horizontally and 60° vertically whereas for binocular vision (two eyes), the field of view is approxi-mately 200° horizontally but do not change vertically. The gaze, being the center of the field of vision, is defined as the vector starting from the center of the fovea and passing through the center of the iris and can be expressed in different ref-erential systems such as world, head or centre of the eyes. The visual field is further divided into several subregions [Pöppel and Harvey, 1973,Simpson,2017] as shown in Figure 2.12. In its centre is the fovea, which corresponds to the zone where the visual acuity is maximum. Depending on the field of application of the researchers [Strasburger, 2020], this zone varies from 1◦ ∼2◦ up to 5◦. Then,
from 5◦ to 10◦ is the parafovea zone. These two zones are often considered as the
central vision and the rest of the visual field as the peripheral vision. We find then, the near-peripheral vision (10◦−30◦), the mid-peripheral vision (30◦−60◦)
and the far-peripheral vision (60◦−100◦).
Figure 2.12 – Illustration of the different regions of the visual field. With the fovea (0◦−5◦), the parafovea (5◦− 10◦), the near-peripheral vision (10◦− 30◦), the mid-peripheral vision (30◦− 60◦)
and the far-peripheral vision (60◦− 100◦).
With these definitions of the various zones of the visual field, many researchers studied their utility in relation to tasks that participants were expected to perform in specific environments. For instance, Collier et al. [1931] showed that simple
2.2 Pedestrian Interactions in Real Environment 23
pattern recognition is possible across the majority of the field of view (central and peripheral), however, the closer an object is to the fovea, the more details about it can be seen. For the case of locomotion, many researchers [Stoffregen et al.,1987,
Jovancevic et al., 2006, Marigold and Patla, 2007, Marigold, 2008, Turano et al.,
2005] showed how the presence of visual cues in the peripheral vision are impor-tant during walking in an environment alone or with other pedestrians. Moreover, regarding studies in a social context, it has also been shown that gaze conveys a certain amount of information during social interactions [Frischen et al., 2007,
Nummenmaa and Calder,2009,Itier and Batty,2009]. In the frame of the theory of mind (ToM), which refers to the ability to explain the mental state of another person, some works [Itier and Batty, 2009, Calder et al., 2002, Baron-Cohen,
1997] indicate that gaze could be used as a relevant feature to understand people attention. Finally, gaze can also have an impact on the perception of others. In their work, Mason et al. [2005] demonstrated that a person is perceived as more likable by another person when a mutual gaze occurred instead of an averted gaze. All these previous studies highlight the importance of the vision and the gaze activity when walking or interacting with other people. For this reason, in this thesis, we work on the hypothesis that the analysis of gaze activity in parallel with the analysis of the trajectory can provide additional information to understand the actions of pedestrians when navigating in a crowd. In particular, by looking at the information perceived before making a movement or an action.
2.2.2.2 Gaze Activity
The study of gaze activity is the analysis of eye movement or 3D gaze points over time. When these data are analysed in the reference system of the head, it is referred as eye-gaze activity. Gaze activity, on the other hand, corresponds to the global coordinates of the gaze in the world space [Guitton and Volle,1987], which therefore also accounts for head rotations. These data are recorded using eye trackers with different systems and methods [Kar and Corcoran, 2017] in order to estimate the direction of the gaze over time and record it. Moreover, it is necessary to calibrate these tools before performing a recording.
According to Findlay et al. [2003] three types of eye movements are related to the target selection by the perceiver:
• Pursuit is a smooth and continuous movement of the eyes to follow a target of the gaze (Figure 2.13-left).
• Vergence keeps the eyes pointing toward a target that is in a distant di-rection (Figure 2.13-middle). This causes both eyes to rotate in opposite directions.
• Saccade is a fast movement allowing the perceiver to move from one target to another (Figure 2.13-right). Unlike vergence and pursuit, the eye move-ment during saccade is extremely fast and consists of a multitude of jumps. In addition, it is also important to note that no useful visual information is acquired by the perceiver during the saccade [Parasuraman and Rizzo,
2008].
Figure 2.13 – Illustration the three eye movements: Pursuit (left), Vergence (middle) and Saccade (right). For each illustration, the eye vectors are in red, the gaze points are in green and the rectangles represent the objects being looked at.
Furthermore, when walking, a different eye movement (Vestibulo-ocular re-flex) appears, allowing the perceiver to compensate for the body and head move-ments in order to keep the image of the visual world steady on the retina. These movements occur automatically and independently of the perceiver’s will. In their work, Leigh and Zee [2015] also introduce the term visual fixation corresponding to the movement of the eyes that keeps an object in the fovea.
In order to describe gaze activity, the term fixation is commonly used to define a period when eye movements are more or less stationary. Thus, by using it, it is possible to define gaze activity as a succession of fixations (lasting on average 200-400 ms) separated by saccades (lasting on average 30-50 ms) [Parasuraman and Rizzo, 2008]. Furthermore, there are micromovements of the eye within a fixation that are associated with drifts, tremors, or micro-saccades. In practice, a fixation is associated with a set of 3D points of the gaze being all within 2◦ 4◦
degrees of each other (size of the fovea). However, the exact definition of fixation can be unclear as explained by Hessels et al. [2018] in a review where they present
2.2 Pedestrian Interactions in Real Environment 25
the different definitions used by 124 researchers. It is therefore important in every work on gaze activity study to clearly define what is considered to be a fixation and how it is detected.
Many methods have been developed to detect fixations and saccades. In their work, Salvucci and Goldberg [2000] present different spatial and temporal criteria that are the basis for the majority of these methods. Fixations, in contrast to saccades, are gaze points with low velocity, located around the same spatial region and therefore with a low dispersion for all the data in the same fixation. In addition, fixations also have a temporal constraint as they rarely last less than 100ms and are often between 200ms and 400ms, whereas saccades last between 30ms and 50ms. Using one or several criteria, Salvucii and Goldberg [2000] then proposed five basic algorithms for the classification of fixations. One of them in particular is based on the gaze points’ velocity using thresholds to identify fixations. This kind of velocity-based method (I-VT) was later improved by various researchers. For instance, Komogortsev and Karpov [2013] use speed thresholds and point dispersion thresholds combined with a time window to detect fixations. Salvucci and Goldberg [2000] also proposed spatial-based methods using the duration of fixations coupled with a threshold on the dispersion of a set of gaze points (I-DT) or the location of these points in the space (I-AOT). Furthermore, in the past few years, researchers have started using deep learning approaches such as the one proposed by Starsev et al. [2019]
2.2.2.3 Experiments
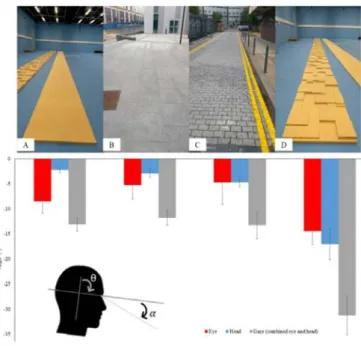
In the experimental field, there have been numerous studies that investigated gaze activity during locomotion tasks for diverse situations. For instance, some of them focused on analysing both participants’ locomotion and gaze activity while they were walking on different kinds of ground [Marigold and Patla, 2007, Thomas et al.,2020], as illustrated in Figure 2.14-Top. In particular for indoor laboratory experiments, Marigold and Patla [2007] showed that participants’ fixations were mainly on areas that were steeped on. In addition, a lot of these fixations were directed towards transition areas between two surfaces, which are finally the most complex surfaces. Thomas et al. [2020] conducted the same kind of experiments but for both indoor and outdoor situations. Their results indicate that both par-ticipants’ speed and eye angle were lower when they walked on the more complex surfaces (Figure 2.14-Bottom).
Figure 2.14 – Top: Illustrations of the different indoor (A&D) and outdoor (B&C) types of ground used during the experiment of Thomas et al. [2020]. Bottom: Mean angle for eye (red), head (blue) and combination of eye and head (gray) for the four different ground.
of task planning on gaze activity and locomotion. In their experiments, they asked participants to perform three different scenarios where the task became progressively more complex. In the first one participants had to walk toward a bookcase with a cup on it, in the second participants had to do the same thing but also pick up the cup. Finally, in the third situation, participants performed all the precedent tasks but they also had to put the cup higher in the bookcase. Participants exhibited the same behaviour regarding the beginning of the task with an acceleration towards the bookcase and then a deceleration when they were close to it. However, the participant’s peaks of velocity were higher for more complex tasks. In addition, the participant’s gaze activity was also impacted by the task complexity, with higher fixation duration. This can indicate that to take information and process it, the duration of fixation has greater importance than the number of fixations. Moreover, these results also indicate that gaze activity is task-dependent, which is consistent with previous work [Yarbus,2013]. In another situation, Cinelli et al. [2009] conducted an indoor laboratory experience where participants had to go through 2 motor-driven sliding doors. Two conditions were studied either the two sliding doors had the same velocity (symmetrical) or different ones (asymmetrical). There was no difference in participants’ locomotion between the two conditions, with their speed decreasing before going through the doors. Furthermore, participants fixated longer on the second door for the
2.2 Pedestrian Interactions in Real Environment 27
asymmetrical condition as the door movement was more complex.
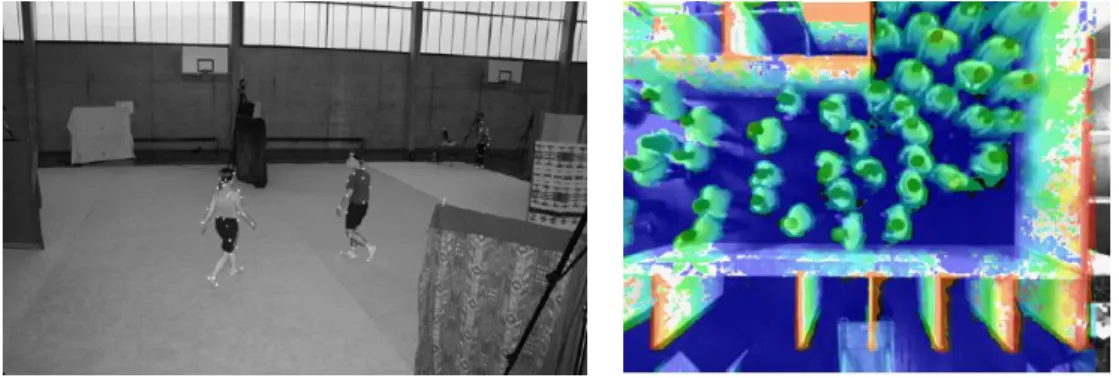
However, these previous studies did not include interactions with other peo-ple. In this perspective, Laidlaw et al. [2011] conducted an experiment where participants were seated in a waiting room with another person (confederate) or a videotape of him. They found that participants looked more at the confederate when he was on videotape than when he was physically present, which suggests that gaze activity is also dependent on the social situation. Regarding experimen-tal studies during dynamic tasks, Kitazawa and Fujiyama [2010] had participants walking on a platform on which a collision could occur with other confederates or static objects. The purpose of this experiment was to study the relationship be-tween gaze and the Information Process Space (IPS) which is related to the notion of proxemics [Hall, 1963]. They noticed that participants do not gaze more at ob-jects and other pedestrians located in the scene than at the ground. Furthermore, they deduced that the IPS shape is not a homogeneous circle around the walker, but presents a more important anterior area. For their part, Jovancevic-Misic and Hayhoe [2009] conducted an experiment where participants had to walk around an oval track while other people acted in specific ways with predefined risks of collision, as illustrated in Figure 2.15. They demonstrated that participants adapt their gaze strategies depending on the behaviour of surrounding persons as pedes-trians with risky behaviours were more gazed at by participants.
Figure 2.15 – Experimental setup (oval corridor) used during the experiment of Jovancevic et
al. [2009]. The participant is represented by the red dot and the confederates by the black squares and arrows. The top image represents a point of view of the participant during the experiment with his gaze represented by the red crosshair.
In their work, Croft and Panchuck [2017] studied avoidance strategies be-tween two participants using a similar setup than for pairwise experiments (Sec-tion 2.2.1.1). Participants had to walk on either a constrained or an unconstrained path and avoid a collision with a confederate. Furthermore, this confederate was
walking either fast or slow with a crossing angle of 90◦. They found that
constrain-ing the path had an impact on participant locomotion and avoidance strategies. Moreover, participants’ gaze activity (e.g duration and number of fixations) was a good predictor to determine whether one pedestrian passed in front of the other. Regarding works with a crowd, Hessels et al. [2020] conducted an experiment where participants had to walk in a corridor filled with pedestrians and static objects, as shown in Figure 2.16. Two situations were studied. In the first, partic-ipants walked and avoided other pedestrians, while in the second they performed the same task but also pressed a button each time they saw a direct gaze toward them from oncoming people. In addition, the crowd followed a scripted scenario in order to repeat the same visual stimulus for each participant. For instance, 30% of the crowd were instructed to look at the participants, 10% − 20% of the crowd had to cross in front of the participants. They found no differences for locomotion (speed and collision) between the two situations. Furthermore, re-garding gaze activity, there were also no differences on the ratio of fixations on obstacles, pedestrian’s heads or pedestrian’s body. This suggests that faces do not attract the gaze during locomotion whereas it was the opposite in static situ-ations involving participants looking at images [Birmingham and Kingstone,2009,
Langton et al., 2008]. However, in the second situation, they noticed that when a mutual gaze occurred, fixation lasted longer.
Figure 2.16 – Schematic overview of the experimental setup used for Hessels et al. ’s study [2020], with participant (light blue arrowhead), static obstacles (yellow) and three groups of pedestrians (orange arrowheads, with group leaders in green arrowheads). The black arrow represent the path participants had to take.
2.3 Virtual Reality 29
Finally, Gallup et al. [2012], conducted an experiment in the corridor of a public building, where they put at one side of it a device with a hidden camera and an attractive visual stimulus. From these videos, two reviewers estimated some information from the pedestrians, such as their gender, if they belong to a group and if they looked at the stimulus. They showed that gaze upon this visual stimulus increased if other pedestrians in the crowd displayed visual cues toward this stimulus, especially when these pedestrians were in front.
All these experimental studies analysing participant’s behaviour during inter-actions with other pedestrians have shown that the experimental condition has a significant influence on human behaviour when walking. In particular, the initial conditions (e.g, speed [Olivier et al.,2012,2013], crossing angle [Huber et al.,2014,
Meerhoff et al., 2018b], task to perform [Saeedpour-Parizi et al., 2020, Yarbus,
2013]), the behaviour of other pedestrians [Jovancevic-Misic and Hayhoe, 2009], mutual gaze [Hessels et al., 2020], reading a message [Dicks et al., 2016]) or the presence of a visual stimulus [Cinelli et al., 2009, Gallup et al., 2012] have an impact on the participant’s locomotion or his gaze activity. It is therefore crucial to be able to reproduce the exact same stimuli for all participants during the experiment. This is more or less possible for controlled laboratory experiments with a limited number of participants. In the case of a crowd, it is also possi-ble, using scenarios, to have similar actions or ratios of pedestrians with a specific behaviour [Jovancevic-Misic and Hayhoe,2009,Hessels et al.,2020]. However, de-spite all the possible attention, the visual stimulus will never be exactly the same for each participant during all the experiment. For this reason, we are looking to use Virtual Reality (VR) as a tool to conduct experiments on human behaviour involving interactions with pedestrians. The next section presents some of the dif-ferent VR tools, but also the impact of VR on human perceptual systems, some of the limitations of VR, and the experiments that have been conducted to study human behaviour and locomotion in VR.
2.3
Virtual Reality
2.3.1
Technology
The expression virtual reality (VR) was introduced by Jaron Larnier in the 1980s, however there are some precursor elements such as the “Sensorama” (Figure 2.17-a) developed by Morton Heilig [1962]. In the words of Fuchs et al. [2006]:“The
sensory-motor and cognitive activity in an artificial world, created digitally, which may be imaginary, symbolic or a simulation of certain aspects of the real world”.
The first VR Headsets (HMD) began to appear in the early 1990s (Figure 2.17-b) and have now become common and affordable for the general public, in particular for their application in video games (Figure 2.17-c). There are currently more than a dozen HMDs on the market (e.g, Vive, Occulus, Valve Index...) each with its own advantages and disadvantages. In addition to HMDs, there is another virtual reality technology called CAVE ( for “Cave Automatic Virtual Environment”), which immerses a person through the use of 3D glasses and walls on which 3D videos are projected (Figure 2.17-d).
a) b) c) d)
Figure 2.17 – From left to right several virtual reality devices through time with: Sensorama (a) in 1956, SegaVR (b) in 1991, Vive (c) in 2019 and Immersia Cave (d) in Rennes
In addition to the application of VR for video-games, several researchers be-came interested in studying human behaviour in the early 2000s [Loomis et al.,
1999, Blascovich et al., 2002, Tarr and Warren, 2002]. In their discussion about experimental research in psychology, Loomis et al. [1999] explain that scientists in this field of application had to compromise between experimental control and ecological validity. According to them, VR offers the best tradeoff between these two components compared to traditional methods (Figure 2.18). Indeed, VR enables scientists to manipulate and have control over the whole experimental environment, which is impossible for in the physical world. For instance, when studying pedestrian interactions, it is possible to control all the pedestrians’ ac-tions over time, their behaviours, their attributes (e.g, gender, height, morphology, clothes...).
However, despite all the benefits that VR offers for experimental research, there are also some drawbacks such as the reduced field of view offered by HMDs or the possibility of finding artefacts in the virtual environment. In addition, it can be difficult for VR to accurately and reliably reproduce all the elements that the human perceptual system receives as input in a physical environment. Therefore, it is necessary to assess the differences in human behaviour in a real or virtual environment and thus be aware of the potential biases induced by VR.
2.3 Virtual Reality 31
Figure 2.18 – Plot of the compromise between experimental control and ecological validity for traditional methods and VR according to Loomis et al. [1999]
2.3.2
Evaluation of Virtual Reality
2.3.2.1 Locomotion and Personal Space
There are different methods for a user to move in a virtual environment (VE). These include the use of locomotion interfaces that combine an input device (joys-tic, keyboard...) and a control law which transcribe input data into movements in the VE. For instance a classic control law is the “linear rate”[Cirio et al.,2013] where the movements are mapped according to the participant’s tangential and angular velocity. Another method is to enable the user to walk physically in the VE using cameras and 3D markers (included in the HMD or on the user’s body). These systems record the user’s position and movements in the real environment (RE) and stream them into the VE. Finally, treadmills are also used to move in a VE, especially over long linear distances. Many studies have therefore focused on evaluating the impact of VR and locomotion methods on participants’ trajectories when immersed in a virtual environment. In this perspective, Cirio et al. [2013] proposed a framework to compare trajectories performed in a real and virtual environment (Figure 2.19).
For this purpose, they introduced several metrics based on the shape of the tra-jectory, the participants’ performance, and other kinematic characteristics. They carried out an experiment in which participants had to walk through a door with different orientations in a real or virtual environment. They varied not only the input device of the locomotion interface (joystic, keyboard, gamepad) but also the control law (linear rate, inertial rate, joyman), the point of view of the par-ticipant’s camera in the virtual environment (subjective camera, third person or
![Figure 2.2 – Illustration of the three main approaches for crowd simulation Flow- Flow-based [Treuille et al., 2006] (left), Data-driven [Lee et al., 2007] (middle) and Agent-based [Dutra et al., 2017] (right)](https://thumb-eu.123doks.com/thumbv2/123doknet/14656311.738689/16.892.151.791.478.684/figure-illustration-approaches-simulation-treuille-driven-middle-agent.webp)
![Figure 2.5 – Illustration of the main loop used in Lopez et al. [2019] to update and move an agent.](https://thumb-eu.123doks.com/thumbv2/123doknet/14656311.738689/21.892.237.649.438.682/figure-illustration-main-loop-used-lopez-update-agent.webp)
![Figure 2.10 – Left: laboratory setup used during Seyfried et al. ’s experiment[2005a]](https://thumb-eu.123doks.com/thumbv2/123doknet/14656311.738689/27.892.189.694.459.656/figure-left-laboratory-setup-used-seyfried-et-experiment.webp)
![Figure 2.21 – Board of light used during Pfeil et al. ’s experiment [2018] in order to investigate the differences in gaze activity between real (left) and virtual (right) environment.](https://thumb-eu.123doks.com/thumbv2/123doknet/14656311.738689/41.892.203.692.433.670/figure-board-experiment-investigate-differences-activity-virtual-environment.webp)
![Figure 2.25 – Illustration of initial condition for Bruneau et al. ’s experiment [2015]: example of group size and interpersonal distance between pedestrians (top row) and group appearance (bottom row).](https://thumb-eu.123doks.com/thumbv2/123doknet/14656311.738689/46.892.168.726.152.381/illustration-condition-bruneau-experiment-interpersonal-distance-pedestrians-appearance.webp)