HAL Id: hal-02087354
https://hal-amu.archives-ouvertes.fr/hal-02087354
Submitted on 3 May 2019HAL is a multi-disciplinary open access archive for the deposit and dissemination of sci-entific research documents, whether they are pub-lished or not. The documents may come from teaching and research institutions in France or abroad, or from public or private research centers.
L’archive ouverte pluridisciplinaire HAL, est destinée au dépôt et à la diffusion de documents scientifiques de niveau recherche, publiés ou non, émanant des établissements d’enseignement et de recherche français ou étrangers, des laboratoires publics ou privés.
A water tank muon spectrometer for the
characterization of low energy atmospheric muons
Daniela Munteanu, Soilihi Moindjie, Jean-Luc Autran
To cite this version:
Daniela Munteanu, Soilihi Moindjie, Jean-Luc Autran. A water tank muon spectrometer for the characterization of low energy atmospheric muons. Nuclear Instruments and Methods in Physics Research Section A: Accelerators, Spectrometers, Detectors and Associated Equipment, Elsevier, 2019, 933, pp.12-17. �10.1016/j.nima.2019.03.061�. �hal-02087354�
A water tank muon spectrometer for the characterization
1
of low energy atmospheric muons
2 3
D. Munteanu, S. Moindjie, J.L. Autran* 4
Aix-Marseille Univ, Univ Toulon and CNRS, IM2NP UMR 7334 5
Faculté des Sciences, Service 142, Avenue Escadrille Normandie Niémen 6
F-13397 Marseille Cedex 20, France 7
8
Abstract 9
In this work, a water tank muon spectrometer was designed, assembled and operated to 10
measure the energy distribution of low energy atmospheric muon flux induced by cosmic-rays 11
at sea level in the energy range 100-500 MeV. The principle of this experiment is to use water 12
as muon moderator inserted between two coincidence detectors to select the cutoff energy 13
below which muons can no longer be detected. The differential and integral muon spectra are 14
then derived from successive measurements by varying the liquid height within the water tank. 15
The instrument was entirely characterized and modeled in terms of detector efficiency, cutoff 16
energy and counting rate. Experimental data are reported for the energy distribution of muon 17
flux at sea level (43°N of latitude) and finally compared with literature survey. 18
19
Keywords: Atmospheric muons, low energy muons, cosmic rays, muon flux, muon 20
spectrometer, sea level muon intensity, differential spectrum, integral spectrum 21
22
*Corresponding author. Tel: + 33 413594627, fax: +33 491288531
23
E-mail address: jean-luc.autran@univ-amu.fr
1. Introduction 25
Muons are the most abundant energetic charged particles at sea level where they arrive 26
with an average flux of about ≈1 muon per square centimeter and per minute and with an 27
average energy of about 4 GeV [1]. Their characterization provides important information on 28
the physics of primary cosmic rays and on the production mechanisms of atmospheric 29
cascades. An abundant literature exists for muons at ground level and underground but the 30
overwhelming majority of works rather concerns high-energy physics with energy ranges 31
above a few GeV and beyond [2]. Literature surveys on atmospheric muons [2-7] show that 32
there is a clear lack of experimental data typically below a few hundred MeV. In another field 33
of interest, i.e. in radiation effects on modern electronics, the interest for low energy muons is 34
rapidly growing due to the potential role that they can play in failure mechanisms of 35
nanoscale digital integrated circuits [8, 9]. Even if the research effort has so far focused 36
mainly on the errors induced by atmospheric neutrons in electronics [10-14], the effects of 37
muons can no longer be neglected. Indeed, recent investigations demonstrated the importance 38
of these particles in the production of soft errors in the most advanced CMOS technologies 39
[15-18]. The probability of memory upsets was shown to increase near the energy region 40
corresponding to muon stopping in the circuit semiconductor material, indicative of direct 41
ionization effects [16]. The characterization of low energy muon distributions at ground level 42
is thus a challenging issue for the prediction of radiation effects in microelectronics; this 43
corresponds to the initial motivation of the present work. 44
In this context, we recently developed a muon telescope to measure the cosmic-ray 45
induced atmospheric muon flux at sea level (43°N of latitude) in terms of vertical muon 46
intensity and zenithal angle dependence [19]. However, the energy distribution of the muon 47
flux cannot be measured with the instrument developed in [19]. In the present work, we thus 48
developed a new instrument, called “water tank muon spectrometer” to precisely measure the 49
energy distribution of atmospheric muons in the range of hundreds of MeV. The principle of 50
this experiment is to use water as muon moderator sandwiched between two detectors in 51
coincidence to select the cutoff energy below which the muons will no longer be detected. It 52
is then possible to determine the energy distribution of muon flux by varying the water height 53
in the water reservoir. This paper details the main characteristics of this instrument including 54
its complete characterization and modeling and reports our first measurements of the muon 55
differential and integral flux in the range 100-500 MeV conducted at sea level in Marseille 56
(43° N of latitude). 57
2. The water tank muon spectrometer 58
2.1. Experimental setup 59
The experimental setup is presented in Figure 1. The muon spectrometer was developed 60
using a dedicated metallic tower structure capable to support heavy load (two metric tons of 61
water in storage tanks) between the two detectors installed at the top and the bottom of the 62
structure. The two detectors are square plastic scintillators (surface of 50x50 cm2, thickness of 63
5 cm, housed in 1.5 mm of aluminum plate). The plastic scintillator is made of 64
polyvinyltoluene (PVT) and fabricated by Eljen Technology (EJ-200) [20]. This plastic is 65
highly sensitive to charged particles: its typical stopping power for 1 GeV muons is 2.132 66
MeV/cm [21]. Each scintillator has a photomultiplier tube (PM) directly integrated in the 67
assembly; the tube is placed in a housing positioned in the bulk material and optically coupled 68
using a high refractive index optical coupling medium at the bottom of the housing (polished 69
surface with an optical quality). The PMs are Hamamatsu model R6427 with 28 mm tube 70
diameter, 25 mm round photocathode and 10-stage photomultiplier. The assembly 71
(PM+scintillator) is mounted in an aluminum housing (thickness 1.5 mm) that ensures a 72
permanent light sealing. This solution also offers a simplification of detector design by 73
eliminating support hardware to maintain contact between the scintillator material and the PM. 74
75
(a) (b)
76
Figure 1. (a) Front view of the water tank muon spectrometer composed from two square 77
detectors mounted on a metallic support and separated by two water storage tanks made from 78
blow molded high-density polyethylene. The variation of the water level is carried out 79
manually by filling or emptying the tanks with an electrical pump. (b) Schematic 80
representation of the water tank muon spectrometer: the main geometrical parameters and 81
structure configuration are indicated. 82
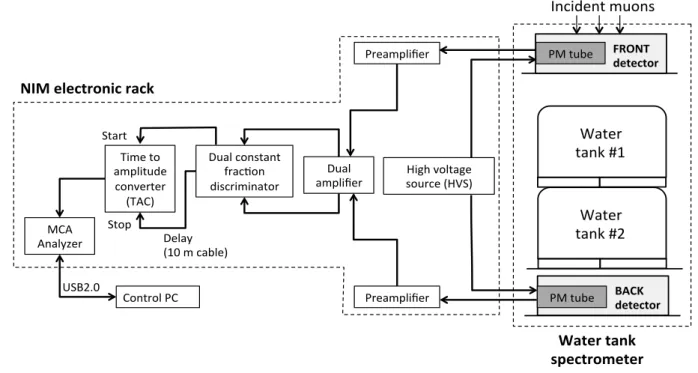
The two PMs are connected to the measurement and acquisition chain shown in Figure 2. 83
Photomultipliers convert scintillation light pulses into electrical signals that are then sent to 84
the acquisition chain which trigs the muons traversing the front scintillator and measures, 85
using a coincidence detection procedure in a time window of 10 ns, their time-of-flight 86
Surface : 50 x 50 cm2
Thickness: 50 mm 1.5 mm protection layer (Al) Integrated photomultiplier FRONT detector BACK detector Water tanks Metallic support structure 281.5 cm Incident muons FRONT detector BACK detector 103 cm 103 cm Surface: 50 x 50 cm2 Thickness: 50 mm 1.5 mm protection layer (Al) Integrated photomultiplier
Water tank #1 Capacity: 1,000L
Water tank #2 Capacity: 1,000L
between the front and back detectors separated by a distance of 2.815 m. PM signals as well 87
as time-of-flights converted in voltage pulses using a time-to-amplitude converter (TAC) are 88
digitized using multi-channel analyzers (MCAs based on 16k ADCs). For piloting the 89
experiment, we have developed dedicated Visual Basic software that allows the acquisition of 90
the muon count rate as function of the water level in the water tank. The two polyethylene 91
water tanks have a thickness of about 3 mm except the bottom of the tanks, which has a 92
thickness of 9 mm. The second tank is installed on a stainless steel plate about 2 mm thick. 93
The variation of the water level was carried out manually by filling or emptying the tanks by a 94
step of 100 L, which corresponds to a water height of 9 cm. An additional layer of lead with a 95
thickness of 50 mm was optionally added just below the top detector in order to verify that 96
low energy gamma rays and electrons are satisfactorily rejected in the detector response. 97
98
Figure 2. Schematics of the electronics acquisition chain for measuring the time-of-flight of 99
coincidence muons between the two detectors of the spectrometer. 100 101 Water tank spectrometer BACK detector High voltage source (HVS) Dual amplifier MCA Analyzer Dual constant frac?on discriminator Time to amplitude converter (TAC) Control PC USB2.0 Stop Start Delay (10 m cable) NIM electronic rack Incident muons FRONT detector Preamplifier PM tube Preamplifier PM tube Water tank #1 Water tank #2
2.2. Spectrometer calibration 102
In order to optimize the spectrometer operation and to be sure that the spectrometer detects 103
and counts only atmospheric muons, a careful calibration of the instrument has been 104
performed, very similarly to that carried out in [19] for the cosmic ray telescope. The 105
calibration procedure consists in the following three steps: 106
(i) the detection threshold of the pulses coming out of each PM has been fine-tuned 107
(around 130 mV), which ensures that the low-energy peak (due to the PM noise and 108
the contribution of ambient gamma radiation) is well rejected, the counting rate 109
thus only corresponding to the contribution of the sole charged atmospheric muons 110
(see Fig. 3 in [19] for details) ; 111
(ii) the nominal value of the supplying voltage (around 1500 V) for each PM has been 112
carefully selected in order to operate in the middle of the plateau of the PM 113
counting rate – voltage characteristics ; 114
(iii) a calibration of the electronic acquisition chain has been also conducted to 115
determine the MCA channel number versus time proportionality. The MCA was 116
calibrated to a resolution of approximately 160 bins/ns. 117
Finally, since a detector may sometimes miss (i.e. do not detect) a muon passing through, 118
the efficiency, η, of each detector has been carefully determined using the calibration 119
procedure described in [19]. We found ηF = 99% and ηB = 99% for the front and the back
120
detector, respectively. 121
2.3. Spectrometer modeling and simulation 122
2.3.1. Cutoff energy 123
To be detected by the back detector, muons must cross the instrument with a minimal energy, 124
depending on the level of water in the tanks, called cutoff energy (Emin). Extensive
simulations using TRIM (Transport of Ions in Matter) Monte Carlo simulation code [22] have 126
been performed to determine the cutoff energy of the spectrometer for each water level in the 127
tanks. In these simulations we have taken into account the exact 1D stack of materials that the 128
muons pass through from the metal roof of the building to the back detector, including the 129
first floor (air and concrete slab) and the different materials of the spectrometer. Muons have 130
been emulated in TRIM by applying a simple “mass scaling” to protons, as suggested in [23]. 131
We estimate that signal pulses produced by a particle depositing around 2 MeV in the 132
scintillator material of the detector can pass the constant fraction discriminator. Figure 3 and 4 133
illustrate TRIM simulations used to determine the cutoff energy for a cumulative water level 134
in the tanks of 150 cm. We consider an incident muon arriving in perpendicular incidence on 135
the building roof with an incident energy of 374 MeV. The muon pass through the successive 136
layers from the metallic roof to the back detector and its energy decreases until going to zero 137
in the back detector where it definitely stops and is detected by the coincidence detection 138
procedure. The variation of the muon energy and the energy lost in each layer are shown in 139
Fig. 3 and 4, respectively; the different layers crossed by the muon are also indicated in these 140
figures. Our simulations show that muons with lower incident energies are stopped in the 141
spectrometer layers before reaching the back detector (i.e. they will not be detected by the 142
spectrometer), while muons with higher incident energies are systematically detected by the 143
back detector. This means that the cutoff energy of the spectrometer for a water level of 150 144
cm is Emin = 374 MeV. This value should be slightly higher for oblique tracks. The same
145
procedure was used to determine the cutoff energy of the spectrometer for each level of water 146
in the water tanks. Figure 5 shows the calculated cutoff energy of the spectrometer as a 147
function of the cumulative height of the water level in the two water tanks. 148
150
Figure 3. TRIM simulation showing the muon energy variation through the water tank 151
spectrometer for an incident energy of 374 MeV (particle track perpendicular to the detector 152
surfaces). The water height is 50 cm in the first water tank and 100 cm in the second tank. 153
The cutoff energy of the spectrometer for a water level of 150 cm is Emin = 374 MeV.
154 0 50 100 150 200 250 300 350 400 350 400 450 500 550 600 650 Water tank #1 Water tank #2 Air Water (50 cm) F ro nt d et ect or Ai r Water (100 cm) Me ta lli c su pp ort st ru ct ure + Ai r Ba ck de te ct or Ai r + St ai nl ess st ee l p la te 0 50 100 150 200 250 300 350 400 0 20 40 60 80 100 120 140 160 180 200 220 240 260 280 300 320 340 350 Ai r ( fir st flo or ) + Co nc re te s lab o f th e fir st flo or + Ai r ( gr ou nd fl oo r) Mu on en ergy (Me V) Distance from the building roof (cm) 0 50 100 150 200 250 0 50 100 150 200 250 300 Water tank #1 Water tank #2 Air Water (50 cm) F ro nt d et ect or Ai r Water (100 cm) Me ta lli c su pp ort st ru ct ure + Ai r Ba ck de te ct or Ai r + St ai nl ess st ee l p la te Mu on en ergy loss (Me V) Distance from the front detector external face (cm)
Figure 4. TRIM simulation showing the muon energy loss through the water tank 156
spectrometer for an incident energy of 374 MeV. The water height is 50 cm in the first water 157
tank and 100 cm in the second tank. 158
159
Figure 5. Muon cutoff energy of the spectrometer as a function of the cumulative height of 160
the water level in the two water tanks with and without the optional 50 mm-thick lead layer. 161
2.3.2. Modeling of the spectrometer counting rate 162
The spectrometer counting-rate has been numerically estimated from a model directly 163
derived from the work of Sullivan [24] and Thomas and Willis [25]. Figure 6 introduces the 164
notations used in the following. For an anisotropic distribution of incident muons I (m-2s-1sr-1) 165
following a power cosine law with the zenithal angle θ: 166
I = 𝐼!𝑐𝑜𝑠!(𝜃) (1),
167
the counting rate CR (s-1) of the spectrometer fixedly pointing in the vertical direction can be 168 easily expressed as [25]: 169 0 100 200 300 400 500 600 0 20 40 60 80 100 120 140 160 180 200
Muon cutoff energy (MeV)
Cummulative height of the water level in the tanks (cm) Without lead layer
CR = 𝐼!𝜂!𝜂! !!! ! !!!! !!!! !! !!!!! ! !!!𝑑𝑥! ! !! ! !! ! !! ! !! 𝑑𝑥!𝑑𝑦!𝑑𝑦! (2) 170 171 172
Figure 6. Schematics of the front and back detectors, and definition of axes, angles and 173
different quantities used in the modeling of the spectrometer counting rate. For the setup 174
shown in Fig. 1, main dimensions are Z = 2.815 m and L = 0.25 m. 175
where I0 is the vertical muon flux (expressed in m-2 s-1 sr-1) integrated over the energy range
176
of the instrument, ηF and ηB are the front and back detector efficiencies, respectively, and Ζ is
177
the distance between the two square detectors of surface 4L2 (see Figure 6).
178
Assuming that the zenith angle distribution of muons follows Eq. (1) with a fixed value of 179
exponent n in the energy range of interest of the instrument, Eq. (2) directly gives the value of 180
I0 for each experimental counting rate CR corresponding to a given water height in the tank,
181
i.e. to a given cutoff energy Emin.
182 x y M1(x1,y1,Z) q
z
z O M2(x2,y2,0)Muon flux intensity [m-2s-1sr-1] I(q) = I0cosn(q) FRONT detector BACK detector dS1 dS2 2L 2L d Front detector efficiency hF Back detector efficiency hB Spectrometer counting rate CR [s-1] cos(q) = Z/d
For n = 2, Eq. (2) can be expressed analytically and the counting rate of the instrument is 183
then given by: 184 𝐶𝑅!!!! = 𝐼 !𝜂!𝜂!×2𝐿 ! !!!!! !!!!!!×𝑎𝑟𝑐𝑡𝑎𝑛 !! !!!!!! − 𝑍×𝑎𝑟𝑐𝑡𝑎𝑛 !! ! (3) 185
where the superscript “a” is for “analytical” and the subscript “n=2” indicates that this 186
expression is restricted to this particular value of parameter n. 187
188
Figure 7. Counting rate as a function of the distance between the front and back detectors. 189
The experimental data are obtained using an additional setup based on a plastic shelf 190
described in [19]. The curve labeled “Model” is obtained from Eq. (3) with 191
I0 = 100 µ m-2.s-1.sr-1 and n = 2.0, as experimentally obtained in [19].
192
3. Experimental results: sea level measurements 193
The muon spectrometer has been assembled indoors, on the ground floor of the 194
experimental hall of a steel-frame industrial building with a single floor (concrete slab, 195
thickness 10 cm) and a metal roof. The building is located on the Aix-Marseille University 196 0 200 400 600 800 1000 1200 1400 1600 0 0.5 1 1.5 2 2.5 3
Counting rate (counts/min)
Distance between front and back detectors (m) Experimental data Analytical model - Eq.(3)
To check the validity of the spectrometer counting-rate modeling (Eq. 3), we performed 198
preliminary measurements by varying the distance Z between the two detectors, using a 199
plastic resin shelf with seven regularly spaced shelves. In this case, the two detectors were 200
temporarily removed from the spectrometer setup and aligned vertically on two shelves of this 201
complementary characterization setup. Figure 7 shows the results of the model 202
characterization: the experimental data are in very good agreement in a distance range 203
between 40 cm and 3 m with the results of simulation using the analytical model (Eq. (3)) 204
presented above, taking values I0 = 100 µ m-2.s-1.sr-1 and n = 2.0, as experimentally obtained
205
in [19]. 206
207
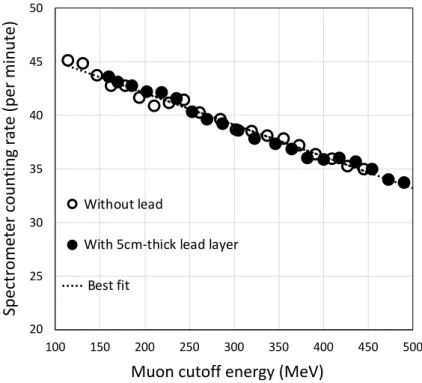
Figure 8. Experimental counting rates (with and without the 50 mm-tick lead layer) as a 208
function of the cutoff energy of the spectrometer. Each point corresponds to a value averaged 209
over one week (168 h). 210
After this preliminary step, the muon spectrometer was continuously operated for around 211
nine months for the acquisition of experimental data. Figure 8 shows the variations of the 212 20 25 30 35 40 45 50 100 150 200 250 300 350 400 450 500 Sp ec tr om et er c ou nti ng ra te (p er m in ut e)
Muon cutoff energy (MeV) Without lead
With 5cm-thick lead layer Best fit
the water level in the water tanks. Two series of data have been acquired, with and without 214
the 50 mm-thick lead layer. Each point corresponds to a value averaged over one week (168 215
hours). These results show a quasi-linear decreasing relationship between the counting rate 216
and the instrument cutoff energy. They also show that the presence of the additional lead layer 217
in the instrument material stack does not alter this linear dependency and only shift by ~50 218
MeV the energy domain explored by the instrument. 219
220
Figure 9. Muon spectrum at sea level deduced from data of Figure 8 and measured in other 221
experiments [3,4,5]. The line refers to the fit of experimental data with Eq. (4) and data 222
parameter from [26]. The fluxes are multiplied by p2, where p is the momentum in GeV/c. 223
From data of Figure 8 and considering the analytical equation (3), the integral vertical 224
muon flux I0 above energy Emin can be extracted from the experimental counting rate value
225
for each value of E varying from ~100 to ~500 MeV (for a muon rest mass of 105.659 226 0.1 1 10 100 0.1 1.0 10.0 p 2 x'm uo n'd iff er en tial 'fl ux'[ m 52 s 51 sr 51 (G eV /c )]' Muon'momentum'at'sea'level'p'[GeV/c] Rastin'1984 Allkofer'1971 Kremer'1999'(CAPRICE'1994) This'work Analytical'fit'5'Eq.(4)
MeV, the corresponding muon momentum ranges from 0.176 to 0.596 GeV/c). Considering 227
the first derivative of this I0(Emin) relationship (using the best linear fit on three consecutive
228
points delimiting a small energy interval), we deduced the muon differential flux values 229
reported in Figure 9. Experimental data measured in other published works [3,4,5] are also 230
shown for comparison. Our values ideally complete the muon spectrum in an energy domain 231
where only a few and sparse data were previously reported, especially below 200 MeV. These 232
data are also consistent with previously published data and fits, in particular with the 233
parabola-fitting model on a log-log scale given by [26]: 234
log I θ = a 𝑙𝑛! 𝑝 + 𝑏 𝑙𝑛 𝑝 + 𝑐 (4)
235
where p is the muon momentum in GeV/c and a, b, and c are three fitting parameters. 236
The analytical fit shown in Figure 9 has been obtained with Eq. (4) considering the values 237
of a, b, and c reported in [26] for a vertical zenith angle: a = -0.1292, b = -0.266 and 238
c = -2.600. We observe that our data satisfactory agree with this analytical fit in the full 239
energy domain covered by the instrument. 240
4. Conclusion 241
In this work, we developed an original setup, called “water tank muon spectrometer”, to 242
measure the energy distribution of low energy atmospheric muon in the energy range 100 to 243
500 MeV (momentum range 0.176 to 0.596 GeV/c) not yet covered by other ground-level 244
instruments. The instrument use water as muon moderator and a controllable water height up 245
to 2m to vary the muon cutoff energy. The differential flux for vertical muons at sea level 246
(43°N of latitude) has been deduced from experimental measurements combined with the 247
numerical modeling of the instrument. Differential flux values obtained between 100 and 500 248
MeV are consistent with previously published data and parabola fitting model available in 249
in order to make the measurements fully controllable by computer. With such an automated 251
instrument, middle-term work will consist in a continuous muon flux monitoring to evidence 252
possible flux variations as a function of various environment parameters. 253
254
Acknowledgments 255
This work has been conjointly supported by France's General Directorates DGA and DGE, 256
under convention #132906128 (EVEREST project). The authors would like to thank T. Saad 257
Saoud, A. Bchini, F. Derivaux and J. Beranger for their technical assistance during the 258
development of the spectrometer. 259
References 261
[1] S. Cecchini, M. Spurio, Atmospheric muons: Experimental aspects, Geosci. Instrum. 262
Methods Data Syst. 1 (2012) 185–196. 263
[2] P.K.F. Grieder, Cosmic Rays at Earth, Elsevier Press, Netherlands, 2001. 264
[3] O.C. Allkofer, H. Jokisch, A survey on the recent measurements of the absolute vertical 265
cosmic-ray muon flux at sea level, Nuovo Cim. A15 (1973) 371-389. 266
[4] B.C. Rastin, An accurate measurement of the sea-level muon spectrum within the range 267
4 to 3000 GeV/c, J. Phys. G: Nucl. Phys. (1984) 10 1609. 268
[5] J. Kremer, M. Boezio, M. L. Ambriola, G. Barbiellini, S. Bartalucci, R. Bellotti, D. 269
Bergström, U. Bravar, F. Cafagna, P. Carlson, M. Casolino, M. Castellano, F. Ciacio, M. 270
Circella, C. De Marzo, M. P. De Pascale, T. Francke, N. Finetti, R. L. Golden, C. 271
Grimani, M. Hof, W. Menn, J. W. Mitchell, A. Morselli, J. F. Ormes, P. Papini, S. 272
Piccardi, P. Picozza, M. Ricci, P. Schiavon, M. Simon, R. Sparvoli, P. Spillantini, S. A. 273
Stephens, S. J. Stochaj, R. E. Streitmatter, M. Suffert, A. Vacchi, N. Weber,N. Zampa, 274
Measurements of Ground-Level Muons at Two Geomagnetic Locations, Phys. Rev. Lett. 275
(1999) 83, 4241. 276
[6] V.A. Naumov, Atmospheric muons and neutrinos. Proceedings of the 2nd Workshop on 277
Methodical Aspects of Underwater/Ice Neutrino Telescopes, Hamburg, Germany, 278
(2001), 31-46. 279
[7] T. Gaisser, R. Engel, E. Resconi, Atmospheric muons and neutrinos. In Cosmic Rays 280
and Particle Physics (2016), pp. 126-148. Cambridge: Cambridge University Press. 281
[8] J.L. Autran, D. Munteanu, Soft Errors: From Particles to Circuits, Taylor & 282
Francis/CRC Press, 2015, p. 439. 283
[9] D. Munteanu and J.L. Autran, Modeling and Simulation of Single-Event Effects in 284
Digital Devices and ICs, IEEE Trans. Nucl. Sci., vol. 55, no. 4, pp. 1854-1878, 2008. 285
[10] J.L. Autran, D. Munteanu, P. Roche, G. Gasiot, S. Martinie, S. Uznanski, S. Sauze, S. 286
Semikh, E. Yakushev, S. Rozov, P. Loaiza, G. Warot, M. Zampaolo, Soft-errors 287
induced by terrestrial neutrons and natural alpha-particle emitters in advanced memory 288
circuits at ground level, Microelectron. Reliab. 50 (2010) 1822–1831. 289
[11] J.L. Leray, Effects of atmospheric neutrons on devices, at sea level and in avionics 290
embedded systems, Microelectron. Reliab. 47 (2007) 1827–1835. 291
[12] J.L. Autran, S. Serre, D. Munteanu, S. Martinie, S. Sauze, S. Uznanski, G. Gasiot, P. 292
Roche, Real-time soft-error testing of 40 nm SRAMs, in: 2012 Proceeding of the IEEE 293
International Reliability Physics Symposium, IRPS, 2012, pp. 3C.5.1–3C.5.9. 294
[13] S. Semikh, S. Serre, J.L. Autran, D. Munteanu, S. Sauze, E. Yakushev, S. Rozov, The 295
plateau de bure neutron monitor: Design, operation and Monte-Carlo simulation, IEEE 296
Trans. Nucl. Sci. 59 (2) (2012) 303–313. 297
[14] J.L. Autran, D. Munteanu, P. Roche, G. Gasiot, Real-time soft-error rate measurements: 298
A review, Microelectron. Reliab. 54 (2014) 1455–1476. 299
[15] B.D. Sierawski, M.H. Mendenhall, R.A. Reed, M.A. Clemens, R.A. Weller, R.D. 300
Schrimpf, E.W. Blackmore, M. Trinczek, B. Hitti, J.A. Pellish, R.C. Baumann, S.- J. 301
Wen, R. Wong, N. Tam, Muon-induced single event upsets in deep-submicron 302
technology, IEEE Trans. Nucl. Sci. 57 (6) (2010) 3273–3278. 303
[16] B.D. Sierawski, R.A. Reed, M.H. Mendenhall, R.A. Weller, R.D. Schrimpf, S.-J. Wen, 304
R. Wong, N. Tam, R.C. Baumann, Effects of scaling on muon-induced soft errors, in: 305
2011 Proceeding of the IEEE International Reliability Physics Symposium, IRPS, 2011. 306
[17] S. Serre, S. Semikh, J.L. Autran, D. Munteanu, G. Gasiot, P. Roche, Effects of Low 307
Conf. Radiation and its Effects on Components and Systems (RADECS), Biarritz, 309
France, Sept. 2012. Available online : 310
http://ms151u12.im2np.fr/news/articles/RADECS2012_Muons_Proceedings.pdf 311
[18] P. Roche, J.L. Autran, G. Gasiot, D. Munteanu, Technology downscaling worsening 312
radiation effects in bulk: SOI to the rescue, in: IEEE International Electron Device 313
Meeting, IEDM, 2013, pp. 766–769. 314
[19] J.L. Autran, D. Munteanu, T. Saad Saoud, S. Moindjie, Characterization of 315
Atmospheric Muons at Sea Level Using a Cosmic Ray Telescope, Nuclear Instruments 316
and Methods in Physics Research A, 903 (2018) 77-84. 317
[20]
http://www.eljentechnology.com/index.php/component/content/article/31-general/48-ej-318
200 319
[21] D.E. Groom, et al., At. Data Nucl. Data Tables 78 (2001) 183–356. 320
[22] J.F. Ziegler, J.P. Biersack, U. Littmark, The Stopping and Range of Ions in Matter, 321
Pergamon, New York, 1985. 322
[23] H.H.K. Tang, SEMM-2: A new generation of single-event-effect modeling tools, IBM J. 323
Res. Dev. 52 (2008) 233–244. 324
[24] J.D. Sullivan, Geometrical factor and directional response of single and multi-element 325
particle telescopes, Nucl. Instrum. Methods 95 (1971) 5–11. 326
[25] G.R. Thomas, D.M. Willis, Analytical derivation of the geometric factor of a particle 327
detector having circular or rectangular geometry, J. Phys. E 5 (3) (1971) 261–263. 328
[26] J. Kempa, A. Krawczynska, Low energy muons in the cosmic radiation, Nuclear 329
Physics B (Proc. Suppl.) 151 (2006) 299–302. 330