Behavior-Driven Optimization Techniques for Scalable
Data Exploration
by
Leilani Battle
B.S., University of Washington, Seattle (2011)
M.S., Massachusetts Institute of Technology (2013)
Submitted to the Department of
Electrical Engineering and Computer Science
in partial fulfillment of the requirements for the degree of
Doctor of Philosophy
at the
MASSACHUSETTS INSTITUTE OF TECHNOLOGY
June 2017
c
○ Massachusetts Institute of Technology 2017. All rights reserved.
Author . . . .
Department of
Electrical Engineering and Computer Science
May 19, 2017
Certified by . . . .
Michael Stonebraker
Adjunct Professor of Electrical Engineering and Computer Science
Thesis Supervisor
Accepted by . . . .
Leslie A. Kolodziejski
Professor of Electrical Engineering and Computer Science
Chair, Department Committee on Graduate Students
Behavior-Driven Optimization Techniques for Scalable Data
Exploration
by
Leilani Battle
Submitted to the Department of
Electrical Engineering and Computer Science on May 19, 2017, in partial fulfillment of the
requirements for the degree of Doctor of Philosophy
Abstract
Interactive visualizations are a popular medium used by scientists to explore, analyze and generally make sense of their data. However, with the overwhelming amounts of data that scientists collect from various instruments (e.g., telescopes, satellites, gene sequencers and field sensors), they need ways of efficiently transforming their data into interactive visualizations. Though a variety of visualization tools exist to help people make sense of their data, these tools often rely on database management systems (or DBMSs) for data processing and storage; and unfortunately, DBMSs fail to process the data fast enough to support a fluid, interactive visualization experience.
This thesis blends optimization techniques from databases and methodology from HCI and visualization in order to support interactive and iterative exploration of large datasets. Our main goal is to reduce latency in visualization systems, i.e., the time these systems spend responding to a user’s actions. We demonstrate through a comprehensive user study that latency has a clear (negative) effect on users’ high-level analysis strategies, which be-comes more pronounced as the latency is increased. Furthermore, we find that users are more susceptible to the effects of system latency when they have existing domain knowl-edge, a common scenario for data scientists. We then developed a visual exploration system called Sculpin that utilizes a suite of optimizations to reduce system latency. Sculpin learns user exploration patterns automatically, and exploits these patterns to pre-fetch data ahead of users as they explore. We then combine data-prefetching with incremental data process-ing (i.e., incremental materialization) and visualization-focused cachprocess-ing optimizations to further boost performance. With all three of these techniques (pre-fetching, caching, and pre-computation), Sculpin is able to: create visualizations 380% faster and respond to user interactions 88% faster than existing visualization systems, while also using less than one third of the space required by other systems to store materialized query results.
Thesis Supervisor: Michael Stonebraker
Acknowledgments
Of course, there have been many, many people who have supported me along this journey. I will do my best, but this is by no means the complete list.
First, I would like to thank my advisor, Mike Stonebraker, for constantly pushing me to do my very best as a researcher. I had several moments throughout my PhD where I was unsure whether I could do what was asked of me, but Mike reassured me and gave me the confidence I needed to keep going. I am grateful for the time and effort he has spent providing me with feedback and advice on anything and everything related to academia and research. Mike is amazing. I am also incredibly grateful for the space I have been given to try out my own ideas. Mike has always been patient in listening to my (often half-baked) ideas, and very helpful in turning some of these ideas into meaningful research projects. And thank you Mike for putting up with me running into your office at random times to give you an update, or to ask you (probably too many) questions. I look forward to moving on to the next stage of my research career with Mike as a mentor.
Second, I want to thank Remco Chang for his advice, support and unwavering enthusi-asm for this work. Remco has been a wonderful collaborator and mentor to me since my masters degree, and I have learned so much about visual analytics, human perception, and human-computer interaction from him. Both Remco and Mike were always there for me, and I really enjoyed the mix of expertise that the three of us brought to our joint projects. I sincerely hope that we can continue to collaborate in the years to come.
Many thanks to Sam Madden for giving me great advice every single year I was in graduate school, from applying to the NSF GRFP my first year, to figuring out where to do a postdoc in my last year. Seriously, thank you. I would like to thank David Karger for being on my RQE committee, and for being on my thesis committee. David has given me incredible feedback and advice that has made my research stronger and richer. Thank you to Danyel Fisher for taking on a database student with only a little bit of visualization experience as a summer intern. I learned a ton, had a blast, and I hope we can collaborate again soon. Also, many thanks to Danyel for helping me brainstorm the idea that ultimately became the second chapter of this thesis. Many thanks to Magda Balazinska and Bill Howe
for introducing me to database research while I was an undergrad at UW, for encouraging me to attend graduate school, and for continuing to support me throughout my PhD at MIT. James Frew was instrumental in designing and conducting the MODIS-based user stud-ies in my thesis, for which I am very grateful. Thank you to Alex Poliakov and Paul Brown for helping me with my SciDB issues, and to Paradigm4 for supporting my work with SciDB in general. And thank you to the huge number of people who have participated in my user studies. My work could not have been done without them!
Thank you to everyone in the MIT Database group for being incredibly supportive. I will miss our Tuesday lunches and fun conversations. And in particular, thank you to Jennie Rogers, Eugene Wu, Adam Marcus, Aaron Elmore, Aditya Parameswaran, Alekh Jindal, Manasi Vartak, Rebecca Taft, Gary Planthaber, Neha Narula, Holger Pirk and so many others for helping me along the way. Thank you Sheila Marian for helping me with logistics. I also want to thank VALT for how welcoming and supportive they have been over the years, particularly Jared Chandler, Eli Brown, Alvitta Ottley and Jordan Crouser.
I want to thank some of my closest friends for supporting me throughout my PhD: Rachael Harding, Cindy Sung, Andrew Jones, Kendall Nowocin, Hillary Eichler, and Ariel Lenning. I am a stronger and more well-rounded person because of each and every one of you. Thank you to the MIT offices, organizations and student groups that I have relied on throughout my PhD, including: the Black Graduate Student Association, the Academy of Courageous Minority Engineers, the Office of the Dean for Graduate Education, the EECS Graduate Student Association, the Graduate Women of Course 6, the Graduate Women’s Reading Group, My Sister’s Keeper, the Graduate Student Council, the CSAIL Student Committee, the CSAIL Games Night group, Floorpi and the East Campus house team, the EECS Graduate Office, and Community Wellness.
My mother and father have been my anchors, my rocks. They have shown me what it truly means to be resilient. My younger sister and brother have always been there to laugh and cry with me. Thank you to my grandparents for helping to raise me and my siblings. I love my family with all my heart, and I cannot thank them enough.
Last but not least, thank you to my wonderful husband Ray for his love and support. We have been through so much together, and I am truly grateful to have him by my side.
Contents
1 Introduction 19
1.1 Context . . . 19
1.2 Contributions . . . 21
1.2.1 Measuring the Effects of System Latency . . . 22
1.2.2 Reducing the Effects of System Latency . . . 23
2 The Effects of Latency on Visual Search Strategies for Different Analysis Tasks 25 2.1 Introduction . . . 25
2.2 Literature Review: Analysis Scenarios . . . 27
2.2.1 Novice analysis . . . 28
2.2.2 Analysis under time pressure . . . 28
2.2.3 Expert analysis . . . 28
2.2.4 Decision Making under Uncertainty . . . 30
2.2.5 Opportunistic analysis . . . 31 2.2.6 Analysis at scale . . . 31 2.2.7 Summary . . . 31 2.3 Experiment . . . 32 2.3.1 Hypotheses . . . 32 2.3.2 Participants . . . 33 2.3.3 Experiment Setup . . . 33
2.4 Experimental Conditions and Results . . . 38
2.4.1 Novice Search . . . 39
2.4.3 Analysis by a Technical Expert . . . 41
2.4.4 Analysis by a Domain Expert with Exact Information . . . 42
2.4.5 Analysis with Incomplete Domain Knowledge . . . 43
2.4.6 Analysis with Tacit Domain Knowledge . . . 44
2.4.7 Opportunistic Search and Analysis . . . 45
2.4.8 Analysis of Large Amounts of Data . . . 47
2.4.9 Summary of Results . . . 48
2.5 Statistical Analysis . . . 49
2.6 Analysis of Interaction Trails . . . 51
2.6.1 Strategies Across Conditions . . . 52
2.6.2 Latency and Switching Strategies . . . 53
2.7 Discussion . . . 55
2.7.1 Comparing with Real-World Domain Experience . . . 55
2.7.2 Effects of Delay Length on Performance . . . 56
2.7.3 Effects of Explicit Knowledge of Latency . . . 58
2.8 Summary . . . 59
3 The Sculpin System 61 3.1 Introduction . . . 61
3.1.1 Sculpin . . . 63
3.2 Data Model . . . 64
3.2.1 Datasets Supported by Sculpin . . . 64
3.2.2 Interactions Supported by Sculpin . . . 66
3.2.3 Building Data Tiles . . . 66
3.3 Architecture . . . 69
3.4 Front-End Interface Design . . . 71
3.4.1 Vis Manager . . . 71
3.4.2 Tile Request Manager . . . 72
4 Dynamic Prefetching of Data Tiles in Sculpin 73
4.1 Introduction . . . 73
4.1.1 Background . . . 77
4.2 2D Predictor Design . . . 78
4.2.1 Managing Interaction Data . . . 79
4.2.2 Prediction Formalization . . . 79
4.2.3 Top-Level Design . . . 80
4.2.4 Bottom-Level Design . . . 83
4.2.5 Cache Allocation Strategies . . . 88
4.3 Prediction Framework Design . . . 89
4.3.1 Formalization . . . 91
4.3.2 Multidimensional Data Tile Prediction . . . 91
4.4 Experiments: Evaluating the 2D Predictor . . . 93
4.4.1 MODIS Dataset . . . 94
4.4.2 Experimental Setup . . . 96
4.4.3 User Study . . . 98
4.4.4 Evaluating the 2D Predictor . . . 103
4.4.5 Latency . . . 106
4.5 Summary . . . 108
5 Efficient Pre-Computation and Caching of Data Tiles in Sculpin 109 5.1 Introduction . . . 109
5.2 Tile Builder . . . 111
5.2.1 Building Tiles Offline . . . 111
5.2.2 Building Tiles Online . . . 113
5.3 Caching Optimizations . . . 113
5.3.1 Cache Replacement Policies . . . 114
5.3.2 Cache Coordination Protocols . . . 115
5.4 Experiments . . . 115
5.4.2 User Study . . . 117
5.4.3 Experimental Setup . . . 119
5.4.4 Tile Builder Evaluation . . . 122
5.4.5 Caching Evaluation . . . 125
5.4.6 Impact of Client-Side Caching . . . 128
5.4.7 Prediction Framework Evaluation . . . 128
5.4.8 End-to-End System Evaluation . . . 129
5.5 Summary . . . 130
6 Related Work 133 6.1 Latency Analysis for Visual Exploration Systems . . . 133
6.1.1 Psychology of Searching . . . 133
6.1.2 Latency in VIS and HCI . . . 134
6.1.3 Influencing a User’s Analysis Behavior . . . 134
6.2 Data Resolution Reduction . . . 135
6.2.1 Aggregation . . . 135
6.2.2 Sampling . . . 136
6.3 Analysis of User Interactions . . . 138
6.3.1 Interaction Log Analysis . . . 138
6.3.2 Pre-fetching and Prediction . . . 139
6.3.3 Sensemaking Models . . . 139
6.4 Multidimensional Visualization Exploration . . . 140
7 Future Work 141 7.1 Making Visual Exploration More Effective . . . 141
7.1.1 Supporting more interaction types . . . 141
7.1.2 Supporting more dataset types . . . 142
7.1.3 Finer-grained tile building . . . 142
7.1.4 More Perceptual Measures . . . 143
7.2 Making Visual Exploration More Relevant . . . 144
7.2.2 Automated Recommendations for Data Analysis . . . 144 7.2.3 Collaborative Data Analysis Systems . . . 145
8 Conclusions 147
List of Figures
1-1 Typical architecture for an exploratory browsing system. . . 20
2-1 A snapshot of the user study interface. Participants can pan within the viewport window using the mouse. . . 34 2-2 A diagram representing a participant’s starting position (red circle), and the
positions of the low latency target (gold star) and the high latency target (black star). . . 36 2-3 Proportion of participants who found the low-latency target first for each
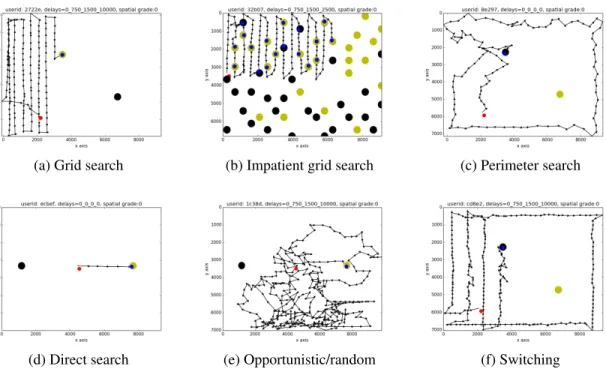
experimental condition and latency case. . . 36 2-4 Examples of the five types of search strategies identified through the
in-teraction trails: grid search, impatient grid search, perimeter search, direct search, and opportunistic/random search. Figure 2-4f is an example of how participants apply multiple strategies. . . 51 2-5 Distribution of search strategies across conditions. . . 52 2-6 Distribution of strategy switches across conditions. Each row has a pair of
strategies “A-B”, where A is the initial strategy that was used (e.g., grid search), and B is the final strategy that was used. For example, the third row represents a count of participants that started the task using grid search, and then switched to a perimeter search. “Other” refers to a strategy that is neither grid search nor perimeter search (e.g., direct search). . . 54
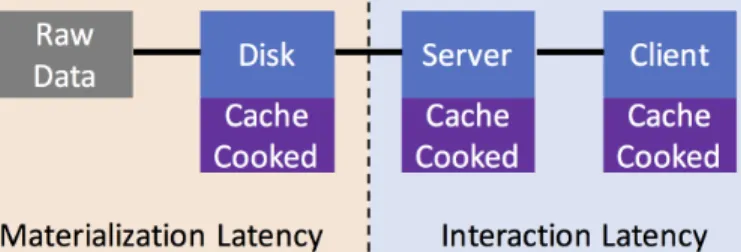
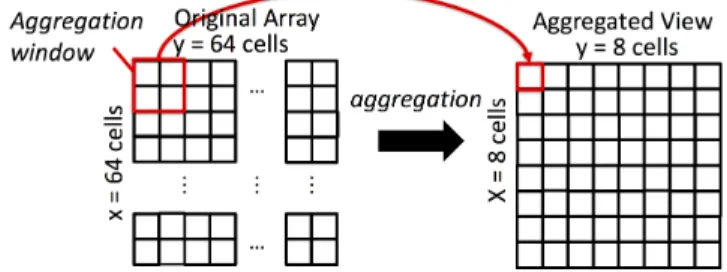
3-1 Storage layout for caching materialized query results (or “cooked” data), from left to right (raw input data is considered separately): 1) server disk, 2) server main memory, and 3) client main memory. To reduce interaction latency, existing systems only cache query results on the client [17, 63, 60, 76]. None of these systems consider materialization latency. . . 63 3-2 Potential tiling schemes for three types of data. . . 65 3-3 A 16x16 array being aggregated down to an 8x8 array with aggregation
parameters (2, 2). Every 4 cells in the input array (i.e., the red box on the left) becomes a single cell in the aggregated results (i.e., the red box on the right). . . 67 3-4 A zoom level being partitioned into four tiles, with tiling parameters (4, 4). 67 3-5 A diagram of the Sculpin architecture. . . 69 3-6 A snapshot of a Sculpin coordinated view visualization. . . 71
4-1 A diagram of Sculpin’s tile storage scheme. . . 74 4-2 Example ROI’s in the US and Canada for snow cover data. Snow is orange
to yellow, snow-free areas in green to blue. Note that (a) and (b) span the same latitude-longitude range. . . 86 4-3 User study browsing interface. . . 98 4-4 Distribution of moves (a) and phases (b), averaged across users, partitioned
by task; distribution of moves computed for each user for Task 1 (c), Task 2 (d), and Task 3 (e); each user’s distribution of moves is represented as a single column. In Figures (c), (d), and (e): panning is red, zooming in is green, and zooming out is blue; users with similar move distributions are grouped together. . . 101 4-5 Change in zoom level per request as study participant 2 completed task 2. . 102 4-6 Accuracy of our AB model, SB model, and final predictor (i.e., hybrid model).103 4-7 Accuracy of the hybrid model compared to existing techniques. . . 106
4-8 Plot of average response time given prefetch accuracy, for all models and fetch sizes (linear regression: Adj R2=0.99985, Intercept=961.33, Slope=-939.08, P=1.1704e-242. . . 106 4-9 Average prefetching response times for hybrid model and existing techniques.108 5-1 Response time results divided by task, and averaged across all users. The
cost of building tiles is varied across four different cases listed in Sec-tion 5.4.3. The dotted line is our target response time (500ms). . . 122 5-2 Average response time results for the Ocean Blooms task, when caching
4-128 tiles in Sculpin, calculated separately for each cache replacement strategy. Similar results were observed for all three tasks. . . 126 5-3 Average response time results for all 3 tasks, when caching 4-128 tiles in
Sculpin, using the Navigation cache replacement policy. . . 127 5-4 Average response time results for each tile building case (0.25, 0.5, 1.0 and
1.5 seconds), and each dataset, when both the tile building and caching optimizations are enabled in Sculpin. The vertical dashed line represents Sculpin’s default build threshold of 1 second. The horizontal dashed line represents the interactivity threshold of 500ms. . . 127
List of Tables
4.1 Input features for our SVM phase classifier, computed from traces from our user study (see Section 4.4 for more details). . . 81 4.2 Features computed over individual array attributes in Sculpin to compare
data tiles for visual similarity. . . 86
5.1 Four separate cases (0.25, 0.5, 1.0, and 1.5 seconds) for the average time to build a single tile at the cheapest zoom level (bottom row, in bold). Each case defines average tile cost for every zoom level in the datasets. The zoom levels with tile costs lower than 1 second are highlighted in yellow for each case. The last column shows the total number of tiles on each zoom level. These numbers are for the NDSI and Hurricane tasks. . . 120 5.2 Four separate cases (0.25, 0.5, 1.0, and 1.5 seconds) for the average time to
build a single tile at the cheapest zoom level (bottom row, in bold). Each case defines average tile cost for every zoom level in the datasets. The zoom levels with tile costs lower than 1 second are highlighted in yellow for each case. The last column shows the total number of tiles on each zoom level. These numbers are for the Ocean Blooms task. . . 120 5.3 The fraction of time spent building tiles offline, recorded for each task and
each of the four tile building cases described in Section 5.4.3. . . 123 5.4 The fraction of tiles built offline by the Tile Builder, recorded for each task
5.5 Average response time (in seconds), with pre-fetching, tile building and caching enabled. The client-side cache was either turned on (with size 32 tiles), or turned off. Two separate clients were tested: a laptop connected to a public wireless network, and the server running Sculpin. . . 128
Chapter 1
Introduction
1.1
Context
The physical and biological sciences are becoming more data driven, often due to over-whelming quantities of data collected from satellites, telescopes, sequencers, and other sensors. In many discussions with scientists across a variety of specialties, we have found that interactive visualizations are important tools for helping people make sense of massive amounts of data. In particular, interactive visualizations are critical in the early stages of data analysis, when a scientist is browsing a new dataset.
In this thesis, we focus on the specific case of exploratory browsing, where the user explores her data at multiple levels of granularity, or zoom levels, through a pan-zoom interface. We have found that scientists exhibit a specific search pattern during the ex-ploratory browsing process. They start by exploring at coarse-grained zoom levels, looking for regions of interest to analyze. When they find something interesting, they zoom into this particular region, and analyze it in more detail. After thoroughly exploring a particular region, they then zoom out and repeat this process with new regions of interest.
One common approach to addressing the issue of scalability (i.e., of visualizing larger datasets) is by designing or augmenting visualization tools so they can connect directly to a remote database management system (or DBMS). DBMSs are designed specifically to support efficient data processing at scale. In this way, the visualization tool can leave the task of processing the data to the DBMS by translating the user’s analyses into DBMS
Figure 1-1: Typical architecture for an exploratory browsing system.
queries, and instead focus on efficiently rendering the query results from the DBMS. An example of the architecture for a basic exploratory browsing system is provided in Figure 1-1. The user interacts with a visualization tool running on a client machine (i.e., the user’s laptop, on the right side of Figure 1-1), and the client is connected to a DBMS running on a remote server (left side of Figure 1-1).
At the beginning of the exploratory browsing process, the user inputs a complex query that she wants to execute and then visualize. For example, the query at the top of Fig-ure 1-1 is applying a snow cover calculation to raw satellite imagery data collected from the NASA Moderate Resolution Spectroradiometer (or MODIS). This calculation is called the Normalized Difference Snow Index, or NDSI, because it computes the normalized dif-ference between two separate wavelengths of light: visible red light (represented as b4 in Figure 1-1), and near-infrared light (represented as b6 in Figure 1-1). The last line of the query filters the snow cover results, such that only high NDSI values are returned. The client-side visualization tool then sends the user’s query to the DBMS to be prepared for visualization, which includes executing the query in the DBMS. We also refer to this data preparation step as creating a visualization of the user’s query. After the user’s query has been prepared for visualization, the user can then interact with a pan-zoom interface on the client to explore the rendered results. As the user interacts with the client-side interface, the visualization tool sends requests to the DBMS to retrieve the corresponding query results needed to update the current visualization.
Unfortunately, DBMSs fail to process the data fast enough to support a fluid, interactive visualization experience. This is because DBMS are not designed to provide query results
at interactive speeds [48, 10]. Specifically, many of the operations involved in complex an-alytics (e.g., linear algebra operations) involve processing most if not all of the underlying input data. As such, complex analytical queries are nearly impossible for the DBMS to ex-ecute at interactive speeds when applied to massive datasets [96]. Since many visualization systems rely on DBMSs to scale up to larger datasets, their data processing speeds (and thus their overall performance) are severely limited as a result. Therefore a central theme of this thesis is to make visual exploration of massive datasets interactive, where we aim to have the system respond to user interactions (e.g., pans and zooms) within 500ms.
1.2
Contributions
The main challenge in supporting interactivity lies in how visualization tools and DBMSs interact. Specifically, the DBMS is oblivious to useful contextual information collected by the visualization tool, and thus misses key opportunities for developing powerful per-formance optimizations to reduce system latency. By ignoring how people interact with visualizations, the DBMS loses valuable information about consistent interaction patterns and behaviors that can be exploited to adapt its optimization strategies. We show that by analyzing the design of the visualization interface and the user’s interactions with this interface, along with applying various database optimizations that exploit this contextual information, we are able to achieve significantly better performance.
We developed a modular layer of software that acts as an intermediary between the vi-sualization tool and the DBMS. Within this intermediate layer, we gain access to the user’s interaction history, collected through existing visualization tools. We use this interaction data to develop models of user behavior, and then apply these models to develop context-aware (or visualization-context-aware) database optimization techniques within our intermediate layer. Within this software layer, we designed and implemented three key optimization techniques: 1) prediction techniques to anticipate the user’s future interactions and pre-fetch the corresponding data ahead of time; 2) incremental data processing techniques to ensure that we only visualize the parts of the dataset that the user will ultimately explore; and 3) new caching techniques to maximize utilization of available cache space across both
the client and the server. In this way, we provide a re-usable software design that can be applied to a variety of visualization tools and database management systems, while still providing significant performance benefits.
When compared with existing systems, we can create visualizations from the user’s query in a quarter of the time using incremental data processing; we can respond to user interactions (e.g., pans and zooms) with this visualization in roughly half the time using smarter caching techniques and predictive pre-fetching; and we only use a quarter of the disk space required by other exploratory browsing systems to materialize the query results needed to produce visualizations (also through incremental data processing).
In the remainder of this section, we outline the major contributions of this thesis, which we divide into two parts: 1) we study how latency affects users’ high level search strategies when exploring data using in pan-zoom interface (Chapter 2); and 2) we present our new visualization system Sculpin (Chapter 3), and discuss three major techniques implemented in Sculpin to reduce system latency (predictive pre-fetching (Chapter 4), visualization-aware caching (Chapter 5), and incremental data processing (Chapter 5)).
1.2.1
Measuring the Effects of System Latency
In order to effectively minimize the effects of system latency, we must first understand how latency actually influences the user as she visually explores her data. To do this, we con-ducted a comprehensive user study, where we had over 800 participants explore a collage of images using a tile-based visualization interface, similar to Google Maps. We explain our user study and our results in detail in Chapter 2. In this study, users completed search tasks under various latency and analysis conditions. Our results show that when latency is introduced in the interface, users change their search strategies and even ignore regions of the dataset that are too “costly” (or slow) to explore. Furthermore, we observed that latency had a noticeable effect on participants in only certain analysis contexts, the most significant being when the user already has domain knowledge that can help them better navigate the underlying dataset. This particular analysis context represents a well-known scenario in the real world, where data scientists are analyzing and exploring a dataset.
1.2.2
Reducing the Effects of System Latency
We then focus our attention on developing optimization techniques to reduce overall system latency, and thus reduce the negative impact of latency on exploration tasks. To do this, we developed Sculpin, a general-purpose tool for exploratory browsing of large datasets. Sculpin utilizes a client-server architecture, where the user interacts with a lightweight client-side interface to browse datasets, and the data to be browsed is retrieved from a DBMS running on a back-end server. We assume a detail-on-demand browsing paradigm, and optimize the back-end support for this paradigm by inserting a separate middleware layer in front of the DBMS. We discuss the Sculpin architecture in detail in Chapter 3. Within Sculpin’s middleware layer, we have implemented three optimization techniques:
1. To make individual interactions (i.e., pans and zooms) fast, the middleware layer predicts the user’s future interactions and fetches the corresponding data ahead of the user as she explores a dataset. We consider two different mechanisms for prefetch-ing: (a) learning what to fetch from the user’s recent movements, and (b) using data characteristics (e.g., histograms) to find data similar to what the user has viewed in the past. We incorporate these mechanisms into a single prediction engine that ad-justs its prediction strategies over time, based on changes in the user’s behavior. We discuss our prediction techniques in Chapter 4.
2. With more information about the user’s exploration behavior, we can also develop specialized caching strategies to further improve performance. For example, we can augment existing cache replacement policies (e.g., a least-recently used policy) to take into account information about the user’s recent interactions (e.g., evict tiles cor-responding to unlikely interaction sequences). We developed a suite of visualization-aware caching strategies to efficiently manage materialized query results from the DBMS. We discuss our caching techniques in Chapter 5.
3. Last, we aim to reduce the latency incurred when preparing the user’s query for vi-sualization, which is dominated by the time required to execute this query in the DBMS. We can simultaneously reduce both system latency and disk space consump-tion by applying incremental query execuconsump-tion strategies to avoid processing the parts
of the user’s DBMS query that will never be explored. We discuss our incremental data processing techniques in Chapter 5.
Even though Sculpin includes three different optimization techniques to improve per-formance, our prediction techniques act as an anchor to support all of these optimizations. As such, we evaluated Sculpin through two separate user studies: 1) one study to assess the viability of prediction as a suitable optimization technique for visualization use cases (Chapter 4); and 2) a follow-up study to evaluate the performance of all of the optimization techniques used in Sculpin (Chapter 5). To ensure that our user studies were a close ap-proximation real-world use cases, we recruited scientists directly for both studies, and all of our participants explored several real-world datasets as part of these studies.
In the first study, we found that our dynamic prefetching strategy provides: (1) signifi-cant improvements in overall latency when compared with non-prefetching systems (430% improvement); and (2) substantial improvements in both prediction accuracy (25% im-provement) and latency (88% imim-provement) relative to existing prefetching techniques.
In the second study, we evaluated all three of our techniques. With our incremental pre-computation techniques, we found that Sculpin was able to provide significant im-provements in both the materialization latency (380% improvement), and disk space used to store data tiles (370%). Furthermore, we found that our cache-optimization techniques provided an additional 200ms (or 60%) reduction in response times, when used in conjunc-tion with our other techniques. When these optimizaconjunc-tions are combined, Sculpin provides a 370% improvement over existing systems, while also supporting interactive exploration of multidimensional data (average response time of 490ms or less).
Chapter 2
The Effects of Latency on Visual Search
Strategies for Different Analysis Tasks
2.1
Introduction
A central tenet of designing interactive visualization systems is to make the system respon-sive – that is, to reduce or remove latency in a system’s response to the user’s interactions. Because interactions in a visualization system have been thought to be an externalization of a user’s analysis process [79], disruption to the process due to system latency can sig-nificantly impact the user’s ability to maintain “cognitive flow” [24, 36, 84, 18], thereby reducing their analysis capabilities. In a recent paper by Liu and Heer, the authors find that latency beyond 500ms can make a visualization appear unresponsive to the point of being unusable by the users [62].
However, while there is a common belief that latency in visualization tools is disruptive, there have been conflicting reports of the effects of latency in other domains. For example, introducing latency can decrease the user’s performance in interaction tasks [65, 101], re-duce a user’s sense of presence in a virtual environment [67], and affect a user’s behavior with a computer system [62, 6]. On the other hand, Claypool found no effect of latency on a player’s performance in real-time strategy (RTS) games [22, 89]. Similarly, Meehan et al. found that while latency has an effect on a user’s search behavior on the web, the effect is only observed when the latency is above a certain threshold (e.g., 1000ms) [6]. These
anecdotal but contradictory findings suggest that the effect of latency can depend on the user’s task, the context, and the amount of latency.
While Liu and Heer have established that in using the brushing and linking technique in a visualization requires latency of less than 500 milliseconds [62], little is known about how latency can influence a user’s higher-level analysis goals. In this chapter, we explore the effects of latency on visual search strategies for a range of analysis tasks. Complementary to prior work, which focuses on the effect of latency on low-level interactions, our goal is to examine how latency can affect a user’s strategies in different analysis tasks and scenarios. Our hypothesis is that the effects of latency on user behavior will be different depending on the analytic scenarios. As such, a major contribution of this chapter is to identify the analysis scenarios where system latency has a clear effect on user behavior, and to define the nature of these behavioral shifts.
To validate our hypothesis, we first conducted a literature survey and compiled a list of 8 common analysis scenarios. From these analysis scenarios, we conducted an 8 (analysis scenario) x 5 (amount of latency) factorial design experiment to evaluate how latency af-fects a user’s analysis strategy. Using a Google Maps-like interface, participants conducted visual search tasks where they were instructed to locate two specific “target images” in a collage of distracting images (see Figure 2-1). In this collage, the distractor (non-target) images can be slow to appear—that is, there is a controlled latency to rendering these im-ages. In our experiment, we systematically control the amount of latency of these distractor images, and observe whether increasing the latency can cause a user to avoid the high la-tency (i.e., slow rendering) regions of the collage while seeking the target images.
Our results show that, as expected, latency causes the users to avoid regions of the col-lage that are slow to render. Furthermore, we find that the effect of latency is not universal across all analysis scenarios. In some cases, latency can significantly alter the user’s be-havior; but in other cases, the effect is less noticeable. These findings support our original hypothesis. In addition, we analyzed the users’ analysis search paths under the different analysis scenarios and latency conditions. We found five unique analysis strategies that were utilized by participants, as well as clear differences in which strategies were chosen for different analysis tasks and different latencies observed in the interface. These results
together indicate that latency in a system can significantly alter a user’s search behavior. Furthermore, the user’s experience level (novice vs. expert) and the nature of her expertise (domain knowledge vs. interface and task knowledge) can alter the degree to which system latency will have an effect. These results indicate that a specific class of users are likely to be more susceptible to the effects of system latency in visualization tools: domain ex-perts, such as data analysts and data scientists. Therefore, new optimization techniques are needed for visualization tools, to mitigate or reduce the effects of system latency for this class of expert users.
In summary, this chapter makes three primary contributions:
1. Grounded in a literature review of various analytical domains, we provide a descrip-tion of 8 high-level analysis scenarios.
2. We describe the results of a comprehensive experiment that demonstrates the effects latency across these scenarios.
3. Our results show that system latency has a clear effect on user’s search behavior, and this effect becomes more pronounced as latency is increased. Furthermore, we show that users with domain knowledge are more likely to be affected by latency, a common scenario for expert users such as analysts and data scientists.
This chapter is outlined as follows. In Section 2.2, we discuss our literature review, which describes 8 different types of analysis tasks. In Section 2.3, we provide the details for our 8 x 5 factorial experiment, and we present experimental results per analysis task in Section 2.4. We present results from a global statistical analysis of the experimental results in Section 2.5, a global analysis of interaction trails in Section 2.6, and a discussion of our results in Section 2.7. We summarize the outcomes for this chapter in Section 2.8.
2.2
Literature Review: Analysis Scenarios
In order to evaluate the effects of latency on various analytical tasks, we first conducted a literature review to identify canonical analytical scenarios. We began with seminal work in intelligence analysis by Heuer [42] and from there we branched to relevant works across psychology, HCI, and VIS. Below we present a sample of 8 high-level analytical scenarios
along with real-world examples.
2.2.1
Novice analysis
As a baseline condition, we first consider a scenario in which an analyst has little knowl-edge of either the task or the domain. Early work in understanding cognitive models of analysis identified that novice analysts tend to exhibit an initial problem-scoping phase, followed by more detailed reasoning [95]. This work led to the hypothesis that poor perfor-mance by novice analysts could be ascribed to failure to scope the problem, poor formation of a conceptual model of the problem domain, or insufficient testing of hypotheses [95]. By developing a better understanding of novice problem-solving behavior under various constraints, we may be able to identify specific error-prone behaviors that may limit the novice’s ability [87], and in turn help novice analysts to avoid these behaviors by providing better tools for conceptualizing and exploring the problem domain [12].
2.2.2
Analysis under time pressure
While a leisurely and substantial orientation phase may enable a novice analyst to develop a thorough understanding of the problem, in real analytical environments one rarely has the luxury of unlimited time. If pressured to make a decision quickly, it has been observed that people tend to lock in on a single strategy and demonstrate decreased ability to effectively evaluate alternative strategies [31]. Moreover, time constraints can cause people to revert to a known strategy, even if these same people employ a more logical strategy when the time constraint is removed [74]. We’ve learned that time pressure also has a predictable effect on decision time in a visual search task. Specifically, the degree of urgency appears to influence the threshold at which a detected signal triggers a response [82]. We incorporate time constraints as a separate analysis scenario in our study.
2.2.3
Expert analysis
Though there are many systems designed to support analysis by novices, it is frequently the case that the analyst brings with her some form of expertise. Making an important
distinction in the context of negotiation, Professor Margaret Neale of Stanford noted that "experience is feedback, expertise is strategic conceptualization" [70]. This strategic con-ceptualization may be further broken down into technical expertise and domain-specific background knowledge [68], and it has been observed that the influence of these two types of expertise on search tasks is not identical [43]. We incorporate one analysis scenario for the technical expertise case, and one scenario for the domain expertise case in our study.
Technical expertise
Technical expertise and competencies related to the task (rather than to a specific domain) are employed in many analytical contexts. For example, a canine unit trained to detect trace amounts of explosives is an effective partner in disrupting terrorist activities [34], despite the fact that the dog has no understanding of the complex sociopolitical implications of his task. In search tasks conducted by humans, facility with technical tools results in measurable differences in query complexity, target selection, post-query browsing, and the ultimate success rate relative to those with less advanced technical skills [105], regardless of the familiarity with the domain.
Domain expertise
Domain expertise stems from a deep, sometimes tacit understanding of a specific topic or discipline. It has been observed that domain experts search differently than people with limited domain knowledge [104]. Specifically, this kind of expertise has been observed to have a “honing” effect on search behavior: those with greater familiarity with a topic are more efficient in seeking out relevant information [49] and have higher rates of success in finding what they are looking for than non-experts. In studies of visual search in the con-text of chess masters, there is strong evidence that it is a perceptual encoding advantage stemming from their intimate knowledge of the domain, rather than a general perceptual or memory superiority, that enables their superior performance[83]. This perceptual ad-vantage manifests through an increased sensitivity to semantic changes in images within their domain of expertise[103]. It does not, however, mitigate the effects of inattentional blindness [29].
2.2.4
Decision Making under Uncertainty
In many real-world analytical scenarios, particularly those involving streaming data, an an-alyst must move forward with their analysis despite uncertainty in their current knowledge of the domain. Of particular interest is the observation that decision-makers distinguish be-tween three types of uncertainty [61]: inadequate understanding (i.e. making an incorrect assumption), incomplete information (i.e. having a rough idea but not exact knowledge), and undifferentiated alternatives (i.e. having a clear understanding of multiple paths, but lacking a mechanism for determining which leads to pursue). The first case (inadequate understanding) is outside of the control of our study, so we do not elaborate on it here. We have incorporated the other two cases (incomplete information and undifferentiated alternatives) as separate analysis scenarios within our study.
Analysis with incomplete information
Missing information is unavoidable in nearly all real-world analytic environments. In the context of evaluating consumer products, it has been shown that many people have a ten-dency to over-value categories of information that are present across all data points, intrin-sically presuming the worst in missing values [52]. A similar effect has been observed in participants asked to evaluate applicants for a hypothetical scholarship [54]. When avoid-ing or ignoravoid-ing missavoid-ing information fails, individual differences in methods for copavoid-ing with missing information as well as the assumptions people make in trying to fill in the gaps can have a significant impact on accuracy [30].
Analysis with undifferentiated alternatives
Having multiple valid, equally-plausible courses of action is perhaps one of the most ubiq-uitous and frustrating manifestations of uncertainty. Experts must painstakingly weigh the potential outcomes of regulatory and public policy decisions [11, 55], and laypersons may experience similar tension in more personal decisions such as which house to buy [66] or which course of cancer treatment to pursue [38]. In each of these cases, the absence of a clear winner impels the decision-maker to find a useful heuristic, or otherwise to simply
guess.
2.2.5
Opportunistic analysis
In some scenarios, the analyst is presented with a plurality of potential targets rather than only a few. For example, consider the use of mobile dating applications such as Tindr [45]. When many viable opportunities present themselves simultaneously, an analyst may oppor-tunistically “hop” from target to target, resulting in identifying nearby, potentially related targets before branching out and exploring more distant regions of the dataset. We represent this case as a unique analysis scenario in our study.
2.2.6
Analysis at scale
Of particular interest in many current applications in data science are the analytical strate-gies employed in the context of big data [13]. When faced with a large amount of data, an analyst may not have the time to examine all the data but will need to focus on spe-cific areas. As a result, their information seeking behavior can be substantially different. Therefore, we include analysis at scale as a separate analysis scenario in our study.
2.2.7
Summary
In this section, we identified 8 different analysis scenarios that people commonly encounter in the real world. These scenarios can be grouped by the user’s expertise: analysis by novice users; analysis by users with technical (i.e., task or interface) expertise; and analysis by users with domain (i.e., data) expertise. In the novice case, we described three scenar-ios: a novice exploring a new dataset (i.e., our base condition); a novice exploring under time pressure; and a novice exploring a large-scale dataset. We describe one scenario for technical expertise, where the user has knowledge of the search interface. We then discuss four cases of domain expertise: complete domain knowledge (i.e., perfect information), incomplete domain knowledge, undifferentiated alternatives (i.e., domain knowledge with uncertainty), and opportunistic knowledge (i.e., knowledge gained directly through data exploration). Each scenario was selected based on how users’ perceptions of the dataset
and task may differ from the novice case. In the next section, we describe our experimen-tal design, and how we measure differences in user behavior for each of these different analysis scenarios.
2.3
Experiment
We know that latency can impact users’ experiences with visual analytics tools. At the interaction level, users notice and even avoid specific interactions with high latency (e.g., brushing and linking with 500 milliseconds of latency introduced [62]). However, little work has been done to evaluate how latency may affect a user’s decisions throughout her entire analysis session. Specifically, we seek to better understand how latency impacts the user’s choice of search strategy, or how she decides to navigate her dataset. However, given that the effects of latency can vary widely based on the context of the analysis task, one must study these effects within different contexts. Thus the goal of this study is to evaluate how latency in visualization systems may impact a user’s high-level search strategies across different types of data analysis tasks.
2.3.1
Hypotheses
In our study, users explore data in a tile-based format, where the data will be partitioned into fixed-width tiles, similar to interfaces such as Google Maps. We frame our hypotheses in the context of data regions, where a data region is a consecutive block of tiles: some data regions will have tiles with high latency (i.e., will take several seconds to appear in the visualization), and some regions will have low latency tiles (i.e., will appear almost immediately).
Our hypotheses for this study are two-fold. First, we hypothesize that users prefer to search through low-latency data regions over high-latency ones when latency is in-troduced in the system, and have no preference when there is no latency. Second, we hypothesize that the minimum latency threshold for which users will shift their behav-ior will be different for analysis tasks where the user has expert information and where the user has no information (i.e., a novice user).
2.3.2
Participants
We ran our experiments using Amazon Mechanical Turk. 858 people participated, and across all experiments 692 successfully completed the main task. Workers were paid up to $2.27 for completing the study.
2.3.3
Experiment Setup
Our experiments were run using a between-subjects design. Each experiment had five groups of roughly 20 participants, one per latency condition tested: 0, 2.5, 7, 10, and 14 seconds (all experiments evaluate using the same set of latency values). Each participant completed their assigned experiment exactly once with the given delay condition. They also provided consent through a digital consent form, completed a demographics questionnaire, read the instructions for an image-based search task, completed said search task using a browser-based visual exploration tool, and filled out a feedback survey about the task.
Workers were warned that anyone who went through the task too quickly (i.e., ignored the instructions) or too slowly (i.e., took a long break during the task) would have their sub-mission rejected, allowing us to filter out “Bad” datapoints. Furthermore, only participants who successfully completed the task were considered in our evaluation.1
Visual Search Task
All of our experiments require participants to complete a visual search task: to explore a grid of bird images (hereafter denoted a collage), and to locate one or more target images within this collage that stand out from the rest. In this section, we explain how we designed each collage, and how we created and inserted target images.
Layout: For all but one of our experiments, we created each collage as a grid of 20 images by 20 images (400 total unique images), where each image was 500 pixels by 350 pixels in size. The last experiment used a 200 by 200 grid of images (40,000 total images, where
1In the case of the large-scale exploration experiment, all results were reviewed manually to ensure that
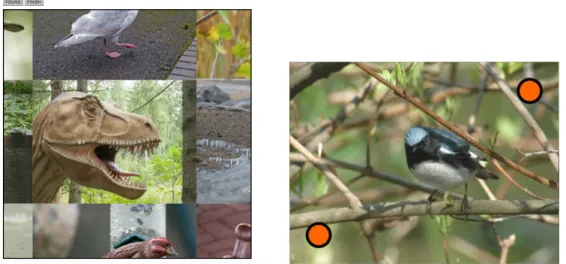
(a) The target image (a dinosaur) is featured in the center of the viewport.
(b) Annotated target image used in the Oppor-tunistic search condition.
Figure 2-1: A snapshot of the user study interface. Participants can pan within the viewport window using the mouse.
duplicates are allowed). Each grid consists of a randomized sample from a collection of 1082 bird images. A separate sample of images was selected for each participant. The grid layout is created before the participant starts the task. The exact layout and images used for each experiment and participant were recorded. We refer to each image within the grid as a tile.
Target Images: Each experiment includes two or more “target” images that are inserted into the collage. We created two kinds of target images. One set of targets utilizes mul-tiple copies of an image that is completely different from the rest of the collage: a shot of a brown T-Rex dinosaur standing in a forest (shown in the center of Figure 2-1a). The other kind of target images are augmented bird images that are already within the collage. These target bird images were made to stand out from other images in the collage by adding colorful circles to the corners of the images (example shown in Figure 2-1b) .
Interface
The study was run using a browser-based visual exploration interface. The main component of the interface is a 700 pixel by 700 pixel viewport (see Figure 2-1a), which shows only a
portion of the entire image collage to be visible at a time. A user of the interface can explore various parts of the collage by panning to these regions within the viewport. Users can pan in any direction using mouse drag interactions similar to that of Google Maps. No zooming interactions are supported in the interface. As users pan to a new region in the collage, this area first appears blank, showing a grey background. Then image tiles eventually appear after the user finishes their panning interaction. Some amount of delay (0 seconds, up to 14 seconds depending on the latency condition of the experiment) is inserted before each new tile appears. Whenever a user moves away from a region, any tiles that move outside of the viewport are removed. Thus, if the user pans back to this location in the collage, they have to wait for the tiles to re-appear2.
The interface also includes two function buttons called "FOUND" and "FINISH". When a participant finds a copy of the target picture, they move the target picture to the center of the viewport (i.e., visualization window), and click on the "FOUND" button. The web page then pops out a window to confirm whether the participant did in fact find a target image. When a target is found, the target image is clearly marked with blue text saying "FOUND" after the confirmation, and a running total of "Targets found" is incremented by one. Participants are able to leave the main task page for the user study at any time by clicking the "FINISH" button. Once participants confirmed that they wanted to finish, they were not allowed to interact with the collage anymore.
Evaluating Search Patterns
The primary objective of this study is to evaluate whether people change their search pat-terns when faced with latency in the visualization interface. Specifically, we aim to measure whether users bias their search behavior when we insert delays into the interface before making images appear in the collage. Examples of how a person may shift their search patterns may include favoring certain regions of the collage over others, or avoiding certain interactions (e.g., panning left vs. right).
Our key evaluation is through the placement of our target images, and how we insert
2We note that a common optimization technique for systems like Google Maps is to cache recently visited
image tiles. We chose not to simulate any optimization techniques in our study, to ensure that the latencies observed were consistent across participants and image tiles.
Figure 2-2: A diagram representing a participant’s starting position (red circle), and the positions of the low latency target (gold star) and the high latency target (black star).
Figure 2-3: Proportion of participants who found the low-latency target first for each ex-perimental condition and latency case.
latency for new images in relation to these target images. In our experimental design, we created two targets, which we will refer to as the low-latency (or fast) target and high-latency (or slow) target. Figure 2-2 is a diagram of an example layout that was used for one of our experimental conditions, showing the participant’s starting location within the collage, and the positions of the low-latency and high-latency targets. Suppose that im-ages along the path to the low-latency target load faster than imim-ages that are along the path to the high-latency target, our hypothesis is that participants are more likely to find the low-latency target before finding the high-latency target. This hypothesis stems from the outcomes observed in previous work: people notice and become annoyed with delays in visual exploration interfaces [46]. Given a decision of two directions to go in, and expe-riencing delays along one of those directions, we assume that the user is more likely to choose the direction of least resistance. In contrast, in an environment that is free of
laten-cies towards both targets (i.e., has no noticeable latency), we expect that participants will choose both directions with equal probability (i.e., 50% of the participants will choose the low-latency target and the other 50% will choose the high-latency target).
However, it is possible that participants may be more likely to find a target within a specific region of the collage, simply because they are used to scanning information in a particular direction (e.g., scanning from top to bottom, and from left to right). To take this into account in our study, we alternate which target position is the low-latency position, and which target is the high-latency position. In this way, any effects that may be contributed by positioning are distributed between the two targets.
Introducing Latency
A critical component to our experimental design is carefully controlling how, when, and where latency is introduced as the user explores the collage. Each tile in the collage is assigned a latency value that is used to determine the amount of time before the image in the tile appears on the screen. A tile’s latency value is based on its relative position to the low-latency and high-latency targets and the participant’s current (viewport) location in the collage. We conducted a pilot study to determine suitable latency values, and found the that a latency values ranging from 0 seconds to 14 seconds to be appropriate. Specifically, a tile can have one of four possible latency values: 0 second, 0.75 seconds, 1.5 seconds and n seconds. The value of n is set according to the experimental condition (in our experiments, the possible values are 0 second, 2.5 seconds, 7 seconds, 10 seconds, or 14 seconds. See Section 2.4 for more detail). A tile is assigned n seconds of latency if it is between the user’s current location and the high-latency target, 0 seconds if it is between the user’s current location and the low-latency target. For all other tiles, its latency value is determined based on whether it is closer to the latency or high-latency target. If it is closer to the low-latency target, it is assigned a low-latency value of 0.75 seconds, and 1.5 seconds otherwise3.
Because a tile’s latency value depends on the user’s location, its latency is updated after every user interaction. In our experiment, we “insert” a delay for a particular image to appear on the screen using the setTimeout function in Javascript. This function allows
us to set a wait time in milliseconds before we render the image. Each image is given its own separate setTimeout call, so that delays can be applied at the granularity of individual images. This wait time is set with respect to the user’s current interaction, but is not a blocking function. Therefore, the user is free to perform other panning interactions while waiting for new images to appear.
Data Collection
As participants explore the collage, we record each of their interactions with the interface. For each participant and experiment, we record the same set of information: 1) the initial starting state and parameters for the collage and interface (grid layout, target positions, participant starting position, latency values); 2) the beginning and end positions of each drag interaction, along with their corresponding timestamps; 3) the timestamp and loca-tion for every "FOUND" button click within the collage; 4) the timestamp, posiloca-tion, and assigned delay value for each tile that was scheduled to appear in the collage; 5) the times-tamp and position for each tile that was removed from the collage by panning away; and 6) the timestamp for the final "FINISH" button click. For each participant that successfully completes the experiment, we compute whether they find the low-latency target first, or the high-latency target first. Figure 2-3 Novice Search shows the percentages of the partici-pants who found the low-latency vs. high-latency targets first under five latency conditions: 0 second, 2.5 seconds, 7 seconds, 10 seconds, and 14 seconds.
2.4
Experimental Conditions and Results
Based on our literature review of the common types of analysis scenarios, we conducted a 8 (analysis scenario) x 5 (amount of latency) factorial design experiment to evaluate the effect of latency on user’s analysis behavior. Across all 8 of the tested scenarios, we varied the maximum latency: {0 seconds, 2.5 seconds, 7 seconds, 10 seconds, and 14 seconds.} In the sections below, we introduce each of the 8 analysis scenarios, followed by the results of how the different amounts of latency affect the users’ behaviors.
2.4.1
Novice Search
This scenario is our “base” condition. Participants were asked to identify two copies of the target dinosaur image within the 20x20 image collage. These copies correspond to one low-latency target and one high-latency target in our experimental design. Two targets were selected to ensure a clear and consistent pattern of latency across the collage. For example, having a single low-latency target ensures that the participant only observes low latencies when moving towards a specific region of the dataset. Participants’ starting positions within the collage, as well as the positions of the targets, were kept the same across all participants. Specifically, the starting position is set to be equal-distance apart from both the low-latency and high-latency target.
Hypotheses: In this condition (i.e., analysis scenario), our goal is to evaluate whether latency alone has any affect on how the participants chose to search the collage for the dinosaur targets.
H1.1 Since the novice has no knowledge of where the two targets are, their initial search will be influenced by the latency in that the higher the latency, the more likely they will tend to start the search towards the low-latency target.
H1.2 Because the novice has no knowledge about where the targets are and no precon-ceived strategy, their search paths will appear to be random.
Results: As expected, we found that roughly half of the participants who successfully completed the 0 second latency case to find the low-latency target first (11 of 20 partici-pants). Thus both targets were equally likely to be found first when there were no delays. However, we also found that in the 2.5 second latency case, both target images were still equally likely to be found first (12 of 22 participants found the low-latency target first). Thus participants’ search strategies were unaffected by latency of length 2.5 seconds in the interface. We noticed that higher latencies had a modest effect, the strongest being in the 14 second latency case (16 of 21 participants). To evaluate further, we ran a one-way ANOVA with latency being the independent variable, and number of people who find the low-latency target first as the dependent variable. However we did not find a statistically significant result (F(4,98) = 0.794, p = 0.532). In summary, we found that latency had little
if no effect on participants’ search strategies.
2.4.2
Novice Search Under Time Pressure
In this experiment, we examine how latency affects a user’s search behavior when under time pressure. The experimental setup of this condition is the same with the previous, ex-cept that the tasks had a timer and were asked to find one of the two targets. The participants were required to complete the task before the timer expires. We ran a pilot experiment to measure the average amount of time it took for participants to successfully find one of the two targets, and determined that 100 seconds was appropriate.
Hypothesis: We stipulate that this task is stressful and difficult to complete because we are asking the participants to find one target within a time frame that makes it extremely difficult search the entire collage.
H2 Due to the added time pressure, the participants are more likely to frantically and randomly search for the targets. As a result, their search behavior will be significantly influenced by latency.
Results: 12 of 21 participants successfully completed the task in the 0 second latency case, 12 of 22 in the 2.5 second latency case, 7 of 21 in the 7 second case, 8 of 21 in the 10 second case, and 9 of 21 in the 14 second case. We observed the general trend of an increase in the fraction of participants that found the low-latency target first as the latency increased, similar to our results from the Novice Search experiment. For latency cases 10 and 14 seconds, all participants found the low-latency target first. We ran a one-way ANOVA with latency as the independent variable, and number of people who find the low-latency target first as the dependent variable. We observed weak significance in the result (F(4,43) = 2.154, p <0.1). In summary, we found that high latency (i.e., latency of 10 seconds or more) has a stronger effect on participants who are time pressured, compared to participants who are not time pressured, but low latency (i.e., 7 seconds or less) has no effect.
2.4.3
Analysis by a Technical Expert
In this experiment, we simulate the condition where the user has expert knowledge about the tool itself by revealing that there are some actions that can lead to additional latency in the system.
We do so by adding a note in the study saying: “some actions may be slower than oth-ers in the interface.” To ensure that the participant is aware of this information, this note is repeated in 3 places: 1) in the task instructions page, 2) as a popup that users had to see before moving on to the task page, and 3) as a short note at the top of the task page.
Hypothesis: The goal of this experiment is to see if users deviate from the behavior we observed in the Novice Search experiment when given information about the interface.
H3 With the additional information about latency in the system, the participant will be more keenly aware of their actions, therefore they will be more likely to avoid search-ing in places that cause high latency. In effect, the participants’ behavior will be affected by the amount of latency.
Results: Ultimately, we found that knowing that some interactions may be slow (i.e., high-latency) seemed to have no effect on participants. We attribute this to participants not realizing that there was a pattern to the slow interactions, and thus that they could poten-tially choose low-latency (i.e., faster) interactions. In the 0 second latency case, 11 of 20 participants found the low-latency target first, similar to the Novice experiment. We ob-served only a modest increase as we varied latency, with the highest fraction of people finding the low-latency target first in the 14 second case (16 of 23 participants). We ran a one-way ANOVA with latency as the independent variable and number of people who find the low-latency target first as the dependent variable, and found the result was not statisti-cally significant (F(4,95) = 0.291, p = 0.883). What we can glean from this experiment is that technical expertise is of limited use on its own: simply knowing that a certain effect may occur in the interface will not tell you why it occurs, or what actions to take to prevent the effect from happening. In summary, we found that being made aware of latency in the system had little effect on participants, and similar to the Novice Search condition, latency
had little to no effect on participants.
2.4.4
Analysis by a Domain Expert with Exact Information
The goal of this experiment is to simulate the case where a user may have extensive knowl-edge about the dataset that helps them navigate the data more efficiently in a visual ex-ploration interface. For example, knowledge of geography helps users significantly when searching for things within geospatial datasets: users can avoid looking in the ocean when searching for something on land, and can pan directly to countries they are familiar with in a world map.
To recreate this condition for our experiment, we provided users with explicit knowl-edge of the location of the target images. We modified the Novice Search setup by adding a note to the study saying: “The target pictures are directly to the left and right of your starting position.” This note was added in 3 places: 1) in the instructions (which included a diagram to help demonstrate the target locations), 2) as a popup that users had to see before moving on to the task, and 3) on the task page. The targets were placed directly to the left and right of the participant’s starting location in the collage.
Hypothesis: In this case, participants have nearly perfect information about where two targets are located in the collage.
H4 Because participants know exactly where to explore to find a target, we expect par-ticipants to choose more direct or opportunistic search strategies (i.e., look in the specific areas where targets should be found) over exhaustive ones (i.e., look at every image in the collage). Furthermore, tiles along the path to the low-latency target will appear faster than the high latency target, which the participant will see as soon as they start the experiment. Therefore, we should see more participants choosing to explore the part of the collage that appears first, which corresponds to finding the low-latency target over the high-latency target.
Results: We continue to see a general trend that more people find the low-latency target first as the delay length is increased4. 8 of 22 participants find the low-latency target first in the 0
second case, up to 17 of 21 participants in the 14 second case. Thus, latency seems to have a noticeable effect on participants’ strategies that becomes stronger as latency is increased. To evaluate further, we ran a one-way ANOVA with latency as the independent variable and number of people who find the low-latency target first as the dependent variable, and found the result to be statistically significant (F(4,101) = 3.402, p <0.05). With a Tukey post-hoc analysis with a 95% family-wise confidence interval, we found one latency pairing to be statistically significant, 0s vs 14s (p <0.05), and one pairing with weak significance, 0s vs 7s (p <0.1).
2.4.5
Analysis with Incomplete Domain Knowledge
The goal of this experiment is to simulate the case where a user may have prior knowledge about the dataset, but their knowledge has some uncertainty associated with it: the user knows of the possible locations they may want to search, but they don’t know which loca-tion is the “correct” one. To create this experiment, we updated the Novice Search design by adding a note to the study saying there is only one target, and it is equally likely that the target is either to the left or to the right of the participant’s starting location, similar to the previous experiment. This note appeared in the same locations in the task website as the previous experiment. The targets were placed directly to the left and right of the participant’s starting location.
Hypothesis: In this experiment, participants have extensive information about the target location (i.e., the target is either on the left, or the right). However the target only appears to be on one side, so they must still choose which direction in which they want to search.
H5 Given the target location information, participants will be more likely to be influenced by latency, and will heavily prefer to find the low-latency target first.
Results: The fraction of people who found the low-latency target first was similar in the 0 second latency case (8 of 20 participants) to the results observed for the Novice Search experiment (11 of 20 participants). We also see a steady increase in the fraction of people who found the low-latency target first when the latency was increased, with 19 of 21 par-was omitted due to issues with the first experimental run.