Nuclear Inseuments and Methods in Physics Research A 378 (1996) 101-I 15 WucLaAR INSTRIIYENTS
filzE%E:
RPSRARCH Section A EISEVIERCombining heavy flavour electroweak measurements at LEP
ALEPH Collaboration, DELPHI Collaboration, L3 Collaboration, OPAL, Collaboration
CERN, Geneva. Switzerland
Received 15 February 1996
Abstract
The ratios of cross sections, Rb = a(e+e- + bb)/a(e+e- + hadrons) and R, = cr(e+e- --+ E)/a(e+e- -+ hadrons), and the forward-backward asymmetries A:\ and A& have been measured by the four LEP experiments at centre-of-mass energies close to the Z boson mass, using a variety of heavy flavour identification techniques and analysis methods. The procedure adopted to combine these measurements is described here. It takes into account the statistical and systematic correlations among the measurements and their interdependences in a x2 minimization. The procedure is illustrated using published measurements.
1. Introduction
With the large samples of hadronic Z decays avail- able, the four LEP experiments, ALEPH, DELPHI, L3 and OPAL ’ have measured the ratios of cross sections, & = a(e+e- --+ bE)/u(e+e- + hadrons) and RC = c+( e+e- -+ CC) /u( e+e- ---f hadrons) and the forward- backward asymmetries A$ and A$ at centre-of-mass ener- gies close to the Z boson mass. In the electroweak Standard Model, the propagator corrections are expected essentially to cancel in the ratios Rb and RC. The value of Rb is then sensitive to the top quark mass via the unique radiative cor- rections to the Z -+ bb vertex, while RC has a much weaker dependence. The Z + bb vertex is also of interest as a probe of new physics. In addition, the asymmetries yield precise information on the weak mixing angle, sin’ @Fg.
Several of the experimental analyses also determlne other quantities, in particular the semileptonic branching ratios for b and c hadrons, the average mixing parameter, X, and the fragmentation parameters (XE)b and (x&. The parameter z is defined for b hadrons that decay semileptonically as the probability that a produced b hadron decays as its antiparti- cle. The variables (xs)b and (xE)~ are defined as the average fraction of the beam energy carrled by the weakly decaying b or c hadron respectively. Where these quantities are not measured, they may nonetheless be a source of systematic uncertainty for the electroweak measurements. Motivated by lepton fit analyses, the combined values of seven parame- ters have been determined: the four parameters of interest in the electroweak sector, Rb, R,, Ag and A& and in ad- dition x, BR(b -+ C) and BR(b + c + !+), to take into ’ For the members of the Collaborations see for example Refs. [ 3-571.
account the dependence of the electroweak parameters on them’. Only those measurements of x, BR(b --+ .!?-) and BR( b + c --) e+) from analyses which also evaluate one or more of the electroweak parameters are included here.
The asymmetries vary rapidly with centre-of-mass energy. However, only a few measurements of the asymmetries at centre-of-mass energies away from fi = mz, with limited statistics, have been published to date. For the sake of clar- ity they are not discussed in this paper, where only results that have already been published by the experiments ate considered. More precise but preliminary results have been presented at recent conferences [ 11.
A number of important sources of systematic uncertainty affect these heavy flavour measurements, in particular Rb. These emrs are potentially common to all the experiments. For this reason the LEP Electroweak Heavy Flavour Work- ing Group3 has agreed on a common set of external in- put parameters such as branching ratios or hadron lifetimes, and has developed a procedure based on the method of Best Linear Unbiased Estimate (BLUE) [ 21 for combining the measurements taking into account known sources of corre- lation. This procedure is extended to accommodate the in- terdependences of the electroweak parameters.
The purpose of this paper is to document the values and ranges of common inputs used to date, which are based on
* Charge conjugate decays are implied throughout this paper. ?he semilep- tonic branching ratios are defined for a single lepton flavour, e or p. The expression b + E - e- will be used to indicate processes such as b - CZS followed by Z -+ e-.
3The group comprises: D. Abbaneo, F! Antilogus. P. Arce, T. Behnke, D. Bloch, G. Botisov, D. Brown. I.C. Brock, D.G. Charlton. R. Glare, T.S. Dai, A. Halley, R.W.L. Jones, S. de long, R.V Kowalewski, K. Moenig, A. Nippe, A. Pass&. P. Perret. R. Tenchini, and P.S. Wells.
0168-9OCt2/96/$15.00 Copyright @ 1996 Published by Elsevier Science B.V. All rights reserved PI1 SO168-9002( 96)00420-2
102 ALEPH, DELPHI, I.3 and OPAL Collaboration /Nucl. Insm and Meth. in Phys. Rrs. A 378 (1996) 101-115
measurements published before 1994, together with the av- eraging technique. The paper is organized as follows: after a brief summary of the experimental methods used (Sec- tion 2) and a description of the common inputs (Section 3), the method for combining the different measurements is ex- plained (Section 4). The small corrections needed to relate the measured quantities to the equivalent quantities for pure Z boson exchange are described in Section 5. The results published to date by the experiments are then summarized and their combination is discussed (Section 6).
2. Experimental measurement techniques 2.1. Methods of tagging heavyjavours
The relatively long lifetimes of hadrons containing heavy quarks, combined with the boost provided in Z decays, give rise to decay lengths of a few millimetres. This lifetime in- formation may be used to select a sample of heavy flavour events. Qpically, either several charged particle tracks with impact parameters with respect to the primary vertex that are significantly larger than the measurement errors are re- quired, or a secondary vertex is sought with a significant decay length. While such techniques were used before, the installation of silicon microvertex detectors in the LEP ex- periments has allowed this form of tagging to come to the fore, achieving b quark tagging efficiencies of the order of 30% for 90% purity.
The tagging of heavy flavour decays by the identification of a lepton in the decay products is well established. The high mass of the heavy quarks and their hard fragmenta- tion functions lead to the leptons having a hard momentum spectrum and a large momentum component transverse to the heavy hadron direction. The transverse momentum is typically smaller for c decays than for b decays, allowing the two to be separated on a statistical basis. The disad- vantage of the lepton tag is the small (N 10% per leptonic channel) semileptonic branching ratio for b and c quarks, compounded by identification inefficiencies for ei and j.~’ and the inability to identify cleanly T* in semileptonic de- cays, leading to b-quark tagging efficiencies of about 10% for 90% purities.
Neither lepton tagging nor lifetime tagging allow a clean sample of charm events to be isolated. However, while both b and c events may give rise to D** mesons, by selecting those D** carrying a large fraction of the beam energy a relatively pure charm sample is obtained. Lifetime, lepton and event-shape information in the rest of the event may also be used to separate the contributions from b and c events to the D‘* sample.
Finally, event shape variables have been used to tag heavy flavour events. Unfortunately, heavy flavour events are not very dissimilar to light quark events in such variables at LEP energies. To improve the accuracy of these methods, neural networks based on several shape variables are often used,
but the resulting purities still remain low with respect to the other heavy flavour tags.
The charged tracks and calorimeter energy deposits in an event can be used both to define the event thrust axis, and to form jets by grouping them together. In many analyses, the event thrust axis is used as an estimate of the produced- quark direction, while the jet axis is often a better estimator of the heavy hadron direction. The tracks and energy de- posits can also be divided into two event hemispheres by the plane perpendicular to the thrust axis. Because the quark and antiquark are typically produced back to back, this gives an approximate separation between the decay products of each. The charged leptons have the additional advantage of be- ing a good indicator of the parent quark charge at the time of decay, allowing it to be identified as a quark or an anti- quark, which is necessary for asymmetry and mixing mea- surements. The charge of D’* mesons produced in the de- cays of heavy flavours is also a good indicator of the parent quark charge, and is particularly useful in measuring A%. To take advantage of the high statistics lifetime-tagged sam- ples, the hemisphere charge, Qkmi, can also be used to es- timate the charge of the initial quark contained in a given thrust hemisphere:
Qtxmi =
where the sum runs over the N charged tracks of the hemi- sphere, pi’ is the momentum component of the track i along the thrust axis, qi is the charge of track i and the parame- ter K is tuned in order to optimize the charge determination. Although the typical charge separation power of the hemi- sphere charge is worse than that of a lepton, when combined with the high statistics lifetime-tag samples, this leads to competitive measurements of A%.
2.2. Heavy&vow analysis methods 2.2.1. Double-tagging measurements of Rb
Rb is currently best measured by analyses that divide the events into two hemispheres and then compare the num- ber of tagged hemispheres with the number of events with both hemispheres tagged (“double-tagging methods”). This is because these methods determine the b-tagging efficiency directly from the data, without the need to model the b- hadron production and decay. Results using a lifetime tag dominate these measurements [ 3-51. Additional statistical precision can be gained by allowing either a lifetime or a lepton to tag a hemisphere [ 4,5]. Double-tagging rates have also been used by ALEPH in their event-shapes analysis for Rb [ 61, but in this case the purity of the tag is considerably lower, and so the background related systematic errors are larger. The L3 measurement of Ri, using event shape vari- ables in a neural net [7] does not use double-tagging, but does use the data to calibrate the properties of the net output.
ALEPH, DELPHI, W and OPAL Collaboration /Nucl. Instr. and Meth. in Phys. Res. A 378 (1996) 101-l I5 103
The principle of the double-tag method is as follows. If in a sample of Nhd hadronic Z decays the number of single hemispheres tagged is N, and the number of events with both hemispheres tagged is Nil, then:
N, -==EbRh+EcRc+Euds(l--h-Rc). 2Nhad N, -=CbE~Rh+E~Rc+e~~(l-Rb-Rc), Nhad (1)
where q,, EC and E& are the tagging efficiencies per hemi- sphere for b, c and light quark events respectively, and ch # 1 accounts for the fact that the tagging efficiencies between the hemispheres may be correlated. In practice, &h >> EC > &“& and ‘?h = 1. Neglecting the c and uds backgrounds, and the correlations, these equations can be solved to give:
oh = 2Ni,,‘N,, & = N:/(4N,tNhaci). (2)
The backgrounds, dominated by CC events, obviously com- plicate this picture, and their level must still be inferred by other means. The assumptions on charm production and decay properties lead to sizeable systematic uncertainties which are largely common between the different experi- ments. The rate of charm background in these analyses de- pends explicitly on the value of R,. This dependence is han- dled in the averaging procedure described below.
The correlations in tagging efficiencies between the hemi- spheres are kept small by restricting the analyses to homo- geneous parts of the detectors, but are another source of sys- tematic uncertainty. In principle the double-tagging methods are constructed such that b production and decay properties do not need to be known for the measurement of &,. How- ever, features such as the correlation in momentum between the b hadrons in the two hemispheres potentially lead to cor- relations in the tagging efficiencies, and to further common systematic errors.
In general, the statistical error is dominated by the number of double-tag events, while the systematic error depends on the level of charm background and on the correlations between the tagging efficiencies in the two hemispheres. Each experiment tunes its tagging algorithm to minimize its total error.
2.2.2. Jet charge measurements
of
A$,Measurements of A% can also be based on samples of high b purity obtained by lifetime tagging, with the hemi- sphere containing the quark or antiquark determined using a hemisphere charge measure, Qkmi [g-lo]. The initial quark direction is estimated by the thrust axis, with the sense de- termined by the hemisphere charge in the forward and/or backward hemispheres. ALEPH and OPAL have essentially determined the hemisphere charge properties of b events from the distributions of the charges themselves [ 8,103. This method has the advantage of being insensitive to the mixing in the b events. The DELPHI study uses lepton informa- tion in the opposite hemisphere to measure the hemisphere
charge properties [9]. These hemisphere charge analyses are at a similar level of precision to the lepton fits described below, but have different sources of common systematic un- certainty, with the main contribution coming from the as- sumed fragmentation properties.
2.2.3. Multiparameterjts to lepton data
High-statistics samples of hadronic events with leptons provide a means to determine simultaneously &,, R,, A$,, AFB and the mixing parameter, X [ 4,1 l-l 31. The semilep- tonic branching ratios BR(b -+ e-) and BR(b -+ c -+ e+) are also often free parameters in the fit. The partial widths, semileptonic branching ratios and mixing parame- ter are derived from the composition of the sample in terms of the number of single and double-tagged events, with the double-tags decomposed into like-sign and unlike-sign events, with the leptons in the same or in opposite thrust hemispheres. Statistical separation of the different sources of leptons comes from the lepton momentum and transverse momentum with respect to the associated jet.
The forward-backward asymmetries, A% and A&, are either determined in the same tit, or in a separate analysis using the other measurements as constraints [ 9,11- 131. The initial quark direction is estimated by the polar angle of the thrust axis, taking the thrust vector to be in the same thrust hemisphere as the lepton, and distinguishing between the quark and antiquark by the lepton charge. The effect of B’s mixing reduces the observed b asymmetry to ( 1 - 27) A$,.
The major common sources of systematic uncertainty for me lepton fit analyses are the modelling of the semileptonic decays of b and c hadrons and those semileptonic branch- ing ratios that are not included as fit parameters. In addition, there is a statistical correlation between the measurements made in the same fit. It is therefore inadequate to take, for example, a lepton fit measurement of Rt, alone and to com- bine it with another lepton fit measurement, without taking into account the other measured parameters.
2.2.4. Measurements of R, and A$, using D mesons
In addition to the multiparameter lepton tits, measure- ments of R, from the production rates for charmed mesons, most often D” which can be cleanly selected, have a sig- nificant weight [ 14,151. As these mesons can be produced both from direct charm and in the decay chain of b hadrons, the two components are separated using additional informa- tion, including the D** energy spectrum, associated lepton production, the apparent lifetime of the charm decay and lifetime information in me opposite hemisphere to the D** and also event shape properties of the hemisphere oppo- site to the D**. The b fragmentation, decay modelling and branching ratios introduce important systematic uncertain- ties in these measurements.
Measurements of A& have been provided by ALEPH, DELPHI and OPAL using samples tagged by D** mesons, ALEPH and OPAL use the fraction of the beam energy
104 AIEPH, DELPHI, W and OPAL Collaboration /Nucl. Instr. and Meth. in Phys. Res. A 378 (1996) 101-115 carried by the D** to separate the b and c components
[ 16,171, while DELPHI have also used decay length infor- mation which introduces an uncertainty due to the modelling of the time dependence of mixing [ 181. The DELPHI and OPAL analyses also provide a simultaneous measurement of A$. The dominant common systematic uncertainties arise from the b decay and fragmentation modelling, and from the charm decay schemes used.
3. Choice of external inputs and common systematic uncertainties
All the heavy-flavour electroweak measurements require to some extent external input parameters from other analyses at LEP or from lower energy accelerators. In order to make a meaningful combination of measurements from different experiments, these input parameters should be the same for all anaiyses and so a set of values and models to be used was agreed upon by the LEP experiments. The choices of values and their errors for the analyses presented in this paper are summarized in Table 1. Where an input parameter chosen for combining the measurements differs from that used in a LEP experiment’s original publication, the new value is propagated through by that experiment to produce the result used in making the averages. These input parameter choices were made in early 1994, using the data then available, and clearly will be updated in the future. The symbols and further details are explained in the following sections.
3.1. Interdependence of electroweak parameters
The measured value of a given electroweak parameter in the heavy tlavour sector often depends on the values assumed for other electroweak parameters. For example the value of !?b from the precise double-tag measurements depends ex- plicitly on R,. The averaging procedure takes into account any interdependences explicitly, and provides the correla- tions between the final combined electroweak parameters. The uncertainties in electroweak parameters are therefore not considered to be a source of systematic error.
3.2. Modelling of prompt leptons
3.2.1. Choice of semileptonic decay model
Each of the experiments has independently tuned a large set of parameters in the Monte Carlo simulation to achieve agreement with their data. This procedure includes adjust- ing the decays of b and c hadrons to agree with the results of lower energy experiments, and tuning the b and c fragmen- tation parameters. It is not possible simply to suggest a set of parameters for b and c hadron decays for all the exper- iments to use, as all the other parameters would then need to be retuned. In addition large samples of events have al- ready been simulated. However, for the purposes of results using a lepton tag for bb and cF events, each experiment
Table 1
Central values with errors of common input parameters as agreed by the
LEP experiments. For explanations of the symbols in this table, and for the derivations of the values and ranges of the parameters, see the text in Section 3
Error source Value and range
Semileptonic decay model b - P- ACCMM ( _IsGwI* fWZW ) (see text)
Semileptonic decay model c - @ CL1 (+_c;$ (see text)
b -+ D model Peterson 6 = 0.42 rt 0.07 BR(c + E+) (9.8 & OS)%
BR(b-F-r-, (1.3 f 0.5)% BR(b+r- -+!-) (0.7 f 0.2)% BR(b - J/+ - !+e- ) (0.07 f 0.02)% (xp(b)) fitted or 0.70 f 0.02
bE(c)) lined or 0.51 Z!Z 0.02
Choice of b fragmentation function see text Choice of c fragmentation function see text BR(c - D*+ -t (K-n+ 1 a+) (0.71 f 0.05)% D” fraction in c? eventsa 0.557 f 0.053 D+ fraction in c? events a 0.248 f 0.037 (Do + D+) fraction in CE events a 0.80 zt 0.07 Ds fraction in CC events a 0.12 l 0.05 AC fraction in d events a 0.08 f 0.05 Do lifetime 0.420 zt 0.008 ps D+ lifetime 1.066 f 0.023 ps Ds lifetime 0.450fo~030 -0.@26 ps AC lifetime 0. I 9 I fOiM -0.012 ps B decay multiplicity 5.5 f 0.5
D decay multiplicity b 2.53 Z+Z 0.06 (see text) BR(D + K;X) b 0.46 f 0.06 (see text)
N(g -+ bb) JETSET f 50% zz (0.16f O.OE)% N(g --t CC) JETSET f 50% x (1.6 f 0.8)% Rare of long-lived light hadrons runed JETSETflO% (see text) Light quark fragmentation see text
a The errors on the fractions of charm hadrons are not independent. The scheme for assessing the overall error due 10 charm fractions is described in the text.
b The measured D decay multiplicities from MARK III are used. which correspond to this average value. The MARK III measurements include the contribution from Ki decay products.
can reweight events according to the lepton momentum in the rest frame of the heavy hadron to agree with a chosen model of the lepton spectrum. In this way the results can be provided for a consistent set of models, which should rep- resent the central value and a reasonable spread of “hard- ness” of the spectrum to evaluate the systematic uncertainty. This method is effective as the generated Monte Carlo sam- ples have lepton spectra similar to the models chosen, and the range of variation is small, so that the weights for most events are close to 1.
For the semileptonic decays of B” and B+ mesons the CLEO collaboration has compared decay models to their data and measured the free parameters of the models [ 191. Based on the CLEO fits, the LEP experiments quote results
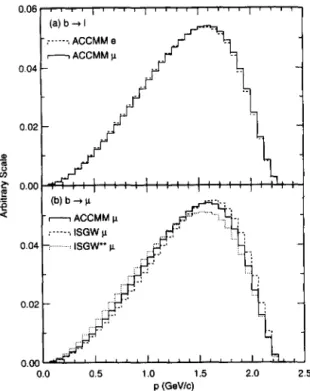
ALEPH, DELPHI, W and OPAL Collaboration /Nucl. Instr. and Meth. in Php. Res. A 378 (19%) 101-115 (a) b + I - i’.-‘: ACCMM e - ACCMM P - - ACCMM )I ;‘---.a ISGW p 0.04 -.. ISGVP u 0.0 0.5 1.0 1.5 2.0 2.5 p (GeV/c)
Fig. 1. The momentum spectrum for a lepton in the rest frame of the B for b -+ e- decays. (a) shows the central ACCMM spectrum including radiative corrections for e and p. (b) shows the ACCMM, ISGW and ISGW** spectra for CL.
for three models, defined as:
- ACCMM with model parameters pr = 298 MeV/c, m, = 1673 MeVlc2 (for the central value) [ 19,20],
- ISGW** with the modified 32% of D** mesons (quoted - ISGW with the model prediction that 11% of semileptonic B meson decays result in an 15 = 1 charm meson, D** (quoted as +la) [21],
as -la) [ 19,211.
The lepton spectra from each of these models are illus- trated in Fig. 1. Radiative corrections [ 221 and the small contribution from b ---t u decays measured by CLEO for each of these models is also taken into account.
Reweighting functions are constructed to adjust the lep- ton spectrum of semileptonic B” and Bf decays in the LEP Monte Carlo samples to the three models based on CLEO data. For use in Z decays, the same reweighting functions have been assumed to be valid for the B, meson and b baryons (denoted hb for convenience). This would be cor- rect in the simplest spectator model, and is thought more generally to be reasonable for the B,. The As is expected to constitute only about iO% of b hadrons, and no additional systematic error is assigned for the As decays.
The measurements of DELCO [ 231 and MARK III [ 241 for Do and D+ semileptonic decays have been combined and parameterized using the ACCMM model as a convenient functional form. The D boost and the experimental resolu- tion are taken into account in the fit to the data, shown in Fig. 2a. Based on this fit, three distributions to be used for
0.00 0.25 0.50 0.75 1.00 0.20 (c)b_,c+l’ 1 1 , I ’ ’ ’ ’ I 1 ’ - Central Value ;----: +l 0 0.00 1,. , ,, 0.0 0.5 1.0 1.5 2.0 p (G&/c)
Fig. 2. Lepton momentum distributions for (a) the fit to DELCO and MARK III c + e+ data including resolution effects, (b) a muon in the rest frame of the D for c --t e+ decays and (c) a muon in the rest frame of the B for b - c - e+ decays. For (b) and (c) the solid line shows the spectrum used for the central values, while the dashed and dotted lines show the fl standard deviation distributions.
c -+ e+ decays are defined as:
- CL1 with model parameters pr = 0.467 GeV/c, ms =
0.001 GeVlc2 (for the central value),
- CL2 with model parameters pr = 0.353 GeVlc, ms = 0.001 GeV/c2 (quoted as +la),
- CL3 with model parameters pr = 0.467 GeV/c, m, = 0.153 GeV/c* (quoted as -la).
The resulting distributions of the lepton momentum in the rest frame of the D are shown in Fig. 2b. The reweighting functions derived from Do and D+ decays are assumed to be valid for all charm hadrons.
For the cascade decays, b -+ c -+ e+, the three models used for c + e+ decays are combined with the measured b -+ D spectrum from CLEO [ 25 I to generate three models for the lepton momentum spectrum in the rest frame of the b hadron. The CLEO b -+ D spectrum can be conveniently modelled by a Peterson function [ 261 with free parameter E = 0.42 10.07. The effect of this b -+ D model uncertainty on the b --f c -+ e+ spectrum is negligible compared to the uncertainty from the c --+ e+ models. The resulting distri- butions of the lepton momentum in the rest frame of the B for b -+ c + ef decays are shown in Fig. 2c. The reweight- ing functions derived by comparing these distributions with Monte Carlo b -+ c + e+ decays are then also applied to b + ? -+ e- decays.
106 ALEPH. DELPHI, L3 and OPAL Collaboration /Nucl. tnstr. and Uerh. in Phys. Res. A 378 (19%) 101-115
3.2.2. Semileptonic branching ratios
The average semileptonic branching ratios BR( b + e- ) and BR( b + c -+ ef) are sufficiently well measured at LEP to avoid having to use results from experiments at Y (4s) en- ergies, where only B” and B+ mesons are produced. Where the lower energy measurements have been used in an analy- sis, they are replaced in the averaging procedure by the LEP values.
The measured semileptonic branching ratios depend on the semileptonic decay mode1 used. This dependence is pre- served in analyses which need the semileptonic branching ratios but do not measure them. The overall semileptonic decay model dependence for such an analysis is determined by using each of the three models with its corresponding branching ratio.
The branching ratio BR(c -+ !+) has not yet been mea- sured at LEP This is partly because the leptons originating from c -+ b+ decays have a substantial overlap in their mo- mentum and transverse momentum distribution with lepton candidates from other sources. Measurements of BR( c -+ !+) have been made in the continuum below the Y(4S) at ARGUS [ 271, where no b-quark pairs are produced. There are also measurements made at PEP and PETRA [ 281 where the c + e+ fraction is enhanced because the rates of b and c quark production are proportional to the quark charges, and further enriched with requirements on the lepton energy and transverse momentum.
There is a possible common uncertainty in the PEP and PETRA estimates of the charm semileptonic branching ra- tio because the mixture of D mesons produced in b -+ D decays is not necessarily the same as for the D mesons pro- duced directly in charm fragmentation. This uncertainty has been estimated by making the assumption that BR(D’ -+ e) = 8% < BR(b 4 c + a) < BR(D+ ---f I) = 17%. This large range leads to a common absolute uncertainty of 0.3% in BR(c -+ e+) for the PEP and PETRA results. Combin- ing the PEP and PETRA average with the ARGUS number gives BR( c --+
e+
) = (9.8 f 0.5) %. To the quoted precision the result would be the same if no common systematic un- certainties were taken into account for the PEP and PETRA measurements.The central value for BR(b --+ C + e-) of 1.3% is the value from JETSET 7.3 [ 291 with tuned parameter sets as used by the LEP experiments [ 301. The error of &OS% allows for ( 15 f 5) % of b-quark decays to produce a C anti- quark [ 3 11, and a f 15% uncertainty in the semileptonic branching ratio of the resulting charm hadrons.
The suggested value for BR( b -+ 7- + !-) is based on the ALEPH measurement of BR( b + T-) = (4.08 f 0.76 f 0.62)% [ 321 combined with measurements of the tau leptonic branching ratios [33]. More recent measure- ments [ 34,351 give a consistent value.
The value of BR(b + J/(/I -+ e+C-) is derived from measurements of the B” and B’ branching ratios to a J/$ and the J/e leptonic branching ratio [ 331. The error is
inflated by a factor of 2 to account for the unknown B, and Ah contribution, which is assumed to have the same value. Measurements at LEP [ 361 are consistent with this value, but require an assumption for the value of &,.
3.3. Mode&g of b and c fragmentation
The precise measurements of the average energy of b and c hadrons at LEP, from event samples tagged with leptons or D* mesons, mean that heavy flavour fragmentation is often one of the smaller sources of systematic uncertainty. In this paper, fragmentation is discussed in terms of the variable XE, which refers to the energy of the weakly decaying heavy hadron divided by the beam energy. Several models provide fragmentation functions which reproduce the observed XE distributions [ 15,371. The function most commonly used by the LEP experiments is from the model of Peterson et al. [ 261, which has one free parameter. This parameter can be varied in order to assess the uncertainty due to the mea- sured mean value of XE. (x,), or (xE)~. The fragmentation functions of Collins and Spiller [ 381 and of Kartvelishvili et al. [ 391 have been chosen to estimate the systematic un- certainties coming from the shape of the function. The mod- els are also tuned to reproduce (xE)~, or (xE)~. These two models typically yield results either side of those obtained using the Peterson function. For analyses which are rather insensitive to the fragmentation uncertainty, it is considered adequate to use just the Peterson model, and to inflate the chosen range of (XE)b or (xE)~ to reflect the additional un- certainty coming from the shape of the function.
3.4. Error in R, for D’ single tag measurements
In order to measure Rc from the rate of D’ tags, the probability for a charm quark to produce a D’ and the D’ branching ratios to the identified decay mode must be known. The value of Rc derived in a single tag measure- ment will then depend directly on this product branching ratio BR(c + D*+ -+ (K-q+) r+), for which there are no published LEP measurements. An average of measure- ments in e+e- collisions at 10.5 GeV [40] and around 30 GeV [41] is therefore used. The average takes into account common systematic errors due to the charm cross section at each energy. Other experimental errors were assumed to be uncorrelated. The validity of the resulting value of R,
depends on the assumption that the fraction of D’ mesons produced in CE events at 2 energies is the same as at lower energies. This assumption is supported by Monte Carlo sim- ulation studies, and is consistent within their roughly 20% errors with the measured D” yields at centre.-of-mass ener- gies around 10 and 30 GeV.
3.5. Errors from the charm sector for lifetime tag results The measurements using b tagging via a lifetime tag USU-
ALEPH. DELPHI, W and OPAL Collaboration /Nud lnstr. and Meth. in Phys. Res. A 378 (1996) 101-I 15 107
Carlo simulation. This leads to common uncertainties due to charm production and decay properties.
3.5. I. Charm lifetimes
The lifetimes of charm hadrons are taken from the Particie Data Group [ 331, and are listed in Table 1.
3.5.2. Mixture of charm hadrons
Since the charm lifetimes vary by up to a factor of 4, the relative rates of different charm hadrons are also important. The probability that a charm quark fragments into a D+ or Do meson can be calculated from existing data at fi = 10.55 GeV. The cross sections for D meson production at this energy are calculated from ARGUS [42] and CLEO
[43] data to be: g(D”) = 1.37 i 0.13 nb,
a(
Df
) = 0.61 f 0.09 nb, (3)where the Do and D+ cross sections include the D* decays, and Particle Data Group branching ratios [33] have been used.
The total hadronic cross section at 10.55 GeV has been measured to be 3.33 f 0.05 f 0.21 nb in Ref. [44]. The fraction of cC in the total hadroniccross section is expected to be 0.37f0.02 based on a Monte Carlo calculation including initial state radiation as cited in Ref. [43]. The cc cross section at 10.55 GeV is therefore expected to be
a(@ = 1.23 f 0.11 nb. (4)
Dividing the D cross sections by twice the cc cross section yields
f ( Do) = 0.557 f 0.053 f 0.048, f (D+) = 0.248 i 0.037 k 0.021,
where the second error comes from the error on the total charm quark cross section, and is therefore fully correlated between the two fractions. The experimental systematic er- rors on the D meson cross sections are assumed to be in- dependent from each other and from the charm cross sec- tion errors. Charm quarks which do not result in Do or D+ mesons give rise to D, and charm baryons, the relative con- tributions of which have not been measured.
To account for the correlations between f (Do) and f (D+) , the prescription given in Table 2 is used to evaluate the systematic uncertainties due to charmed hadron produc- tion. The first two lines account for the errors in a( Do) and (+(D+) (Eq. 3). The third line takes care of the error in c+(c?) (Eq. 4). The last line shows the large uncertainty in the relative fractions of D, and AC which is assigned. The fraction of charm baryons, f (A,) = 0.08, is not explicitly varied.
These numbers are expected to be valid at fi = mz. This prediction can be seen by running for example the JET- SET [ 291 or HERWIG [ 451 Monte Carlo programs at both
energies. No additional error is assigned for the assumption that the D fractions measured at lower energy are valid at LEI?
3.5.3. Charged decay multiplicities
The most accurate measurement of the charged decay multiplicities of D+ , Do and D, mesons are from the MARK III collaboration [ 461. These numbers are used by the LEP experiments. The error due to the D decay multiplicity is then the sum in quadrature of the separate uncertainties weighted by their relative contributions. The corresponding average D decay multiplicity is 2.53 f 0.06. The MARK III measure- ments include Kf decay products, which at LEP are gen- erally not associated to a secondary vertex. There is there- fore an additional uncertainty from BR( D -+ KfX) which is taken from Particle Data Group [ 331, and which has an average value of 0.46 i 0.06.
The average b hadron decay multiplicity is 5.5 & 0.5, as measured by OPAL [ 471.
3.6. Gluon splitting to heavy quarks
The rates of bb and CC production from gluon splitting have recently been calculated [48] to be N( g -+ bb) = (0.18~0.09)%andN(g-+c~)=(1.3f0.7)%,whereN
is the number per hadronic event. These numbers are con- sistent with the JETSET expectation (0.16% and 1.6% re- spectively), which is used by the experiments with a 50% error. A recent measurement by OPAL gives N( g + CC) = (2.38 & 0.48)% [49], which is consistent with the num- bers used. This measurement uses the JETSET Monte Carlo to model the very soft energy spectrum of heavy flavour hadrons from gluon splitting. In general, the heavy flavour tagging methods strongly suppress the gluon splitting con- tribution because of the soft spectrum of these hadrons.
3.7. Light quark background
The rate of long lived light hadrons affects the background in a lifetime tagged sample. All experiments have measured these rates and tuned their fragmentation model accordingly. As an estimate of the error a 10% variation around their central value is used.
For the systematics due to light quark fragmentation in jet charge measurements the situation is rather more com- plicated. The JETSET model contains many free parame- ters of which several influence the charge flow predictions. These parameters have been tuned individually by the ex- periments and it is not possible to define a common proce- dure to evaluate the errors due to light quark fragmentation. Fortunately these errors mm out to be relatively small, and they are assumed to be fully correlated even if the procedure to evaluate them is slightly different.
108 Table 2
ALEPH, DELPHI, I3 and OPAL Collabomtion /Nucl. Insrr. and Meth. in Phys. Res. A 378 (1996) 101-115
The variations in fractions of charm hadrons which are used to assess the systematic uncertainty. The first column shows which fraction is varied, the second shows which hadron fractions compensate the variation. and the third shows which fractions are kept fixed
Variable fraction Compensated by Fixed f( D”) = 0.557 f 0.053 f(Ds + AC) f(D+). f(Ds)lf(L) f( D+) = 0.248 f 0.037 f(Ds + AC) f(D” + D+) = 0.80 f 0.07 I(D’), f(4)//(&) f(Ds + AC) f(D’)/f(D+L f(Ds)lf(&) f(Ds) = 0.12 IJ_Z 0.05 f(k) f(D’). I@+) 4. Averaging procedure
As described above, the LEP experiments have to date published several measurements of each of the electroweak parameters considered in this paper. The aim is then to com- bine the 44 separate measurements to give the best estimate of the 7 desired heavy flavour parameters. The technique chosen is based on the method of Best Linear Unbiased Es- timate (BLUE) [ 21. A prerequisite of the averaging proce- dure is that the same set of assumptions for external inputs giving rise to systematic errors described above has been propagated through all the measurements. It should also be noted that the usual assumption that each contribution to the systematic emor is Gaussian distributed is implicit in this averaging procedure. In addition before being combined, all the forward-backward asymmetry measurements are trans- lated to a centre-of-mass energy of 4 = 9 1.26 GeV. This value was chosen so as to be close to the average fi value at which measurements were made so that the corrections are generally small. The Standard Model difference in asymme- try as a function of 6 from the ZFITTER program [ 50 ] is used to make the correction.
The best estimates of the 7 quantities to be determined are denoted XI’, where the index p corresponds to the pa- rameters:
X’= Rh, R,, A$, A& BR(b -+ a-),
BR(b --) c + !+), y. (5)
The individual measurements are denoted $, where the in- dex i runs in this case over the 44 measurements of the 7 quantities, and the index p is a convention to distinguish measurements of the different quantities. The x2 to be min- imized with respect to the parameters xp is then given by:
,g=C($-
xqc,T’(r;
-x’),ij
where C is the covariance matrix for all the heavy flavour measurements, in this case a 44 x 44 matrix. The calculation of the covariance matrix, taking into account the statistical correlations in any multiparameter fits, and systematic cor- relations due to common input parameters, is an essential part of the procedure. The dependence of any of the mea- surements < on one of the other electroweak parameters x”, Y # h is taken into account explicitly.
In summary, the procedure is:
- Define and propagate a consistent set of external inputs. - Form the full covariance matrix relating the measure-
ments.
- Take into account any explicit dependence of a measure- ment on the other electroweak parameters.
- Perform a x2 minimization with respect to the combined electroweak parameters.
After forming the best combined values of the observed electroweak quantities, small corrections are made to derive the underlying parameters of the Z boson. These corrections are described in Section 5.
4.1. Calculation of the covariance matrix C The covariance matrix can be written as: c = C”‘“’ + CSYS’.
The statistical covariance matrix, C”“‘, has the total statisti- cal error squared for each measurement, i, on the diagonal ( Ctm’). Some of the measurements are from a multiparam- eter fit, in which case the statistical correlation matrix for that set of measurements was provided by the experiment.
The systematic covariance matrix, CsYs’, was calculated from the detailed breakdown of systematic errors given by each experiment. The diagonal element, C,;ys’, is the square of the total systematic errOr for measurement i. If the signed systematic error on result < due to a source of systematic uncertainty p is written as si(p), then an off-diagonal ele- ment is given by:
Cy=
CSi(p)Sj(p). Pwhere the sum is over all sources of uncertainty, p, which are correlated between results i and j. Some errors, such as the error from Monte Carlo statistics, are uncorrelated for all results and therefore contribute only to the diagonal elements of Csys’ . Others, such as those connected with lepton identification, are correlated for any measurements made by the same LEP experiment. The remaining errors are assumed to be fully correlated for all measurements.
ALEPH. DELPHI, I3 and OPAL Collaboration /Nucl. Instr, and Meth. in Phy. Res. A 378 (19%) 101-115 109 4.2. Treatment of results which depend on other
electroweak parameters
If a measurement $ of the electroweak parameter x@ depends on the value of some other electroweak parameter
xy
,
v # CL, this dependence is taken into account explicitly. No separate error due to the uncertainty in x” is assigned to <. For example, if the kth measurement is a value of Rb from one of the precise double-tag analyses and depends explicitly on the value of R,, then the following expression is used for cSRb in the x2:‘k 4 = R;- + ak(Rc)(l?’ - R;Wd)/~Rc, (9)
where Rreas IS the measured value of & in the analysis which assumed a value of R, = Rixd, and Uk( R,) is the constant which determines the dependence on R,.
5. Corrections to the physical ohservables
For the interpretation of the observable physical param- eters, small corrections are made to derive the equivalent parameters for pure Z boson exchange.
The photon exchange contributions to Rb and RC are small. Defining the ratios of the Z partial widths, @ = I’(Z + bE)/F(Z + hadrons) and @ s F(Z --) cC)/I’(Z -+ hadrons) , these are given by:
R; = Ri, + 0.0003, R,” = R, - 0.0003. (10) In general, the measured asymmetries assume that the differential cross section has the form:
da 8
dcose 0: 1 +cos28+ -AFB cos@, 3 (11)
where f3 is the angle between the direction of the incom- ing electron and the outgoing quark. The event thrust axis is used as an estimate of the quark direction. The measured asymmetries are converted to the so called “pole asymme- tries” which am defined in terms of effective couplings of the Z to the fermions
A~.f= 3 2gAe &‘e 2 gAf gvf
FB
igAC2+@e2 gAf2+gVf2’
(12) where gvf and gAf denote the real parts of the vector and axial-vector couplings of the Z to the fermion f. Small cor- rections have to be applied to relate the measured asymme- tries to the pole asymmetries. The corrections are summa- rized in Table 3 and explained below:
- Energy shift correction: The slope of the asymmetry as a function of fi around mz depends only on the axial cou- pling and the charge of the initial and final state fermions and is thus independent of the pole asymmetry itself. - QED corrections: Initial state radiation reduces the effec-
tive centre-of-mass energy. Thus a correction similar in nature to the energy shift must be applied.
Table 3
Corrections to be applied to the quark asymmetries. The corrections are to be understood as AEB = AK + )?(GAFB)~
SOllICe fi=lQ QED corrections QCD corrections Y. YZ Total 6A$ 6A& -0.0013 -0.0034 +0.004 I +0.0104 +0.0033 rt 0.0010 +0.0023 f 0.0007 -0.ooo3 -0.0008 f0.0058 * 0.0010 +0.0085 l O.ooO7
- QCD corrections: The QCD corrections, using the thrust axis to define 8 for the event, have been calculated to first order, including mass corrections [ 5 1 ] a The correction is given by A%‘” = AzWD( 1 + c(Y~/~), with c = -0.79 for bottom and c = -0.87 for charm quarks. Assuming os( rni) = 0.12 and varying the renormalization scale between p2 = m$/4 and p2 = rni the correction factor is 0.966 f 0.004 for b quarks, and 0.963 f 0.004 for c quarks. There is an additional uncertainty in the QCD correction coming from whether the experimental event selection requirements bias the relative rates of 2- and 3-jet events in the sample. The error in the correction factor has therefore been increased to 0.010 for both b and c quarks. The resulting additive corrections to the asymmetries due to QCD effects are given in Table 3.
Although the measured asymmetries using a lepton or D* meson tag need to be corrected in this way for the ef- fects of QCD, the lifetime/hemisphere-charge measure- ments of the b asymmetry take into account QCD effects as an inherent part of the analysis [ 8- 101. To form a con- sistent average, the QCD correction for the b asymme- try of +0.0033 is therefore subtracted from each of these hemisphere charge measurements before combining with the other measurements.
- y exchange and yZ interference: These diagrams modify very slightly the asymmetry.
All corrections with the exception of those due to QCD have been determined using the ZFITI’ER program [ 50 1.
6. Summary of measurements and combined results The averaging procedure is illustrated here by applying it to published results. The measurements of the seven heavy flavour quantities are first tabulated in a standard format by the LEP collaborations. These tables include the detailed breakdown of the systematic errors of each measurement and its dependence on other electroweak parameters. If they differ from the original choice, the experiments propagate the agreed common values and ranges of input parameters through their analyses.
Examples of these tables with the full error breakdown for two individual analyses are given in the Appendix, in Tables 5 and 6. The effect of common systematic errors is
110 ALEPH, DELPHI, L3 and OPAL Collaboration /Nucl. Instr. and Meth. in Phys. Res. A 378 (19%) 101-l I5
o.180
r---T
I c-l>/
.
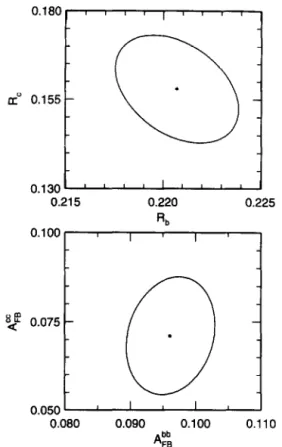
II” 0.155 0.215 0.220 0.225 R: = 0.158 f 0.010, 0.050 - 0.080 0.090 0.100 0.110 Abb FBFig. 3. The combined values of (a) Rb and RC (b) A% and A:\. with
the central value and 68% CL. contour plotted in each case.
most important in the case of &,. The common errors for the double-tag measurements of Rb, plus the L3 event shape analysis which also measures this single parameter, are given in Table 7. The full set of measurements is also summarized in the appendix in Tables 8-14, where the statistical and systematic errors are quoted separately.
Using the full averaging procedure gives the following combined results for the seven parameters:
Rt, = 0.2206 f 0.0021, R, = 0.159 f 0.010, A% = 0.0956 f 0.0045, A% = 0.07 1 f 0.011, BR(b --+ !?-) = 0.1090f 0.0039, BR( b + c --+ !+) = 0.0836 f 0.0052, ,=0.1240f0.0089.
The overall X*/d.o.f. is 21/(44 - 7)) indicating that the measurements are self-consistent, and the correlation matrix is given in Table 4. These combined results are shown in Fig. 3, where the effect of the correlations between Rb and
RC, and between A% and A% can be seen. As an example to illustrate the effect of the correlations, the value of Rb with
Rc fixed to its expected Standard Model value is: Ri,( R, = 0.172) = 0.2195 f 0.0019.
After calculating the overall averages, the corrections de- scribed in Section 5 were made to the average peak asym- metries to derive the pole asymmetries, and to Rb and RC to account for photon exchange. The main electroweak results can then be summarized using the ratios of partial widths of the Z boson and the pole asymmetries A”;B” and A$
R; = 0.2209 f 0.0021,
AK =0.1014 f 0.0046,
Ag = 0.079 f 0.011.
The correlations between the results given in Table 4 are still valid for these corrected quantities.
Several cross checks were made in order to ensure that the combined estimate is reliable, such as just using the mea- surements of one parameter and using approximate methods to estimate their relative weights. For example, forming an average of & measurements, making the naive assumption that the smallest common systematic error is fully corre- lated gives &,(& = 0.172) = 0.2192 f 0.0021, compared with the result of the full fit which was &,( RC = 0.172) = 0.2195 f 0.0019. Differences between the results of the full procedure and the simpler weighted averages are small, typ- ically less than 20% of the error, thus giving confidence that the complete procedure has been implemented correctly. 6.1. Dominant sources of error
Both Rb and RC are currently dominated by systematic er- rors. For Rb. with RC fixed to its Standard Model value, the approximate statistical and systematic errors are 0.0012 and 0.0015. The dominant contributions come from the mod- elling of the charm sector accounting for a total of 0.0011. Due to the large lifetime difference of the different charmed hadrons the largest of the charm systematics arises from the assumptions of the D production fractions (0.0008). The er- rors concerning the modelling of light quark fragmentation combine to 0.0006. It should be noted that the assumptions on the gluon splitting into heavy quarks, which are some- what uncertain, contribute only 0.0003.
The errors from the hemisphere correlation are smaller than those due to the charm background in each individ- ual analysis. To understand and account for all the possible contributions to the hemisphere correlations is one of the most difficult aspects of the double-tag analyses, and is cur- rently an area of particularly active study within the LEP collaborations. A more thorough treatment of this source of uncertainty should be developed in the future. At present, the errors from the hemisphere correlation are derived from comparisons of data with individually tuned Monte Carlo
ALEPH, DELPHI, L3 nnd OPAL Collaboration /Nucl. fnstr. and Meth. in Phys. Res. A 378 (19961 IOI-IIS 111 Table 4
Error correlation matrix of the combined elecuoweak parameters. Here BR( 1) and BR(Z) represent BR( b + e- ) and BR(b -) c -+ e+) respectively Rh RC Ab6 FB ‘,pE FB WI) BW) x Rb 1:oo -0.39 -0.05 0.07 -0.19 -0.10 -0.02
RC -0.39 I .a0 0.16 -0.09 0.08 0.24 0.00
AK -0.05 0.16 I .m 0.19 0.13 -0.08 0.24
BEI) Ati -0.19 0.07 -0.09 0.08 0.19 0.13 0.17 1 .I0 0.17 1.00 -0.22 -0.34 0.10 0.34
BR(2) -0.10 0.24 -0.08 -0.22 -0.34 1.00 -0.41
F -0.02 0.00 0.24 0.10 0.34 -0.41 1.00
simulations and typically reflect the limited statistical pre- cision of the data samples. They are therefore assumed to be independent between the different experiments. Nonethe- less, there are likely to be some common uncertainties from this source. The change in & if this error is assumed to be fully correlated between measurements is less than 0.0003, and the change in the total error in Rb is less than 0.0001.
For R, the approximate error splitting gives 0.005 for the statistical and 0.008 for the systematic error. Presently the measurements using leptons and those using D meson production rates contribute with about equal weight. For the inclusive lepton analyses the available number of events is currently not sufficient to determine Rc and BR(c -+ .!?+) simultaneously, thus leading to an error of about 0.005 from the assumption on this branching ratio. Due to the relatively poor separation between the leptons from charm and those from photon conversions, hadron decays and misidentified hadrons, the errors from these sources combine to 0.004. The published measurements of R, using D mesons compare production rates at the Z with those at lower energies. The errors of those analyses are dominated by the low energy measurements leading to an uncertainty of 0.004 in Rc.
For A$ the statistical error is about f0.0040 and the systematic error f0.0019, while for A% the splitting is f0.0096 (statistical) and f0.0060 (systematic). In both cases the systematic uncertainties include a large contribu- tion from experimental effects not correlated between the different experiments.
7. Conclusions
A procedure for combining measurements of heavy flavour electroweak quantities by the LEP experiments has been described, which takes into account correlations be- tween the measurements. The procedure relies on a detailed breakdown of the systematic errors for each measurement. The sources of systematic uncertainty considered here, as well as the values and ranges of the parameters controlling them, are those used to date by the LEP experiments. In the future they will be updated in the light of new analyses at LEP and elsewhere. Measurements published to date include typically one third of the total LEP data sample accumulated at centre-of-mass energies around the Z. How-
ever, the total errors for Rt, and Rc already include a large systematic contribution. Applying the procedure to these published measurements gives:
R; = 0.2209 f 0.0021,
R: =0.158 f 0.010,
A;; = 0.1014 f 0.0046,
A% = 0.079 f 0.011,
with correlations between the results as given in Table 4. Acknowledgements
It is a pleasure to thank the CERN SL Division for the efficient operation of the LEP accelerator, and their contin- uing close cooperation with our experimental groups. The LEP experiments are also indebted to the technical staff at all the collaborating institutes, and the funding agencies for their support in building and operating the detectors.
Appendix A
A number of illustrative tables are included in this ap- pendix. The first two tables are examples of the full error breakdown for an individual analysis (Tables 5 and 6). Ta- bles such as these are needed for every measurement to re- produce the full procedure. Table 7 gives the common er- rors for the double-tag Rb measurements. The remaining ta- bles summarize all the measurements. In these tables, small changes to the numbers quoted in the original publication are made, due to propagating common assumptions on sys- tematic errors to give the numbers used for the combina- tion. In general, statistical errors and errors called “internal” are not correlated among the measurements. The sign of the other errors indicates their correlation with the parameter describing the source of the error. For sources common to the four LEP experiments, these parameters are defined in Table 1. Errors arising From explicit dependences on other electroweak parameters are not included in these tables, and it should be recalled that measurements from lepton fits are correlated with other electroweak parameters.
112 ALEPH, DELPHI, I3 and OPAL Collaboration /Nucl. Instr. and Meth. in Phys. Res. A 378 (1996) 101-115
Table 5
DELPHI measurements of asymmetries using a lepton tag [91. The statistical correlation coefficient between the two measurements is 0.27. The coefficients
a(x) are defined in Section 4.2
4 91.27 91.27
Result used for average 0.1057 0.0801
statistics 0.0128 0.0225 Muon identification +0.0020 +0.005 1 Electron identification +0.0015 f0.0025 Track resolution f0.0013 +0.0009 Background asymmetry -0.0012 +0.0102 Internal +0.0013 +0.0045 :x?,’ -O.oool -0.0005 x c +0.0011 +0.0001 Br(b + Z - F-1 io.0007 iO.0038 Br(c --, e+) +0.0004 -0.0037 Semileptonic model b - !- +0.0004 -0.0060 Semileptonic model c - e+ +0.0018 -0.0013 Total systematic 0.0040 0.015 (Use Rb = 0.217) a(Rb) -0.029 +0.029 (Use Rc =0.171) @(Kc) +0.011 -0.065
(Use~=O.121) o(7) +0.034 +o.OOO
(Use BR(b + e-) = 11.0%) o(BR(b - !-)) -0.039 +0.049 (Use BR(b - c * !+) = 7.9%) a(BR(b + c -) l+)) +0.005 -0.040
Table 6
OPAL asymmetry measurement using jet charge and a vertex tag [ 101. The coefficients (1(x) are defined in Section 4.2
6
Result used for average
statistics
Monte Carlo statistics Track resolution Internal
B decay multiplicity Light quark fragmentation
Total systematic
(Use R,, = 0.216) a(&,) (Use Rc = 0.173) a(&) (Use A$O.O61) o(A&)
91.25 0.0973 0.0067 0.0013 +0.002 I 0.0018 f0.0005 +0.0024 0.0039 -0.1009 +0.0011 f0.007 I
ALEPH, DELPHI, L3 and OPAL Collabomtion /Nucl. Instr. and Meth. in Phys. Res. A 378 (1996) 101-115 113
Table I
Example of the breakdown of the correlated systematic error for Rb from lifetime, multiple and shape double-tag measurements (in units of 10e3)
ALEPH shape I61 ALEPH lifetime [31 DELPHI multiple [41 L3 shape 171 OPAL multiple (51
Charm production 0.0 -0.85 -IS 0.0
Do lifetime 0.0 -0.28 -0.3 0.0 D+ lifetime 0.0 -0.36 -0.4 0.0 Ds lifetime 0.0 -0.22 -0.3 0.0 D decay multiplicity 0.0 -0.57 -0.5 0.0 BR(D-K”) 0.0 0.0 f0.7 0.0 g + bb,cc 0.0 -0.33 -0.2 0.0
Long-lived light hadrons 0.0 -0.24 -0.8 0.0
BR(c -+ e+) +0.6 0.0 -0.3 0.0 Semilept. model c - e+ -2.1 0.0 -0.2 0.0 &Cc)) +0.8 -0.12 -0.4 f1.8 Semilept. model b - E- -1.3 0.0 0.0 0.0 @E(b)) 0.0 0.0 0.0 -3.1 -0.89 -0.22 -0.28 -0.17 -0.73 +0.57 -0.48 -0.49 -0.28 -0.24 -0.72 0.0 Total 2.7 1.2 2.1 3.6 I.8 Value of Rc used 0.165 0.171 0.171 0.171 0.171 a(&) -0.0041 -0.0138 -0.0195 -0.0209 -0.0187 Table 8
The measurements of Rb. The upper block corresponds to the non-lepton tag analyses. which are typically measurements of Rb only; the second block of
results are from fits to the lepton spectra
Experiment Method Data Quoted used
ALEPH lifetime 92 0.2192 f 0.0022 f 0.0026 0.2187 f 0.0022 f 0.0025 ALEPH shape 90-91 0.228 f 0.005 zt 0.005 0.228 f 0.0054 f 0.0048 DELPHI lifetime 91-92 0.2217 f 0.0020 f 0.0029 0.2217 f 0.0020f 0.0029 L3 shape 91 0.222 f 0.003 f 0.007 0.222 f 0.003 f 0.007 OPAL multiple 92-93 0.2171 f 0.0021 f 0.0021 0.2171 f 0.0021 zt O.M)21
ALEPH lepton 90-9 I 0.219 f 0.006 f 0.005 0.2162 f 0.0062 f 0.0050 DELPHI lepton 91-92 0.2145 f 0.0089 f 0.0067 0.2145 f 0.0089 f 0.0067 OPAL lepton 90-91 0.222 f 0.01 I f 0.007 0.225 f 0.01 I f 0.007
Table 9
The measurements of Rc. The upper block corresponds to the non-lepton tag analyses, which are typically measurements of Rc only; the second block of results are from fits to the lepton spectra
Experiment Method Data Quoted Used
DELPHI D 91 0.187 f 0.031 f 0.023 0.187 f 0.027 f 0.028
OPAL D* f 90-92 0.142 f 0.008 f 0.014 0.142 f 0.008 f 0.014
ALEPH lepton W-91 0.165 f 0.005 f 0.020 0.1670 f 0.0054 f 0.0188
114
Table 10
ALEPH, DELPHI, W and OPAL Coflaboration /Nucl. Insrr. and Merh. in Phys. Res. A 378 (1996) 101-l I5
The measurements of A:\. The upper block corresponds to the jet-charge analyses, which are measurements of A% only, with the QCD correction already applied; the second block are those using charmed hadron tags, and are correlated with the AC& values determined at the same time; the third block of results are from fits to the lepton spectra
Experiment Method Data Quoted Used
ALEPH jet 90-93 0.0992 f 0.0084 f 0.0038 0.0992 f 0.0084 f 0.0038 DELPHI jet 92 0.1 I5 f 0.017 f 0.010 0.115f0.017f0.010 OPAL jet 91-94 0.0963 f 0.0067 f 0.0038 0.0973 f 0.0067 f 0.0038 DELPHI D’f 91-92 0.059 f 0.062 f 0.024 0.059 f 0.062 f 0.024 OPAL D** 90-92 0. I39 It 0.097 f 0.049 0.139 f 0.097 f 0.049 ALEPH lepton 90-91 0.090f 0.013 * 0.003 0.086 f 0.014 f 0.0026 DELPHI lepton 91-92 0.104 f 0.013 f 0.004 0.1057 f 0.0128 f 0.005 L3 lepton 90-92 0.087 f 0.01 I f 0.004 0.0938 f 0.0110 f 0.0041 OPAL lepton 90-9 I 0.092 f 0.018 f 0.008 0.092 f 0.018 f 0.008 Table 11
The measurements of A&. The upper block are those using charmed hadron tags, and are correlated with the A$ values determined at the same time; the second block of results are from fits to the lepton spectra
Experiment Method ALEPH D*f DELPHI D’f OPAL D** ALEPH lepton DELPHI lepton L3 lepton OPAL lepton Data Quoted 91-93 0.0699 f 0.0205 f 0.0102 91-92 0.077 f 0.029 f 0.012 90-92 0.038 f 0.044 i 0.010 90-91 0.111 f0.021 f0.018 91-92 0.083 f 0.022 f 0.016 90-91 0.083 f 0.038 f 0.027 90-91 0.014 f 0.030 i 0.020 Used 0.0699 f 0.0205 f 0.0102 0.077 f 0.029 f 0.012 0.038 i 0.044 f 0.010 0.091 f 0.020 f 0.019 0.0801 f 0.0225 f 0.016 0.0784 f 0.0370 f 0.0266 0.014 f 0.030 f 0.020 Table I2
The measurements of BR(b + e-j
Experiment ALEPH DELPHI OPAL Method lepton lepton lepton Data 90-9 I 91-92 90-91 Quoted 0.114 f 0.003 f 0.004 0.1121 +0.0045*0.0060 0.105 f 0.006 f 0.005 Used 0.1120 * 0.0033 f 0.0042 0.1121 f 0.0045 f 0.0060 0.105 f 0.006 f 0.007 Table 13 The measurements of BR(b + c + @) Experiment ALEPH DELPHI OPAL Method lepton lepton lepton Data Quoted 90-91 0.082 f 0.003 f 0.0 I2 91-92 0.0770 f 0.0049 f 0.0112 90-91 0.077 f 0.004 f 0.007 Used 0.0881 f 0.0025 f 0.0080 0.0770 f 0.0049 f 0.0112 0.083 & 0.004 -+ 0.007 Table I4 The measurements of X Experiment ALEPH DELPHI L3 OPAL Method lepton lepton lepton lepton Data Quoted 90-91 0.114 f 0.014 & 0.008 91-92 0.150 f 0.020 f 0.015 90-92 0.123i0.012f0.008 90-91 0.143 f 0.022 f 0.007 Used 0.109 f0.014 f 0.0108 0.150 f 0.020 f 0.015 0.1243f0.012f0.0081 0.144 f 0.022 f 0.007