Automatic Detection of Epileptic Seizure Onset
and Termination using Intracranial EEG
by
Alaa Amin Kharbouch
Submitted to the Department of Electrical Engineering and Computer
Science
in partial fulfillment of the requirements for the degree of
Doctor of Philosophy in Electrical Engineering
at the
MASSACHUSETTS INSTITUTE OF TECHNOLOGY
June 2012
@
Massachusetts Institute of Technology 2012.
SSACHUSErrS iNST F TECHOLOGY7
SJUL~ 0
12
ULBRARIES
ARCHIVES
All rights reserved.
A uthor ...
...
Department of Electrical Engineering and Computer Science
March 20, 2012
Certified by
V\~7John V. Guttag
Professor of Electrical Engineering and Computer Science
Thesis Supervisor
Accepted by ...
L~lie
A. Kolodziejski
Chair, Department Committee on Graduate Students
Automatic Detection of Epileptic Seizure Onset and
Termination using Intracranial EEG
by
Alaa Amin Kharbouch
Submitted to the Department of Electrical Engineering and Computer Science on March 20, 2012, in partial fulfillment of the
requirements for the degree of
Doctor of Philosophy in Electrical Engineering
Abstract
This thesis addresses the problem of real-time epileptic seizure detection from in-tracranial EEG (IEEG). One difficulty in creating an approach that can be used for many patients is the heterogeneity of seizure IEEG patterns across different patients and even within a patient. In addition, simultaneously maximizing sensitivity and minimizing latency and false detection rates has been challenging as these are com-peting objectives. Automated machine learning systems provide a mechanism for dealing with these hurdles. Here we present and evaluate an algorithm for real-time seizure onset detection from IEEG using a machine-learning approach that permits a patient-specific solution. We extract temporal and spectral features across all in-tracranial EEG channels. A pattern recognition component is trained using these feature vectors and tested against unseen continuous data from the same patient. When tested on more than 875 hours of IEEG data from 10 patients, the algorithm detected 97% of 67 test seizures of several types with a median detection delay of 5 seconds and a median false alarm rate of 0.6 false alarms per 24-hour period. The sensitivity was 100% for 8 out of 10 patients. These results indicate that a sensitive, specific and relatively short-latency detection system based on machine learning can be employed for seizure detection tailored to individual patients.
In addition, we describe and evaluate an algorithm for the detection of the ces-sation of seizure activity within IEEG. Seizure end detection algorithms can enable important clinical applications such as the delivery of therapy to ameliorate post-ictal symptoms, the detection of status epilepticus, and the estimation of seizure duration. Our machine-learning-based approach is patient-specific. The algorithm is designed to search for the termination of electrographic seizure activity once a seizure has been discovered by a seizure onset detector. When tested on 65 seizures, 88% of all seizure ends were detected within 15 seconds of the time determined by a clinical expert to represent the electrographic end of a seizure.
We explore the effects of channel pre-selection on seizure onset detection. We evaluate and present the results from a seizure detector that has been restricted to use only a small subset of the channels available. These channels are manually
chosen to be those that show the earliest ictal activity. The results indicate that performance can suffer in many cases when the algorithm uses a small set of selected channels, often in the form of an increase in false alarm rate. This suggests that the inclusion of a full channel set allows the system to leverage information that is not readily apparent to a clinical reader (from regions seemingly not involved in the onset) to better differentiate ictal and inter-ictal patterns. Finally, we present and evaluate an algorithm for patient-specific feature extraction, where the feature extraction process for a given patient leverages the training data available for that patient. The results from an evaluation of a detector that supplemented the original spectral energy features with features computed in a patient-specific manner show a significant improvement in 3 out of 5 patients. The results suggest that this is a promising avenue for further improvement in the performance of the seizure onset detector.
Thesis Supervisor: John V. Guttag
Acknowledgments
I would like to thank my advisor, John Guttag, for giving me perspective and
guid-ance when I needed it, and his generosity with his time. I would like to thank Dr. Sydney Cash for the many things he has taught me, and his hands-on approach. I would also like to thank Bill Freeman for his time and effort in his role as a committee member.
I would like to thank my friends, including Zahi, Demba and Paul. I would like to thank Ali Shoeb for being a mentor and a friend.
I would like to thank my family, especially my parents. Many people think their
Contents
1 Introduction 15
1.1 Epilepsy . . . . 15
1.2 Seizure Onset Detection . . . . 16
1.3 Seizure End Detection . . . . 19
1.4 Intracranial EEG . . . . 19
1.5 Previous work . . . . 21
1.6 Contributions . . . . 23
1.7 Thesis Outline. . . . . 24
2 Algorithm for Seizure Onset Detection 27 2.1 Feature Vector Extraction and Classification . . . . 27
2.1.1 Training and Classification . . . . 30
2.1.2 Artifact Rejection . . . . 30
2 .2 D ata . . . . 3 1 2.3 Evaluation Methodology . . . . 32
2.4 Results . . . . 33
2.4.1 Sensitivity and Latency . . . . 36
2.4.2 False Alarms . . . . 38
2.4.3 Reduction of K parameter . . . . 41
2.5 Discussion . . . . 42
2.5.1 False Alarm Generation and Evaluation . . . . 42
3 Seizure End Detection in Intracranial EEG 45
3.1 Seizure End Detection Algorithm and Evaluation . . . . 46
3.1.1 Data and Evaluation . . . . 47
3.2 Results and Discussion . . . . 49
4 Channel Pre-selection and Patient-Specific Feature Extraction in Seizure Onset Detection 57 4.1 Channel Pre-selection Examples . . . . 58
4.2 Performance of Onset Detection Algorithm With Channel Pre-selection 64 4.3 Patient-Specific Feature Extraction . . . . 67
4.3.1 Feature Extraction Steps . . . . 71
4.3.2 Dictionary Learning Method . . . . 73
4.3.3 Seizure Onset Detection with PSFE Results . . . . 75
4.3.4 Future W ork . . . . 77 5 Summary and Discussion 81
List of Figures
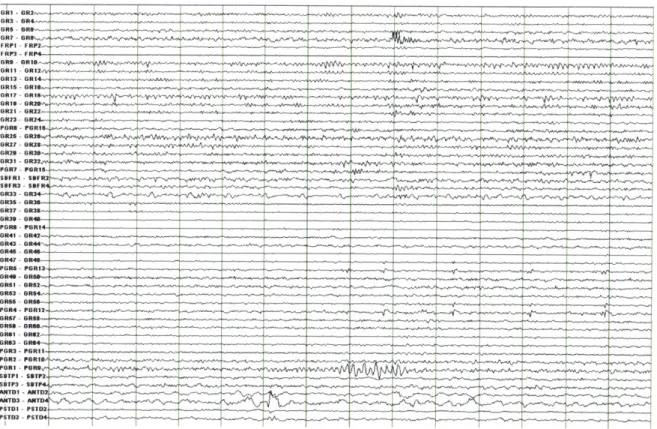
1-1 A 14-second window of intracranial EEG during an inter-ictal (i.e.
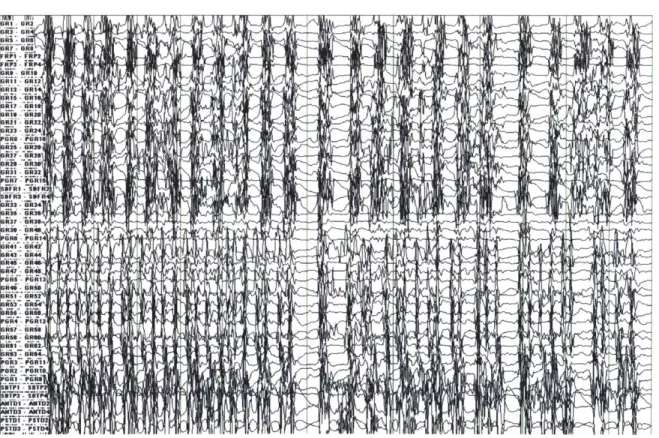
non-seizure) period. . . . . 20 1-2 A 14-second window of intracranial EEG during a seizure . . . . 22
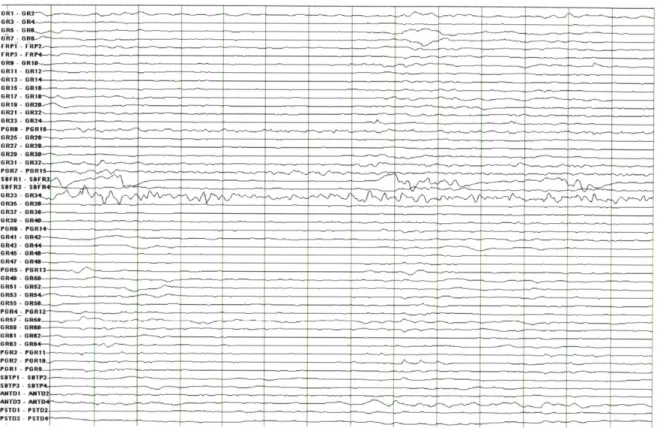
1-3 A 14-second window of intracranial EEG during a post-ictal period,
beginning less than 90 seconds after the expert-marked electrographic end of a seizure. . . . . 25
2-1 Feature vector formation steps. . . . . 29
2-2 Intracranial EEG on a subset of channels in a 8-second epoch con-taining the onset of a Patient 5 seizure. The expert-marked onset is indicated by the dark vertical line, and the approximate time at which the algorithm detected the seizure is indicated by the red dotted line. 35 2-3 Intracranial EEG on a subset of channels in a 12-second epoch
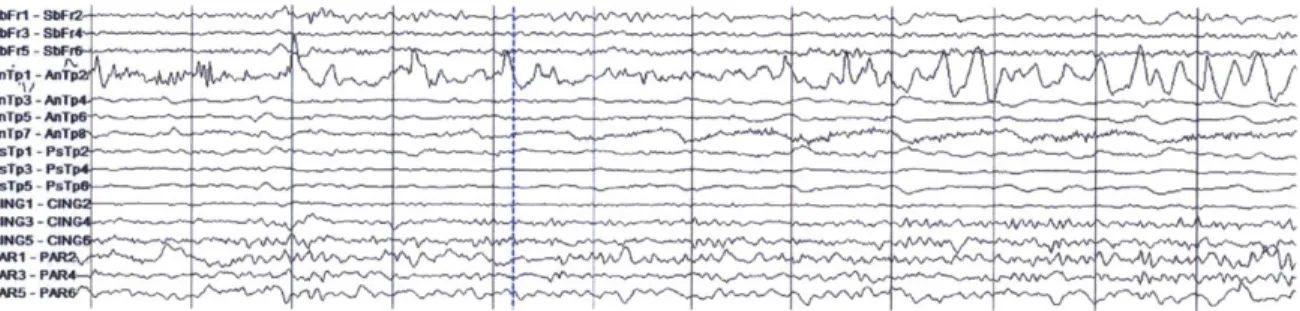
contain-ing the onset of a Patient 6 seizure. The dashed vertical line indicates the expert-marked onset. . . . . 36
2-4 Intracranial EEG on a subset of channels in a 12-second epoch con-taining the onset of a Patient 6 seizure different from that of Figure
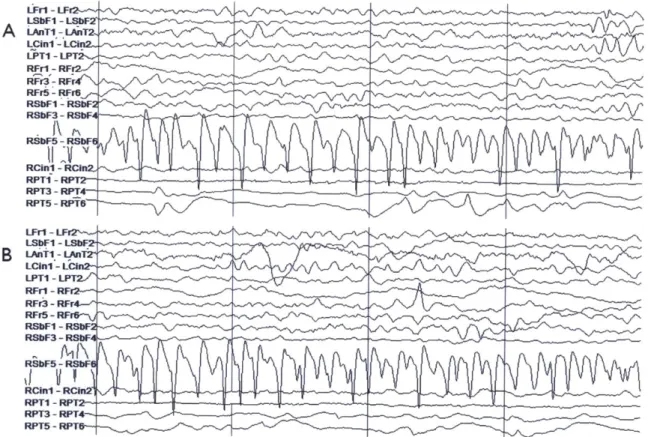
2-5 Patient 7 intracranial EEG on a subset of electrodes in two epochs showing similar activity, particularly on the right subfrontal channel 'RSbF 5 - RSbF 6'. (A) Seizure activity in a 4-second epoch begin-ning approximately 10 seconds after the expert-marked onset. (B) An interictal 4-second epoch during which false detection occurred. This activity was not judged to constitute a seizure by the clinicians. . . . 39
2-6 Patient 7 intracranial EEG on a subset of electrodes in two epochs
showing similar activity, particularly on the right posterior temporal channels 'RPT 3- RPT 4' and 'RPT 5- RPT 6'. (A) Seizure activ-ity in a 4-second epoch beginning approximately 7 seconds after the expert-marked onset. (B) An interictal 4-second epoch during which false detection occurred. As before, this activity was not judged to constitute ictal activity by clinical reviewers. . . . . 40
2-7 Approximate timing of false alarms that occurred in tests on Patient 8 data... ... 43
3-1 A 30-second window of intracranial EEG during a Patient 2 seizure
omitted from the end detection study. Many channels are artifact-obscured for much of its duration. . . . . 48
3-2 A 20-second window of intracranial EEG during a Patient 1 seizure.
Whereas the high amplitude activity comes to a halt for most channels during this epoch, near-periodic activity (with decreased amplitude) continues on a few channels. A premature end detection was obtained for this seizure. The expert-marked seizure end is approximately 45 seconds after the end of this window . . . . 51 3-3 A 20-second window of intracranial EEG from Patient 1 showing the
expert-marked end of a seizure (blue dotted line). Ictal activity ends abruptly on all channels nearly simultaneously, in contrast to the seizure
3-4 A 15-second window of intracranial EEG from a Patient 5 seizure, during which an early seizure end detection occurs. The seizure starts with ictal activity present in both the temporal lobe (as evidenced by the channels labeled 'RAT' and 'RPT'), and the frontal lobe ('RSbF' and 'RPsF' channels). The activity ceased in the temporal lobe, but continued (albeit somewhat attenuated and altered) in the frontal lobe. 53
3-5 A 15-second window of intracranial EEG from Patient 5 seizure starting
after the window shown in Figure 3-4. The frontal lobe activity ('RSbF' and 'RPsF' channels) has evolved leading up to this period, and the algorithm correctly classifies these epochs as ictal after a premature seizure end has been declared. . . . . 54
3-6 A 7-second window of intracranial EEG from a Patient 7 seizure during
which an early seizure end is declared by the algorithm. This period features high-amplitude ictal activity on the channel labeled
'LAnTI-LAnT2' ... ... 56
4-1 A 6-second window of intracranial EEG from a Patient 2 seizure show-ing the onset. The onset is indicated by the dotted blue line. The seizure begins with spikes on 3 channels labeled 'RAT1-RAT2', 'RAT3-RAT4' and 'RPT1-RPT2', followed by activity which evolves and be-com es rhythm ic. . . . . 59
4-2 A 6-second window of intracranial EEG showing the onset of another
Patient 2 seizure. The onset is indicated by the dotted blue line. The seizure also begins with spikes on 3 channels labeled 'RATI-RAT2',RAT3-RAT4' and 'RPT1-RPT2', followed by rhythmic activity. 60 4-3 A 7-second window of intracranial EEG from a Patient 1 seizure
show-ing the onset. The onset is indicated by the dotted blue line. The onset activity appears on the channels labeled 'ANTD' and 'PSTD', which correspond to temporal lobe depth electrodes . . . . 62
4-4 A 7-second window of intracranial EEG showing the onset of another Patient 1 seizure. The onset is indicated by the dotted blue line. Unlike the other two seizures recorded from this patient, the seizure begins with small-amplitude rhythmic activity on the channel labeled 'PGR8-P G R 13'. . . . . 63
4-5 A 6-second window of intracranial EEG recorded from Patient D during which a false alarm occurred. The two channels that were pre-selected for this patient are labeled 'RAT1-RAT2' and 'RPT1-RPT2'. The onsets of a few of this patient's seizures feature similar activity . . . . 66
4-6 A high-level view of the algorithm with the original feature extraction strategy, as described in Chapter 2. . . . . 68
4-7 High-level illustration of the algorithm steps with the proposed patient-specific feature extraction method . . . . 69
List of Tables
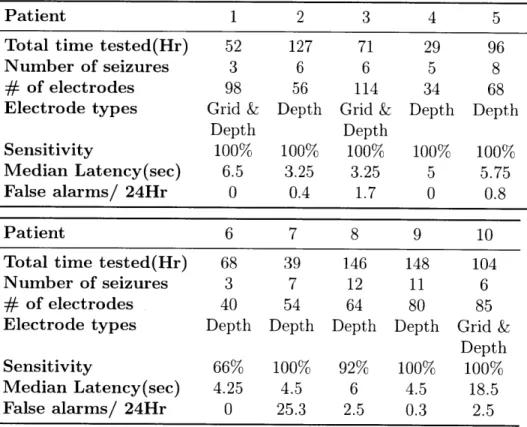
2.1 Patient data set information, and sensitivity, median latency, estimated false alarm rate obtained for each patient data set from evaluation of the seizure onset detector. . . . . 34 2.2 Sensitivities, median latencies and false alarm rates for the particular
case where K=1. The latencies decrease at the expense of higher false alarm rate. . . . . 42
3.1 Patient data set information for the database used to evaluate the seizure end detector. . . . . 47
4.1 Patient data set information for the database used to evaluate the seizure end detector with channel pre-selection. . . . . 64 4.2 Sensitivities, median latencies and false alarm rates obtained for each
patient data set from evaluation of the seizure onset detector with channel pre-selection. . . . . 64 4.3 Sensitivities, median latencies and false alarm rates obtained for each
patient data set from evaluation of the seizure onset detector using a full channel set. . . . . 65
4.4 Sensitivities, median latencies and false alarm rates obtained for each patient data set from evaluation of the seizure onset detector using Patient-Specific Feature Extraction (PSFE). . . . . 76
4.5 Sensitivities, median latencies and false alarm rates obtained for each patient data set from evaluation of the seizure onset detector with chan-nel pre-selection using the patient non-specific spectral energy features o n ly. . . . . 76
Chapter 1
Introduction
1.1 Epilepsy
Epilepsy is a neurological disorder that is characterized by the recurrence of seizures. The clinical symptoms of seizures can include convulsive movements, as well as alter-ations in behavior, sensation and consciousness. It is estimated that approximately
1% of the general population suffers from epilepsy, including more than 2.5 million
people in the United States. For more than 20% of epilepsy patients, neither medica-tions (which may be associated with negative side-effects) nor resective surgery (which requires intensive and invasive investigation), result in the elimination of seizures or constitute a sufficient treatment [32, 14, 21]. One of the most disruptive and disabling aspects of epilepsy is the uncertainty as to when the next seizure will strike.
Electrical activity in various areas of the brain can be measured through the place-ment of electrodes on the scalp, on the surface of the brain or within its depths. This neurophysiological data is broadly referred to as EEG (intracranial EEG is abbrevi-ated as IEEG), and is often recorded for diagnostic purposes. The beginning of the measured electrical activity associated with the seizure is referred to as the
electro-graphic onset. When the seizure is associated with clinical symptoms, the clinical onset is the point in time when clinical symptoms are first observed. The end of
the electrographic activity associated with a seizure marks the seizure end, or seizure termination. While most seizures are self-terminating, and usually last less than 5 minutes, the serious state of persistent (and seemingly indefinite) seizure activity, known as status epilepticus, is associated with a significant risk of mortality. The
seizure itself is referred to as the ictal period (and seizure-related electrical activity as ictal activity), the period that immediately follows the end of a seizure is known as the post-ictal period. The post-ictal period itself is sometimes associated with clinical symptoms.
1.2 Seizure Onset Detection
Epilepsy is a disease characterized by recurrent episodes of dysfunctional brain activ-ity. Yet, current approved therapies do not take into account the episodic nature of epileptic seizures. Therefore, a goal of current research is to develop seizure-triggered diagnostic, therapeutic and alerting systems. Central to these systems is an algorithm that can detect seizure activity early and accurately. In this thesis, we describe the architecture and performance of a real-time intracranial EEG (IEEG) seizure onset detector. Throughout this thesis, a seizure onset is considered to be the earliest point of unequivocal change in the IEEG waveforms leading up to a seizure, as judged by an expert electroencephalographer.
Two important considerations when assessing the performance of an automatic seizure onset detector are the delay between the seizure onset and the detection time, referred to as the detection latency, and the frequency of the occurrence of false detections, referred to as the false alarm rate. The reduction of latency and the lowering of false alarm rates are competing objectives, and the extent to which one is favored over the other is dictated by the application. Consider the example of a device that can detect a seizure's onset and deliver an electrical stimulation in response, which is designed to reduce the length or intensity of seizures. Low latencies are crucial for triggered neurostimulation applications, since the effectiveness of the therapy is delay-sensitive. In the case of an alerting application in a hospital setting, a low false alarm rate decreases the likelihood that alarms raised during seizures will be ignored by caregivers (or have the response to them delayed). If automated seizure detection is used to initiate the delivery of a drug (e.g. an anticonvulsant), then in
Rapid and reliable seizure onset detection from IEEG is challenging for a num-ber of reasons. First, IEEG varies greatly across individuals with epilepsy [7]. The intracranial EEG associated with seizure onset in one patient can closely resemble a benign pattern within the IEEG of another patient. Furthermore, for individ-ual patients there exists significant overlap in the IEEG associated with seizure and non-seizure states. In addition to inter-patient variability, there is also intra-patient variability. The identity of the IEEG channels involved and the evolution of the ear-liest seizure activity can differ within an individual, particularly when seizures arise from different brain regions. Moreover, the IEEG of epilepsy patients transitions between regimes within both the seizure and non-seizure states, and is therefore a non-stationary process.
Previous work has introduced a wide variety of techniques for seizure detection using IEEG. Results from these studies show that many of the techniques struggle with high latencies or high false alarm rates or both. Furthermore, some aspects of these studies remain to be addressed. First, most IEEG detection studies use relatively short records; past studies have used no more than 30 hours per patient, and considerably less than 24 hours for many patients [23, 17, 12, 1]. This may lead to an inaccurate estimate of the false alarm rate and may not faithfully represent long-term performance in a clinical application.
In addition, previous work in the area of intracranial EEG seizure detection has focused on datasets with a small number of pre-selected electrodes[23, 1, 24, 28]. This may ignore useful information that is not obvious on visual examination, and in some cases necessitates additional assessment and culling of the dataset by an expert.
We treat seizure detection as a binary classification problem that involves sep-arating seizure activity from non-seizure activity, and employ a machine-learning approach that is patient-specific, i.e., the classifier for each patient is trained using seizure and non-seizure examples (labeled as such) which have been extracted from the same patient's IEEG data. The division of a record of the brain's electrical activ-ity by an expert into two encompassing classes, seizure and non-seizure, is consistent with standard clinical practice. We extract from each epoch features that correspond
to the log-energy in several frequency bands for every channel. A Support Vector Ma-chine is trained using these feature vectors, and this constitutes the classifier which is tested against unseen continuous data from the same patient. This is similar to the approach to scalp EEG seizure detection of Shoeb et al [30, 29]. Our evaluation uses more than 875 hours of intracranial EEG in total, averaging more than 87 hours of continuous IEEG data per patient. We also present results from a study that uses the full set of intracranial electrodes of sufficient recording quality. The algorithm detects seizures by examining the short-term evolution of spectral properties of the intracranial EEG across many channels and comparing time periods between seizures with seizure activity itself. Relative to previously published methods, ours exhibits high sensitivity, short latencies, and low false alarm rates.
We also explore the effects of channel pre-selection on seizure onset detection. We evaluate and present the results from a seizure detector that has been restricted to use only a small subset of the channels available. These channels are manually chosen to be those that show the earliest ictal activity. In this context, we also present and evaluate an algorithm for patient-specific feature extraction. With this approach, the process for computing features from each channel for a given patient leverages the training data available for that patient. This approach is designed to yield additional salient features that can be combined with the original feature set to lead to improved detection performance. The feature extraction process involves the representation of an epoch of IEEG on a channel as a linear combination of prototype components, which we refer to as dictionary elements. To learn a dictionary, the method generally seeks signal components that have a large presence in one class (e.g., seizure onsets), but are largely absent from another class. The discriminative value of a direction is quantified as the difference in the total power in that direction between the two classes. We compare the results using this approach for feature extraction against those obtained for the seizure detection with channel pre-selection using the generic
1.3 Seizure End Detection
Much effort has been dedicated to the detection of seizure events or seizure onsets. In contrast, little effort has been devoted to developing algorithms that can detect the termination of a seizure, even though such algorithms can enable important ap-plications. They can facilitate the estimation of seizure duration, which could help physicians assess the efficacy of anti-epileptic drugs when combined with estimates of seizure frequency. A seizure end detector could also be used to control the delivery of therapies to control postictal symptoms, which can persist for anywhere from minutes to days. Finally, a seizure end detector can be used to detect the presence of status epilepticus. This can be accomplished, for example, by activating an alert when a seizure's end has not been detected within a certain period of time (e.g. 5 minutes) from its onset.
1.4
Intracranial EEG
Several types of neurophysiological data reflecting electrical activity are in use for di-agnostics and research. Perhaps the most familiar is the scalp EEG (electroencephalo-gram), which is obtained by recording electrical activity measured by electrodes placed on the scalp. However, in this thesis we will focus on a dataset containing another form of EEG called intracranial EEG (IEEG), where the electrodes are placed inside the skull, and is thus categorized as an invasive form of EEG. The electrodes can be placed on the outer surface of the brain or cortex (these are known as grid or strip electrodes), or within brain matter (these are referred to as depth electrodes). In comparison to scalp EEG, IEEG signals reflect the activity of a smaller number of neurons, and therefore have a higher spatial resolution. IEEG recordings also have a higher bandwidth, and are thus sampled at higher rates. In addition, IEEG signals often show the signs of the start of seizure activity several seconds before scalp EEG recorded from the same patient [25]. Figures 1-1, 1-2, 1-3 show examples of IEEG from inter-ictal(non-seizure), ictal and post-ictal periods respectively.
1.5
Previous work
This project builds on the work of Shoeb et al. [30, 29]. Several other methods have been published on seizure detection on noninvasive scalp EEG, including some which also incorporate a support vector machine as a component [11, 19, 33]. Our algorithm is designed to work with a different type of neurophysiological data (IEEG), and there are some differences in the methodology, which is described in Chapter 2.
The median patient false alarm rate (0.6/day) and the median/mean latency across all seizures (5 sec/6.9 sec) obtained using our algorithms are lower than those reported in previous work on seizure detection using IEEG, and the sensitivity was comparable (97%). It should be noted that the various studies mentioned in this sec-tion t ested methods on different IEEG databases. There can also be some differences in evaluation methodology, and other aspects such as patient selection criteria.
Algorithms such as those described by Chan et al. [4] and Chua et al. [6] were designed for offline IEEG analysis, and cannot be implemented as part of a real-time warning system. Zhang et al. [35] report a sensitivity of 98.8%, a mean latency of
10.8 seconds, and a combined false alarm rate of 11.8/day for their patient-specific
method when tested on IEEG from 21 patients. The authors report separate figures for false alarms dichotomized into "interesting" and "uninteresting" groups. Grewal and Gotman [12] describe an algorithm with tunable parameters that can be set for a given patient using data from that patient. Using tuned parameters they report a sensitivity of 89.7%, a median latency of 17.1 seconds, and a false alarm rate of 5.3/day. Aarabi et al. [1] report a sensitivity of 98.7%, an average latency of 11 seconds, and a false alarm rate of 6.5 per 24 hours for their method when tested on data from 6 contacts per patient in the Freiburg public database [18].
Gardner et al. [10] used a one-class support vector machine requiring only non-seizure data for training, and reported a false alarm rate of 37.4/day for their method when tested on 200 hours of data from 5 patients. That study allowed for negative latencies in cases where an alarm began up to 3 minutes before a seizure, and negative average latencies were reported for several patients (although the median latencies for
I
these patients were positive). Shoeb et al. [28] evaluated their two-channel patient-specific IEEG detector, which was constrained to compute the energy in two bands, on 81 hours of data from 17 subjects. A mean latency of 9.3 seconds and a false alarm rate of 11/day were obtained in that study.
Osorio et al. [24] report impressive results. However, important differences dis-tinguish their study from ours, including the automatic pre-selection of a subset of channels using patient data in their study. They also use a different evaluation methodology that includes the designation of some events that do not fall under the category of true positives as epileptiform discharges rather than false alarms. Visual review of all automated detections and a sample of interictal segments were used to determine sensitivity and specificity, and the IEEG record had not been reviewed in its entirety to locate all instances of seizures. Thus, no clear comparison can be made.
1.6
Contributions
Automated seizure onset detection enables multiple alerting and therapeutic applica-tions, but existing approaches have been plagued with difficulties in either sensitivity, specificity, latency or some combination of these. In this thesis we present and eval-uate an algorithm for real-time seizure onset detection from IEEG using a machine-learning approach that permits a patient-specific solution. The proposed algorithm performance compares favorably to existing methods, as determined by well-defined performance metrics. The median patient false alarm rate (0.6/day) and the me-dian/mean latency across all seizures (5 sec/6.9 sec) obtained using our algorithm are lower than those reported in previous work on seizure detection using IEEG.
We analyzed more than 875 hours of continuous intracranial EEG recorded from
10 patients to evaluate our algorithm. The more than 87 hours of data per patient
significantly exceeds the amount of data used in most previous studies. This allows for more realistic estimates of long-term performance. We provide some evidence for this with the finding that false alarms tend to temporally cluster, and are unevenly distributed in time (including across days).
Furthermore, the algorithm does not require the manual pre-selection of a small subset of channels by a clinician, as is the case with several previously published meth-ods and studies. We present results from a study that uses the full set of intracranial electrodes of sufficient recording quality.
In addition, we describe and evaluate an algorithm for the detection of the cessa-tion of seizure activity within IEEG. Seizure end deteccessa-tion algorithms can enable important clinical applications. Our machine-learning-based approach is patient-specific. When tested on 65 seizures, 88% of all seizure ends were detected within 15 seconds of the time determined by a clinical expert to represent the electrographic end of a seizure. For 5 out of 10 patients, 100% of seizure ends were detected within a 15-second margin of the expert-marked end.
We explore the effects of manual channel pre-selection on seizure onset detection for some patient datasets. We evaluate and present the results from a seizure detector
that has been restricted to use only a small subset of the channels available.
Finally, we propose an alternative feature extraction method that is tailored to a patient using the training data, and is designed to work with datasets limited to a few pre-selected channels. The feature extraction process involves the representation of an epoch of IEEG on a channel as a linear combination of vectors that we refer to as dictionary elements. To learn a dictionary, the method searches for directions in which the power in the two classes shows a large difference. The results from an evaluation of a detector that supplemented the original spectral energy features with features computed in a patient-specific manner show a significant improvement in 3 out of 5 patients. While not conclusive, the results suggest that this avenue is worthy of further exploration.
1.7 Thesis Outline
In Chapter 2 we describe and evaluate an algorithm for automatic seizure onset detection from intracranial EEG. We define some performance metrics, and evaluate the algorithm using a database containing continuous IEEG from ten patients. In Chapter 3 we describe and evaluate an algorithm for seizure end detection using IEEG. The algorithm is designed to search for the cessation of electrographic seizure activity once a seizure has been discovered by a seizure onset detector. We present the results from an evaluation of the algorithm using seizures from the same database used to test the seizure onset detector. In Chapter 4, we present the results when the seizure detector is restricted to the use of a small number of channels (2-4). The channels are manually selected based on visual examination for each patient, and correspond to the channels that show the earliest ictal activity. We also present and evaluate an algorithm for patient-specific feature extraction, an approach where the feature extraction process for a given patient leverages the training data available. A summary and some discussion and conclusions are included in Chapter 5.
Figure 1-3. A 14-second window of intracranial EEG during a post-ictal period, beginning less
Chapter 2
Algorithm for Seizure Onset
Detection
In this chapter we describe and evaluate an algorithm for automatic seizure onset detection from intracranial EEG. Our machine-learning approach is patient-specific. We define some performance metrics, and evaluate the algorithm using a database containing continuous IEEG from ten patients.
2.1 Feature Vector Extraction and Classification
We treat seizure detection as a binary classification problem that involves separating seizure activity from non-seizure activity. We adopt a patient-specific approach to seizure detection to overcome the cross-patient variability in ictal and interictal IEEG patterns, and to exploit the consistency within ictal patterns emerging from the same brain region. The key to our detector's high accuracy is a feature vector that unifies in
a single feature space the time-evolution of spectral properties of the brain's electrical activity as recorded by several IEEG electrodes. The algorithm presented is based in part on the algorithm in [27, 30], with some essential changes also described in this section.
Our goal is to construct a function f(X) that maps a feature vector X derived from an epoch of IEEG onto the labels Y =+/-1 depending on whether X is representative of seizure or non-seizure IEEG. The function is derived using training sets of seizure and non-seizure feature vectors specific to an individual patient. In this section we discuss how we construct the feature vector X, the discriminant function f(X), and
the training sets.
Features important for characterizing IEEG activity include its spectral distribu-tion, the channels on which it manifests, and its short-term temporal evolution. The following subsections illustrate how these features are extracted and encoded. We use spectral energy features similar to those that have been shown to be effective in the seizure detection scheme of Shoeb [27]. Each spectral feature represents the logarithm of the total energy in a specific frequency band on a single channel.
EEG signals generally have a spectral amplitude profile that is inversely
propor-tional to frequency. To remove this frequency-domain trend, a derivative filter is applied to all channels as an added first step in the feature extraction phase for the
IEEG detector. This introduces more parity in the scaling of spectral content at
different frequencies.
Considering the multiple frequency components that compose the activity asso-ciated with seizure onset is essential to detecting seizures with high accuracy. The dominant spectral content of a seizure epoch may overlap the dominant frequency of an epoch of non-seizure activity, but they can still be distinguished by the presence or absence of other spectral components. We extract the spectral structure of a sliding window of length L=1 second by passing it through a filterbank and then measuring the energy falling within the passband of each filter. This choice of epoch length provides sufficient time resolution to capture discrete electrographic events, and also provides sufficient frequency resolution when compared against the bandwidth of the bandpass filters. The beginnings of consecutive epochs are separated by 1 second. The filterbank is composed of M filters, and is illustrated in Figure 2-1.
The scalp EEG seizure detector in [27, 30] focuses on the frequency range 0.5-25Hz. However, the intracranial EEG is a signal of a higher bandwidth and carries relevant information at higher frequencies. Therefore, the IEEG detector filter bank considers a wider range of frequencies, although more emphasis is still placed on the lower frequency range. The 0.5-35Hz range is covered by more filters (12) each with a bandwidth of 3Hz, whereas the 35-105Hz range is covered by a lower density of filters
Spectral Features Spectral and Spatial Spectral, Spatial
Features and Temporal
Features
EEG Ch1
x2 1 - 2,N Frw:uency (Hn X = . {X 0 N XT-(W-1)L EEG~ Ch h 49
... M,N Dimension: M*N Dimension: W*M*NFigure 2-1. Feature vector formation steps.
region is neglected so as to remove the 60Hz electrical noise often contaminating the signals. A slightly different choice of M or the filter bandwidth may lead to similar
(and possibly improved) results.
For channel k, the energy measured by filter i is denoted by the feature Xi,k. To capture the spectral and spatial information contained within each one-second EEG epoch at time t=T, we concatenate the M = 17 spectral energies extracted from each of N IEEG channels. This process forms a feature vector XT with M * N elements as shown in the middle portion of Figure 2-1. Each feature is multiplied
by a coefficient to normalize the approximate scaling of each feature in the set. The
scaling and normalization coefficients are determined using the training points only. This is to avoid situations where some features do not play a significant role in the classifier structure because of the dominance of features with much larger scaling. The features are mean-centered and then divided by the median absolute value.
The feature vector XT does not capture how an epoch relates to those in the recent past. Consequently, XT cannot represent how a seizure emerges from the background
or how it evolves. To capture this information, we form the time-delay embedded feature vector XT by stacking the vectors XT, XTL...XT(W-i)L from W contiguous,
but non-overlapping L = 1 second epochs as shown on the right side of Figure 2-1. This approach allows the timing and order of discrete events to be encoded to some extent, and it is not equivalent to forming a feature vector XT using a longer epoch length L. We set W = 3.
2.1.1 Training and Classification
The feature vector XT is classified as representative of seizure or non-seizure activity using a linear support vector machine (SVM). We train the SVM on seizure vectors computed from the first S=20 seconds of each training seizure, and on non-seizure vectors computed from non-seizure IEEG. This results in a number of non-seizure training feature vectors that greatly outnumbers the number of seizure examples. In the training phase, the non-seizure feature vectors were subsampled such that only every sixth epoch in the training set was used due to memory limitations. An exception to this is made for the 20 minute period following any seizure, to ensure there are enough training examples to describe the post-ictal period, which tends to be associated with electrographic qualities that distinguish it from the rest of the non-seizure activity. Within the SVMlight software package [16], the error cost parameter was set to C = 1 x 10- for all patients in the evaluation database. This parameter was not increased for the seizure class as that did not appear to lead to an overall improvement in results in preliminary analysis.
2.1.2 Artifact Rejection
An artifact rejection component works in conjunction with a trained classifier by checking for large differences between the minimum and maximum value of the signal for each channel within W * L = 3 seconds to reject high amplitude artifacts. If more
than 20% of the channels are deemed to contain artifact then a seizure detection alarm is prevented at the corresponding time. More specifically, a seizure detection
classified as belonging to the seizure class, and no artifact is detected (on enough channels) within them by the artifact rejection module. The alarm is turned off if the classifier does not detect a seizure in any epochs for more than two minutes.
2.2
Data
The data used to evaluate our detector consists of more than 875 hours of continu-ous intracranial EEG sampled at 500 Hz. The data was recorded at Massachusetts General Hospital from 10 patients with focal epilepsy (5 female, mean age at onset of seizures 15 +/- 5 yrs S.D., mean age at surgery of 40
+/-
9 yrs S.D.). Etiologiesincluded mesial temporal sclerosis (2), cortical dysplasia (2), post-traumatic epilepsy
(1), and post-infectious epilepsy (1). In 4 patients the etiology was unknown.
The patients were all surgical candidates who required invasive monitoring, and therefore represent more complicated cases than the general population of patients with epilepsy. They are also not necessarily representative of the population most likely to benefit from a seizure detection system. For example, patients for whom resection would incur too much risk (e.g., because the seizures arise from eloquent cortex) would be prime candidates for an implanted seizure detection and control system. The data used for this paper was collected for clinical purposes, and once enough seizures were observed data collection was halted. If a similar system were to be deployed, sufficient data would be collected from a patient specifically for the purpose of training the system, as is the case (albeit with manual tuning) with ex-isting devices [22]. For the hospitalized patients from whom the data for this study was recorded, the anti-epileptic drug levels were changed on a daily basis. The med-ications have a significant effect on both seizure and non-seizure IEEG. The lack of consistency in the magnitude or nature of these effects at different times complicates the evaluation of the detector.
While the recordings were being made, the patients experienced a total of 67 seizures (between 3 and 12 seizures for each patient). For each seizure, an expert indicated the earliest IEEG change associated with the seizure. The patients were
consecutively chosen, with two patients omitted because the clinicians were unable to reliably determine seizure onsets. We use a bipolar montage, consistent with the montage used by clinicians who reviewed each patient's data and authored an accom-panying IEEG report. In most cases the recording from each electrode is used for one channel. Analysis of this data was performed retrospectively under the auspices of the local institutional review board in accordance with the Declaration of Helsinki.
2.3
Evaluation Methodology
Each patient's data was segmented into a number of records, where a record corre-sponds to a stretch of time in the IEEG recordings. Each record is up to 24 hours long, and contains at least one seizure (in a very small number of cases where two seizures are less than 15 minutes apart, they are included in the same record). If there is a separation of more than 24 hours between the seizure in the record and the preceding one, the beginning of the record is set to approximately 24 hours before the seizure, and its end is set to be approximately 20 minutes after (i.e., every seizure's post-ictal phase is included within the same record). If that distance is less than 24 hours, then the start of the record is set to the end of the previous record, and the end is set to be no earlier than 20 minutes after the end of the seizure. In that case the endpoint of the record may be moved to a later point to maximize record length, as long as it does not cross the beginning of the next record, and the 24-hour record duration limit is maintained. Some stretches of time corresponding to disconnects or non-recording of electrodes were excluded from patient datasets. One artifact-obscured seizure was omitted from any training sets, but was still used for testing.
A seizure onset is considered to be the earliest point of unequivocal change in the IEEG waveforms leading up to a seizure, as judged by an expert
electroencephalog-rapher. The seizure detection algorithm is constrained to be causal, i.e., the decision at a given point in time as to whether a seizure is underway can only be made using past IEEG data leading up to that point. This is to ensure the algorithm can be
as a human expert determines the seizure onset point that we use as a reference for evaluation. In fact, a clinician will often track backwards from more clearly ictal later-stage activity to determine a time point where the first change in activity leading up to it occurred. We characterized our detector's performance in terms of sensitivity, specificity, and latency. Sensitivity refers to the percentage of test seizures detected.
A seizure is considered successfully detected if an alarm is raised anytime between
its (expert-marked) onset and its end. The false alarm rate refers to the average number of times, per 24 hours, that the detector incorrectly declared the onset of seizure. Alarms that begin outside intervals between a seizure onset and the end of the same seizure are considered false alarms. The delay between the onset and the time a detection algorithm indicates that a seizure has been detected is referred to as the detection latency.
To estimate our detector's performance on data from a given patient, we used a leave-one-record-out testing scheme. We avoided an evaluation method based on leaving out epochs (as done in [20]) rather than records, since that approach leads to unrepresentative and misleadingly good results by including in the training set feature vectors in close temporal proximity to those in the test data.
Let NR denote the number of records for a given patient. To estimate the detec-tor's latency, sensitivity, and false alarm rate we train the detector on NR - 1 records from the patient. The detector is then tasked with detecting the seizure in the with-held record. For each round we record whether the test seizure was detected, and if so, with what latency. Any alarms beginning outside the seizure are also counted as false alarms. This process is repeated NR times so that each record is tested. In most cases NR - 1 training seizures are used for each test record since most records contain a single seizure.
2.4 Results
Overall, 97% of the 67 test seizures were detected. As shown in Table 2.1, the sen-sitivity was 100% for most patients. The median latency with which the detector
declared the seizure onset (across all seizures) was 5 seconds. Some care is needed in the interpretation of some results (e.g., aggregates over all seizures in the database with an inconsistent number of seizures per patient) because of inter-patient differ-ences or variations, which are discussed in later sections. The median latencies for each patient are shown in Table 2.1. The average false alarm rates for each patient are also shown in Table 2.1. The median false alarm rate was 0.6 false detections per 24 hour period. Figure 2-2 shows an example of one of many seizures that were detected with a short latency. The expert-marked onset is indicated by the dark vertical line, and the approximate time at which the algorithm detected the seizure is indicated by the red dotted line.
Patient 1 2 3 4 5 Total time tested(Hr) 52 127 71 29 96 Number of seizures 3 6 6 5 8
# of electrodes 98 56 114 34 68 Electrode types Grid & Depth Grid & Depth Depth
Depth Depth
Sensitivity 100% 100% 100% 100% 100% Median Latency(sec) 6.5 3.25 3.25 5 5.75 False alarms/ 24Hr 0 0.4 1.7 0 0.8 Patient 6 7 8 9 10 Total time tested(Hr) 68 39 146 148 104
Number of seizures 3 7 12 11 6
#
of electrodes 40 54 64 80 85 Electrode types Depth Depth Depth Depth Grid &Depth Sensitivity 66% 100% 92% 100% 100% Median Latency(sec) 4.25 4.5 6 4.5 18.5 False alarms/ 24Hr 0 25.3 2.5 0.3 2.5
Table 2.1. Patient data set information, and sensitivity, median latency, estimated false alarm rate
1RAT1-RAT2 2RAT5-RATE 3RPT1-RPT2 4RPT7-RPT8 5RSbF1-RSbF2 6RSbF3-RSbF4 7RSbFS-RSbF6 8RPsF1-RPsF2 9RPsF3-RPsF4 1ORPsF5-RPsF6 11 LAT7LATB 12LSbF1-LSbF2 13LSbF3-LSbF4 -2 -1 0 2 Time(sec) 3 4 5
Figure 2-2. Intracranial EEG on a subset of channels in a 8-second epoch containing the onset
of a Patient 5 seizure. The expert-marked onset is indicated by the dark vertical line, and the approximate time at which the algorithm detected the seizure is indicated by the red dotted line.
-A
2.4.1
Sensitivity and Latency
A notable phenomenon is that of single seizures that were deemed by a clinician
to be of a distinct seizure type relative to all the other remaining seizures in the patient dataset. Our detector misses or has a large latency when a test seizure differs greatly from all the training seizures. One example of this is the seizure from the Patient 6 dataset that was missed by the algorithm, shown in Figure 2-3. The two remaining seizures from this patient were grouped together, (by a clinician in the patient report) and one of them is shown in Figure 2-4. Clear differences between the seizure types include high amplitude rhythmic spiking activity on the first anterior temporal channel in the seizure shown in Figure 2-4 that is absent from the same channel in Figure 2-3. Rhythmic slowing in several anterior and posterior temporal contacts early in the onset of the seizure in Figure 2-4 also does not match the activity in the seizure in Figure 2-3.
3WrI- - S~FQ-WbU3 -SbWO4 awls5 - swFi-I . r AnTpl -AUdTOZ Aiffp3 -Aa1P4 AnTp5 -ARIOp Alipi -AfMTV& PSTPI -PaTP2 PSTP3 -PST04 PSTP6 -PSTPO GWEG -C4G3 -UNG4 CW4G5 -aNGI PARI -PAR2V PAR3 - PAM4-PAR5 - tV
~zz
a
Figure 2-3. Intracranial EEG on a subset of channels in a 12-second epoch containing the onset
Figure 2-4. Intracranial EEG on a subset of channels in a 12-second epoch containing the onset
of a Patient 6 seizure different from that of Figure 2-3. The dashed vertical line indicates the expert-marked onset.
The algorithm returned a notably long median detection latency for Patient 10. The clinician report for Patient 10 indicates at least three classes of IEEG onset activity patterns across six total seizures, and notes some difference in morphology on the channels that displayed the earliest noted seizure activity within those classes. The clinical conclusion from this IEEG was that the patient had multifocal epilepsy, although the possibility of a single focus with heterogeneous propagation cannot be entirely excluded. As a result, the onset of nearly every seizure was unique in some way. The seizures in the training data therefore were different from one another. For each test seizure, the paucity or absence of sufficiently similar examples of onset activity from seizures in the training set contributed to the relatively poor detection latency.
Not all cases that include multiple distinct seizure types yield poor results. More favorable results were obtained for Patient 8, for whom the clinician enumerated several seizure types (divided between left and right hemisphere onsets, and presence or lack of apparent clinical symptoms). This is possibly explained by the fact that the patient's dataset includes 12 seizures, and therefore, for most test seizures within this patient's dataset, the classifier has incorporated more examples of seizures of the same broad type, and learned some variation in IEEG patterns among them. This allows for a better performance, particularly in reduced latency in the case of this patient dataset.
2.4.2
False Alarms
The largest false alarm rate estimate was obtained for Patient 7. Some false alarms were due to mimics of seizure onset activity; many had a morphological appearance similar to ictal manifestations seen in other seizures. These mimics were shorter than typical clinical seizures or were too variable in length or appearance to have been judged a seizure by clinicians. Figures 2-5 and 2-6 show examples of activity that induced an alarm, and the seizure activity they resemble. The high amplitude rhyth-mic activity on the right subfrontal channel during the seizure in 2-5(A) also appears in the inter-ictal epoch where false detection occurred in testing, shown in 2-5(B). The type of activity highlighted in 2-5(B) lasted for approximately 8 seconds. Figure
2-6(A) shows the high-frequency activity on the right posterior temporal channel in
a different seizure, and Figure 2-6(B) shows the similar activity on the same channels from an inter-ictal epoch where a false alarm was raised. Other false alarms appear to have been caused by non-physiological artifact that was not detected by the artifact rejection module.
A
LCIn1 - L:Cin2-LPT1I - LPT2/ RFr1 -RFrZ R~r3 - RFr4---0 R~R5 - RF & -, -... RSbF1 - RSbF RPbF3 - RSbF4 RSbFp -RSbF6 RPT1 - RP~ RPf3 - RPT4-RPTS - RIPTWFigure 2-5. Patient 7 intracranial EEG on a subset of electrodes in two epochs showing similar
activity, particularly on the right subfrontal channel 'RSbF 5 - RSbF 6'. (A) Seizure activity in a 4-second epoch beginning approximately 10 seconds after the expert-marked onset. (B) An interictal 4-second epoch during which false detection occurred. This activity was not judged to constitute a seizure by the clinicians.
A
LMmT I -LMA"TZ' LCM1 - LoIn2-LPTI - LPT2-RFII -RF,2Z RFr3 -RFr4e iFr5 -RFW RSbFI - RSbF RSbF3 - RSbF4 RSbF5 -RSbFI RCIn1 - RCin2-RPTI - RPr2-RPT3 - RPf* RPTS - RPT6) V V LFrl - LFr2% LSbF1 - LSbF2B
LnTI -Un1Z LCin1 - LCin2-LPTI -LPT2-.0 RFrI - RF2 RFr3 - RFr4-RFi5 -RFMV RSbF1 -RSbF RSW -RSbFA RSbF5 - RSbFE RCIn1 -RCIrd RPTI - RPT2-RPT3 -RPT RPT5-22~z2ZA2~
vA1,~sv\A4V~ (w~y~ty~~Figure 2-6. Patient 7 intracranial EEG on a subset of electrodes in two epochs showing similar activity, particularly on the right posterior temporal channels 'RPT 3- RPT 4' and 'RPT 5- RPT
6'. (A) Seizure activity in a 4-second epoch beginning approximately 7 seconds after the expert-marked onset. (B) An interictal 4-second epoch during which false detection occurred. As before, this activity was not judged to constitute ictal activity by clinical reviewers.
In many cases, the false alarm events are unevenly concentrated in different regions in time, i.e., they temporally cluster. In the case of Patient 3, 60% of false alarms
(3 out of 5) occur within a 15 minute block of time (out of a total of approximately 71 hours). Another contiguous 2-hour block contains the two remaining false alarms.
Figure 2-7 contains a false alarm event plot for Patient 8. It is formed using a timeline that combines all the records in correct temporal order. An event shown on the patient false alarm plot timeline indicates the occurrence of a false alarm in a leave-one-out test on the record in which the time point fell. For this patient 66% of false alarms fall within a single contiguous block less than 12 hours long (out of a total of 146 hours). These false alarms seem to have been triggered by types of interictal electrical activity that do not appear with significant frequency outside the record that contains this period. The lack of prior examples of similar activity in interictal periods in the training set may explain the large number of false alarms for this record. Interestingly, this cluster of false alarms begins in close proximity to the point of lowest drug concentrations during the admission period for this patient.
2.4.3 Reduction of K parameter
We explored the possibility of reducing the latencies by adjusting the K parameter. The setting of K = 2 forces the algorithm to wait for 2 consecutive windows that the classifier has deemed to be part of a seizure onset before an alarm is raised. Setting
K = 1 has the effect of reducing latencies (by a minimum of L = 1 second for every
seizure for this choice of epoch length), at the expense of an increase in the false alarm rate. The results obtained by setting K = 1 are shown in Table 2.2. The median
la-tency across all detected seizures falls to 3.5 seconds. Although the latencies decrease, the median patient false alarm rate rises to 2.7 false alarms/24hrs. This alternative trade-off point may be useful for certain applications where the consequences of false alarms are less severe or lower latencies are more crucial.
Sensitivity 100% 100% 100% 100% 100% 66% 100% 92% 100% 100%
Median
Latency(sec) 5.5 2.25 2.25 4 4.75 3.25 3.5 4 2.5 16.5 False alarms
/24Hr 0 1.3 3.7 1.7 5 1.4 45.1 13.5 1 6.2
Table 2.2. Sensitivities, median latencies and false alarm rates for the particular case where K=1.
The latencies decrease at the expense of higher false alarm rate.
2.5 Discussion
We presented a patient-specific algorithm that detects seizures by examining the short-term evolution of spectral properties across several intracranial EEG channels. The results of this evaluation, using an average of more than 3 days of data per patient and a full IEEG electrode set, show the efficacy of using a patient specific algorithm for automatic seizure detection as determined by clinically-relevant performance metrics.
2.5.1
False Alarm Generation and Evaluation
In addition to recording the false alarm rate, we examined the nature and distribution of false alarms. False alarms were often caused by electrical artifacts as well as events that had features of seizure activity. Moreover, false alarms were non-homogenously spaced.
The temporal clustering of false alarm times has application-specific implications for the potential utility of this system. For example, consider the false alarms gen-erated by a seizure detector for an ambulatory alerting system in a given week. The overall disruption caused by these alarms occurring a few minutes apart from one another may be less objectionable than the case where each occurs on a different day. However, the extent to which some factors may influence the number and distribu-tion of events is not clear. For the hospitalized patients from whom the data for this study was recorded, the medications levels were changed on a daily basis. This
false alarms (or diminished performance in other forms). Nonetheless, the finding that false alarms are clustered temporally implies that long recordings are necessary in the evaluation of a seizure detector. Long records provide an ability to obtain far more representative estimates of the false alarm rate.
2.5.2
Impact of Number of Electrodes
As opposed to several other investigations, the approach utilized here incorporated a full set of intracranial electrodes. Overall, it is not clear what the effect of using a small subset of the channels has on the performance of classifiers. There are, however, some factors to consider. Using a full set of electrodes makes the clinical deployment of the algorithm simpler from the user's standpoint. For some patients it can be difficult to select only a few channels because ictal onset changes may involve many channels and be subtly different for each seizure. Furthermore, including all channels allows the system to leverage information that is not readily apparent to a clinical reader (from regions seemingly not involved in the onset) to better differentiate ictal and interictal patterns. On the other hand, allowing all channels to be used may lead the learning algorithm to incorporate non-specific information that may increase the likelihood of incorrect classification. To better understand these tradeoffs a subse-quent investigation of different channel counts using a given detection algorithm is necessary. Although there is currently a considerable difference between the number of channels in monitoring units versus implantable devices, the number of channels in the latter is likely to increase.
False Alarm Events
0 20 40 60 8 100 120 140
Time (hours)