Publisher’s version / Version de l'éditeur:
Applied Ergonomics, 49, pp. 18-24, 2015-07
READ THESE TERMS AND CONDITIONS CAREFULLY BEFORE USING THIS WEBSITE. https://nrc-publications.canada.ca/eng/copyright
Vous avez des questions? Nous pouvons vous aider. Pour communiquer directement avec un auteur, consultez la première page de la revue dans laquelle son article a été publié afin de trouver ses coordonnées. Si vous n’arrivez pas à les repérer, communiquez avec nous à [email protected].
Questions? Contact the NRC Publications Archive team at
[email protected]. If you wish to email the authors directly, please see the first page of the publication for their contact information.
NRC Publications Archive
Archives des publications du CNRC
This publication could be one of several versions: author’s original, accepted manuscript or the publisher’s version. / La version de cette publication peut être l’une des suivantes : la version prépublication de l’auteur, la version acceptée du manuscrit ou la version de l’éditeur.
For the publisher’s version, please access the DOI link below./ Pour consulter la version de l’éditeur, utilisez le lien DOI ci-dessous.
https://doi.org/10.1016/j.apergo.2015.01.001
Access and use of this website and the material on it are subject to the Terms and Conditions set forth at
Reduction in predicted survival times in cold water due to wind and
waves
Power, Jonathan; Simoes Ré, Antonio; Barwood, Martin; Tikuisis, Peter;
Tipton, Michael
https://publications-cnrc.canada.ca/fra/droits
L’accès à ce site Web et l’utilisation de son contenu sont assujettis aux conditions présentées dans le site LISEZ CES CONDITIONS ATTENTIVEMENT AVANT D’UTILISER CE SITE WEB.
NRC Publications Record / Notice d'Archives des publications de CNRC: https://nrc-publications.canada.ca/eng/view/object/?id=dfe5494b-b7c1-474f-83f9-0eb6d56f007b https://publications-cnrc.canada.ca/fra/voir/objet/?id=dfe5494b-b7c1-474f-83f9-0eb6d56f007b
Reduction in predicted survival times in cold water due to wind and waves Abstract
Recent marine accidents have called into question the level of protection provided by immersion suits in real (harsh) life situations. Two immersion suit studies, one dry and the other with 500 mL of water underneath the suit, were conducted in cold water with 10-12 males in each to test body heat loss under three environmental conditions: calm, as mandated for immersion suit certification, and two combinations of wind plus waves to simulate conditions typically found offshore. In both studies mean skin heat loss was higher in wind and waves vs. calm; deep body temperature and oxygen consumption were not different. Mean survival time predictions exceeded 36 h for all conditions in the first study but were markedly less in the second in both calm and wind and waves. Immersion suit protection and consequential predicted survival times under realistic environmental conditions and with leakage are reduced relative to calm conditions.
1.0 Introduction
Many industries require their personnel to work or travel over open water; the vast majority of which is too cold for unclothed humans to maintain their body temperature and prevent hypothermia (i.e. deep body temperature below 35°C). Therefore, life saving appliances (LSA) are needed to provide thermal protection to improve the safety of individuals at sea. Cold water immersion (CWI) is a serious threat to survival in both the short (Tipton 1989) and long term (Hayward and Eckerson 1984). An immersion suit is a LSA designed to provide flotation, protect an immersed individual from the Cold Shock Response (CSR), and delay the onset of hypothermia (CGSB 2005). As prescribed by the International Maritime Organization (IMO), a certified insulated immersion suit should minimize the CSR and prevent a drop in deep body temperature of no more than 2°C after six hours in 0-2°C “calm, circulating water” (IMO 2010). Various standards across the world (e.g., Canadian General Standards Board (CGSB); International Organization for Standardization) specify a similar test protocol for certifying the thermal protective properties of insulated immersion suits.
Despite these test standards, cold-induced immersion-related deaths still occur. In recent years, multiple marine accidents have called into question whether the level of thermal protection of immersion suits, as measured in a laboratory, is equivalent to that found in emergency scenarios in the open water. For example, in February 2008, the
Check Mate III capsized off the North East coast of Newfoundland, Canada. The follow
up report written by the Maritime Rescue Sub-Centre (MRSC) St. John’s (2008) said that both crew members were able to don immersion suits and abandon ship into the 0.8°C water, but had perished by the time search and rescue crews arrived less than two hours later. The subsequent investigation revealed that the immersion suits worn had failed “in a spectacular fashion”. If the suits had indeed met the thermal protective properties described in the Canadian immersion suit standard CAN/CGSB-65.16-2005 (CGSB 2005), they should have prevented the victims from developing hypothermia for at least six hours.
Similarly, in March 2009, Cougar Flight 491 crashed into the Atlantic Ocean approximately 50 km east of Newfoundland, Canada. The subsequent follow up report by the Transportation Safety Board of Canada (TSB) (2010) found that the sole survivor
of the crash successfully escaped from the sinking helicopter and made it to the surface of the 0.3°C water. But when he arrived at the hospital two hours after the crash, his immersion suit was found completely filled with water and his deep body temperature was 28°C (TSB 2010). Both tragedies took place in turbulent conditions with wave heights (Check Mate III: > 2 m (MRSC 2008); Cougar Flight 491: > 2.5 m (TSB 2010)) and winds (Check Mate III: 13-16.5 m·s-1 (MRSC 2008); Cougar Flight 491: 14.5-17.5 m·s-1 (TSB 2010)) exceeding those of the calm conditions specified in many standards. Such anecdotal evidence raises the possibility that turbulent conditions may compromise the performance capability of an immersion suit, reducing it to the level where the heat loss is uncompensable by the human thermoregulatory system leading to the development of hypothermia. If this is the case, the difference between the “calm, circulating water” that standards prescribe immersion suits to be tested in, and their performance in open water conditions that can include turbulent wind and wave conditions, can result in what Tipton (1995) referred to as “surprisingly poor performance in a real accident”.
Tentative evidence to the contrary exists; work by Hayes and et al. (1985) investigated the effect that wave action had on subjects with clothing ensembles ranging from swimming trunks and a lifejacket to a flight suit with insulated undercoveralls. The authors found that in eight out of the ten cases, the rate of fall of rectal temperature was not significantly higher in waves (~0.6 m in height) compared to calm water. Hayes and et al. (1985) concluded that the effect of waves is more evident when nude or wearing little clothing, and that with the immersion ensembles it was the face and neck seals that were consistently challenged. If the seals on the immersion suit failed, the leaking and flushing of water underneath the ensembles could cause a major difference between immersions in calm water and waves. The study authors concluded that their preliminary investigation demonstrated a trend for waves to increase cooling in some cases, but they stated that more definitive experimentation was required.
A more detailed study was conducted by Steinman and et al. (1987) shortly after in which eight subjects wearing a variety of clothing ensembles performed immersions in both calm water and rough seas (waves: 0.5 – 1.5 m in height; wind: 5.0 – 10.0 m·s -1
). The clothing ensembles included flight suits, wet suits, and insulated immersion suits. The study authors found that the rate of rectal temperature decrease was
significantly greater in the rough conditions compared to calm water for the majority of the clothing ensembles tested.
Both of these earlier studies (Hayes et al. 1985; Steinman et al. 1987) suggested that increased wave action can result in water penetrating immersion suit seals, leading to increased leakage underneath the immersion suit. Wave action may also disrupt the boundary layer of insulation provided by still water thereby increasing cooling rate and thermal strain. The disruption of the boundary layer by wave action was investigated in a subsequent study by Ducharme and Brooks (1998) who found that wave heights above 30 cm significantly increased heat loss compared to calm water. The results from the studies by Hayes and et al. (1985), Steinman and et al. (1987), and Ducharme and Brooks (1998) showed that wave action would increase heat loss but that it did not necessarily result in a greater fall in deep body temperature. The implications for survival time were not discussed, but the study by Tipton (1991) suggested that the addition of even relatively mild simulated environmental conditions of wind, waves, and periodic spraying (15 cm waves; 3 m·s-1 wind) resulted in a 30% reduction in predicted survival time. Due to the equivocal nature of the literature to date, a more detailed study was considered necessary to examine the effects of wind and waves on immersion suit performance, thermoregulatory strain, and predicted survival time; the current study sought to examine these effects.
Based on evidence from previous studies it was hypothesized that immersions with wind and waves would, when compared to calm water, cause significantly greater heat loss (H1) and decreases in deep body temperature (H2). Two studies were conducted to test these hypotheses. A prediction model was used to demonstrate the marked reduction in cold exposure survival time due to wind, waves, and water leakage.
2.0 Methods
2.1 Subjects
The National Research Council of Canada (NRC) Research Ethics Board approved both studies (REB#:2008-68; 2009-67). Twelve males participated in Study 1 (Age: 23.9 [3.3] yrs; mass: 83.2 [4.9] kg; height: 1.8 [0.05] m; SA: 2.0 [0.1] m2; BF%: 16.8 [4.1]%) and 10 participated in Study 2 (Age: 25.0 [5.6] yrs; mass: 79.2 [6.8] kg; height: 1.8 [0.02] m; SA: 2.0 [0.1] m2; BF%: 18.1 [2.9] %); two males participated in both studies. All subjects gave their informed consent to participate and were screened by a medical doctor to ensure they were physically fit to do so. Due to time and budget limitations, the two studies were separated by one year.
2.2 Test Conditions
In both studies, each participant performed three, 3 h immersions in the Offshore Engineering Basin (OEB – NRC, St. John’s, Newfoundland) under the conditions listed in Table I. The waves were generated using hydraulic drive wave makers located on one wall of the OEB, which provided a reproducible wave pattern representative of those found offshore. A 20-minute Joint North Sea Wave Analysis Project (JONSWAP) wave spectrum was used in both studies based on data collected from a wave buoy deployed off the south east coast of Newfoundland, Canada. The subjects were oriented with their feet forward into the oncoming unidirectional waves.
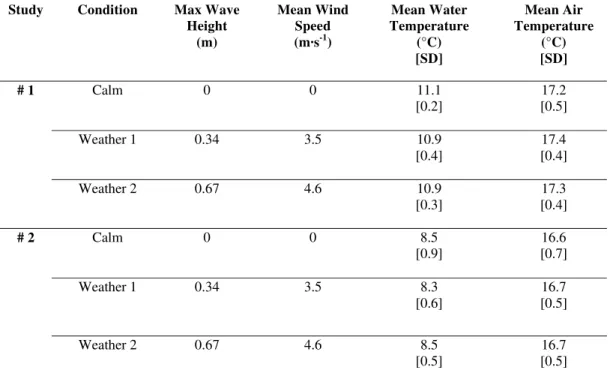
Table I. Immersion conditions for Studies 1 and 2.
Study Condition Max Wave Height (m) Mean Wind Speed (m·s-1) Mean Water Temperature (°C) [SD] Mean Air Temperature (°C) [SD] # 1 Calm 0 0 11.1 [0.2] 17.2 [0.5] Weather 1 0.34 3.5 10.9 [0.4] 17.4 [0.4] Weather 2 0.67 4.6 10.9 [0.3] 17.3 [0.4] # 2 Calm 0 0 8.5 [0.9] 16.6 [0.7] Weather 1 0.34 3.5 8.3 [0.6] 16.7 [0.5] Weather 2 0.67 4.6 8.5 [0.5] 16.7 [0.5]
For both studies, 11 speed-controlled custom built fans (SEA Ltd, Columbus, Ohio, USA) generated air flow (wind) controlled by a precision voltage reference to adjust wind speed at the location of the participant.
In Study 1, the subjects were dry underneath the immersion suits; in Study 2, 500 mL of water was added underneath the suit over the torso in each condition to reflect realistic water ingress. This volume of water was chosen based on previous work by Tipton and Balmi (1996).
2.3 Equipment
Subjects wore a Transport Canada (TC) approved marine abandonment immersion suit (White’s Manufacturing, Victoria, BC, Canada) certified to the standard CAN/CGSB-65.16-2005. This immersion suit was selected due to having latex wrist and neck seals which greatly reduced the chance of water leaking under the immersion suit. The underclothing provided to the subjects was standardized and based on that prescribed by CAN/CGSB-65.16-2005. It consisted of wool socks, swimming trunks, cotton trousers, cotton undershirt, and a long sleeved cotton shirt; this assembly is similar to that
prescribed in the majority of immersion suit standards tests. Swimming trunks were provided to the subjects so that they could enter a hot water bath (40°C) to rewarm once the immersions were completed.
Skin heat loss and temperature were measured using heat flow transducers (Concept Engineering, Old Saybrook, CT, USA) attached to the subjects using porous adhesive tape to the following locations: right foot; left shin; right quadriceps; left abdominal; right pectoral; underside of right forearm; forehead; right calf; left hamstring; right lower back; left shoulder; and topside of the left forearm. These sites were chosen based on a similar protocol used by Ducharme and Brooks (1998), which was similar to the Hardy and Dubois (1938) modified 12 point system. The heat flow transducers were connected to self-contained data loggers (ACR Data Systems, Surrey, BC, Canada) that measured and recorded all 12 sensors once every 8 s.
Gastro-intestinal temperature (TGI) was measured using ingestible, disposable radio telemetry pills (HQ Inc., Palmetto, FL, USA). Telemetry from the pills was measured and recorded once every 20 s by a data recorder (also manufactured by HQ Inc.) that transmitted the data to a laptop to enable the research team to monitor TGI in real-time during the tests.
Subjects wore a disposable oro-nasal facemask (KORR Medical Technologies, Salt Lake City, UT, USA), which was attached to a length of tubing that connected it to a Cardio Coach CO2 (also manufactured by KORR Medical Technologies) that measured oxygen consumption (VO ) throughout the immersions.
2.4 Procedure
On the day of their immersion, subjects arrived at the facility and ingested the gastro-intestinal pill with a small volume of tap water approximately 45 minutes before the start of the test. Recent work by Domitrovich et al. (2010) has shown that there were no significant differences between two gastro-intestinal pills ingested by the same participant 24 hours, and 40 minutes prior to measurements.
After ingesting the gastro-intestinal pill, the participant then changed into the swimming trunks, were weighed, and attached an external bladder themselves to enable in-test urination. This external bladder was attached via a condom catheter which prevented females from being eligible participants. A research team member then attached the heat flow transducers and assisted the subjects in donning the rest of the underclothing. In Study 1, the subjects completely donned the immersion suit and proceeded to the testing area.
In Study 2, the pre-wetting was performed similar to a condition in the experiment described by Tipton and Balmi (1996) as the authors reported a significant change in deep body temperature when the torso only was wetted; and none when the arms were wetted. Our subjects partially donned the immersion suit up to the waist while research team members sprayed their torso (excluding their arms) with 500 mL of water uniformly across the front and back. This completely saturated the long sleeved shirt worn by the subjects, and any excess water run-off was caught by the immersion suit. Once wetting was complete, the subjects finished donning the immersion suit, but left it unzipped, and proceeded to the testing area.
After the participant arrived at the OEB in Study 1, all instrumentation was checked for functionality, the suit was fully zipped, and 5 min of baseline data were collected. The subjects proceeded to the stairs leading to the water where a tether made of plastic TygonTM tubing was connected to their feet and attached to a rope and pulley system. The participant descended the stairs into the water, assumed a floating position, and was then manoeuvred into position by the research team. Once they were secured, the 3 h immersion began. Subjects were allowed to watch movies on an overhead television, with audio transmitted through a radio located on the subjects.
Prior to starting the immersions in Study 2, the suit was fully zipped and the subjects immersed themselves in the OEB up to the neck for one minute to saturate the suit, they then left the tank, dripped dry for one minute, and were then weighed on a M200 Digital Weight Indicator Scale (Western Scale Co. Ltd., Port Coquitlam, BC, Canada) to record their pre-immersion weight. They then re-entered the water and the 3 h immersion commenced once they were in a settled position in the water; this took approximately 5 minutes.
The immersions were terminated if any of the following criteria occurred: either the 3 h time limit had been reached; TGI dropped 2°C or more below baseline values; or at the request of the participant. Once removed from the water, data were downloaded from the instrumentation before removal. Additionally, in Study 2, the subjects dripped dry for one minute before being re-weighed to record their post-immersion weight; this method of pre- and post-immersion weighing was based on the standard CAN/CGSB-65.16-2005 for determining further water ingress. The subjects then rewarmed in the hot water bath until TGI approached pre-immersion values. After rewarming, skin fold thickness was measured using skin fold callipers (Beta Technology, Santa Cruz, CA, USA). Once their well-being was assured, the subjects were allowed to exit the facility.
2.5 Calculations
Body fat percentage was estimated using the Durnin and Womersley method (1969) from the sum of skinfold thickness from four sites (biceps, triceps, subscapular, iliac crest).
Pre-immersion weight was subtracted from post-immersion weight to calculate water ingress into the immersion suit. This method was based on CAN/CGSB-65.16-2005 testing procedures for measuring water ingress. In-test urination was accounted for in this calculation due to the external bladder, and weight loss due to substrate utilisation and evaporative fluid loss in expired air was assumed to be consistent between tests.
Surface area of the subjects was calculated using the following formula as described by Gehan and George (1970):
SA (m2) = 0.1644 · WT0.51456 · HT0.42246 (1)
where:
WT = Mass (kg) HT = Height (m)
Mean skin heat loss (MSHL; W·m-2) and mean skin temperature (T ; °C) were calculated by weighting each measurement site by the values reported by Hardy and Dubois (1938). The final value was divided by 0.95 to account for a lack of a measurement on the hand; this is similar to the procedure described by Ducharme and Brooks (1998).
Change in TGI (∆TGI; °C) and T (∆T ; °C) were calculated by obtaining the mean value during a 5 min period at the start of the immersion, and then subtracting the mean TGI of a 5 min period at the end of the test.
The rate of metabolic heat production (M ; W·m-2) was calculated from the rates of oxygen consumption (VO ; L·min-1), as reported by the Cardio Coach online system, were averaged over the last 30 min period at the end of each immersion. M was calculated based on the following formula described by Peronnet and Massicottee (1991):
(W·m-2
) = (281.65 + 80.65 · RER) · ( /SA) (2) Where:
= metabolic heat production (W·m-2)
RER = Respiratory exchange ratio
= Oxygen consumption (L·min-1 )
SA = Surface area (m2)
RER was given a value of 1.0 since a change of ±0.15 (maximum physiological range for non-protein oxidation) from a reference value of 0.85 would lead to an error of less than 3.6% in M (Tikuisis 1999).
Since two different groups of participants were used, VO (mL·kg-1·min-1) was calculated by dividing VO by the mass (kg) of the participant to normalize values relative to body mass between the different study subjects.
Predicted survival times (PST) were calculated using the Cold Exposure Survival Model (CESM), a software program based on physiological responses to cold (e.g., vasoconstriction, shivering) and heat transfer theory (Tikuisis 1995; 1997) that predicts the survivability of hypothermic casualties subject to their anthropometrics and the immersion conditions.
2.6 Statistical Analyses
MSHL, T , TGI, and M values were compared within the same study using one way analyses of variance (ANOVA) with repeated measures to detect significant differences between the test conditions. MSHL and M were compared at the end of the immersions, while the absolute changes in T (∆T ) and TGI (∆TGI) over the 3 h period were compared separately. VO data were compared across the two studies with a two way ANOVA, with a post hoc Tukey’s test to determine the direction of any significant effects. All tests were performed to an alpha level of 0.05. Results are presented as means with standard deviation [SD].
3.0 Results
3.1 Study 1
All subjects completed the 3 h immersions in Study 1 and no water ingress was evident after the immersions.
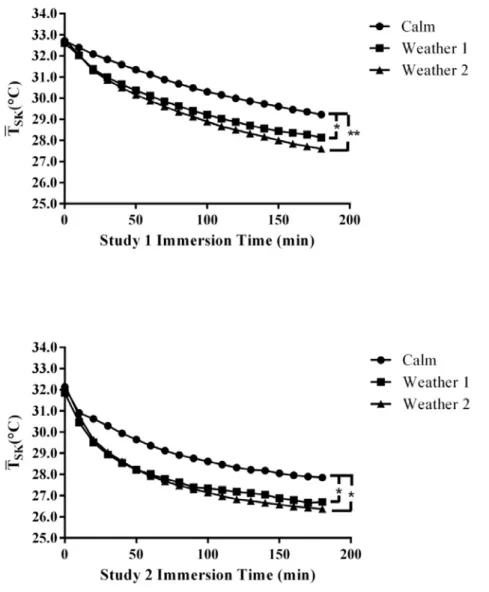
Compared to Calm (62.96 [2.98] W·m-2), MSHL was significantly greater in Weather 1 (76.75 [6.26] W·m-2) and in Weather 2 (79.53 [6.24] W·m-2) (Figure 1). There were no significant differences in MSHL between the two weather conditions. Consistent with the heat loss data, T fell a significantly greater amount in Weather 1 (-4.36 [0.74]°C) and Weather 2 (-5.09 [0.79]°C) compared to Calm (-3.39 [0.39]°C) (Figure 2). There were no significant differences in ∆T between Weather 1 and Weather 2.
There were no significant differences in the change in TGI across all conditions during the immersions (Figure 3). ∆TGI was -0.10 [0.31]°C in Calm; -0.29 [0.30]°C in Weather 1; and -0.20 [0.28]°C in Weather 2.
There were no significant differences in M during the last 30 minutes of the immersions across all conditions in Study 1 (Table II). Mean M during the last 30 minutes was 57.53 [7.81] W· m-2 in Calm; 59.61 [19.54] W·m-2 in Weather 1; and 64.52 [11.80] W·m-2 in Weather 2.
3.2 Study 2
After their immersions in Study 2, subjects weighed an average of 130 g less after immersions in Calm; 30 g less after Weather 1, and 130 g more after Weather 2. The decrease in the weight of the subjects after the Calm and Weather 1 tests was attributed to the upper surface of the suit (which remained in air) partially drying on the horizontally reclined subjects, thereby reducing the total weight. The increase in weight after the Weather 2 tests was attributed to water becoming trapped in exterior pockets on the immersion suit designed to contain excess suit fabric that may bunch up when shorter individuals wear the suit. The wave heights in the Weather 2 condition were
large enough to wash over the subjects wetting the upper surface of the suit and depositing water in these pockets.
Similar to Study 1, MSHL was significantly greater in Weather 1 (102.06 [11.98] W·m-2) and Weather 2 (107.48 [3.63] W·m-2) compared to Calm (79.45 [9.19] W·m-2) (Figure 1). There were no significant differences in MSHL between the two weather conditions.
Figure 1. Mean skin heat loss (W·m-2) averaged over the last 5 min of the 3 h immersions in Studies 1 and 2 (Mean [SD]; S1 = Study 1, S2 = Study 2; Study 1 n = 12, Study 2 n = 10; * = P < 0.05, ** = P < 0.001).
In Study 2, T fell by a significantly greater amount in Weather 1 (-5.14 [1.11]°C) and Weather 2 (-5.78 [0.61]°C) compared to Calm (-4.27 [0.63]°C]) (Figure 2). There was no significant difference in ∆T between Weather 1 and Weather 2.
Figure 2. Absolute T (°C) during the 3 h immersions in Studies 1 and 2 (Study 1: n = 12, average SD (°C) = Calm: 0.62, W1: 0.48, W2: 0.61; Study 2: n = 10, average SD (°C) = Calm: 0.61, Weather 1: 0.71, Weather 2: 0.93; * = P < 0.05; ** = P < 0.001).
The temperatures reported from the gastro-intestinal pills of two subjects were considered unreliable due to technical difficulties with the measurements and were not included in the subsequent trial analysis of TGI. A retrospective power calculation was performed and a sample size of n = 8 was sufficient for reporting results at 80% power when detecting a difference (delta) of at least 0.23°C.
There were no significant differences in the change in TGI across all immersion conditions in Study 2 (Figure 3). The change in TGI was -0.35 [0.14]°C in Calm; -0.38 [0.15]°C in Weather 1; and 0.29 [0.25]°C in Weather 2.
Figure 3. Absolute TGI (°C) during the 3 h immersions in Studies 1 and 2 (Study 1: n = 12, average [SD] (°C) Calm: 0.24; Weather 1: 0.26; Weather 2: 0.30; Study 2: n = 8, average [SD] (°C) Calm: 0.29; Weather 1: 0.31; Weather 2: 0.29).
Similar to Study 1, there were no significant differences in M during the last 30 minutes across all conditions in Study 2 (Table II). Mean M during the last 30 minutes was 82.06 W·m-2 in Calm; 92.04 [8.48] W·m-2 in Weather 1; and 95.81 [20.15] W·m-2 in Weather 2.
VO (mL·kg-1
·min-1) was found to be significantly higher for the subjects who were wet underneath their immersion suits (Study 2) in each immersion condition compared to those who were dry in Study 1 (Table II).
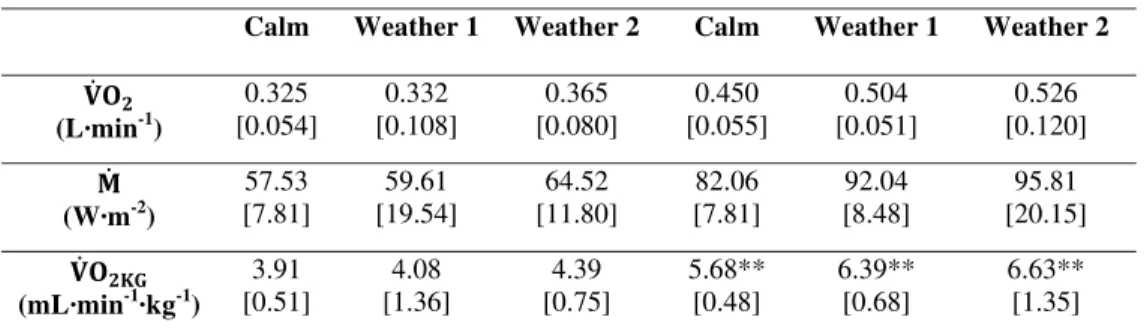
Table II: Average VO (L·min-1), M (W·m-2), and VO (mL·kg-1·min-1) during the last 30 min of the 3h immersions for the Dry (Study 1) and Wet (Study 2) groups of subjects. (Mean [SD]; n for “Dry” = 12, n for “Wet” = 10; ** = P < 0.001 between Study 1 and Study 2).
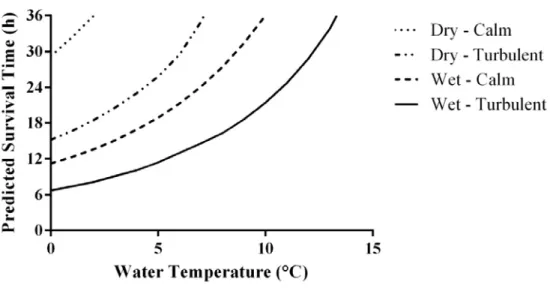
Predicted survival times (PST) were generated using CESM and the average of the subjects’ anthropometric values of both studies (Figure 4). PST beyond 36 h are not given by the CESM as it is assumed that after this time factors other than hypothermia (e.g. dehydration, predation) are far more likely to cause death (Keefe and Tikuisis 2008). PST was less than 36 h for the dry suit condition (Study 1) in calm water at a temperature lower than 2°C. This threshold was raised to 7°C when wind and waves (i.e. turbulent condition) were added to the CESM simulation. For example, the addition of turbulence when conditions were dry under the suit (Study 1) reduced PST from > 36 h to 18.5 h in 2°C water. For the leakage condition (Study 2) in calm water, PST exceeded 36 h until a water temperature of lower than 10°C was applied. In 2°C calm water, PST was 11.2 h, and the addition of wind and waves reduced PST further to 6.7 h.
Study 1 Study 2
Calm Weather 1 Weather 2 Calm Weather 1 Weather 2
(L·min-1) 0.325 [0.054] 0.332 [0.108] 0.365 [0.080] 0.450 [0.055] 0.504 [0.051] 0.526 [0.120] (W·m-2) 57.53 [7.81] 59.61 [19.54] 64.52 [11.80] 82.06 [7.81] 92.04 [8.48] 95.81 [20.15] (mL·min-1·kg-1) 3.91 [0.51] 4.08 [1.36] 4.39 [0.75] 5.68** [0.48] 6.39** [0.68] 6.63** [1.35]
Figure 4. CESM PST (h) for Studies 1 (Dry) and 2 (Wet) subjects (“Turbulent” = wind and waves condition) based on data obtained during the last 30 min of the 3 h immersions.
PST for when conditions were dry under the suit in 11°C water (mean temperature of Study 1) were in excess of 36 h for both the calm and turbulent conditions (Figure 4); this is consistent with the deep body temperatures observed in Study 1. PST for the leakage condition (Study 2) in 8.5°C water (mean temperature of Study 2) were approximately 27 and 16 h in calm and turbulent conditions, respectively, considerably less than the dry condition. Although no significant differences in deep body temperature were observed between conditions in Study 2, it is possible that it would have fallen significantly beyond 3 h of immersion in the turbulent versus calm condition due to the increased convective heat loss.
4.0 Discussion
This study sought to examine the effect of wind and waves on thermal responses when subjects were kept dry under the immersion suit (Study 1) and when they were pre-wetted under the suit (Study 2) to simulate water leakage. The rationale for this work was that immersion suits are not currently being tested in conditions representative of those typically found during maritime accidents, but instead in relatively innocuous laboratory conditions that might overestimate performance, especially if they leak. This discrepancy could lead to unexpectedly poor performance in an emergency situation, possibly resulting in fatal consequences, as search and rescue protocol could be based on unrealistic expectations of survival time. The main findings from this study were: wind and waves significantly increased heat loss compared to calm water (Figure 1); H1 is therefore accepted. However, this did not result in a significantly greater decrease in deep body temperature compared to calm water (Figure 3), probably because subjects were able to adjust their thermoregulation (i.e., increase metabolic heat production via shivering) to compensate for the added heat lost; H2 is therefore rejected. Yet, wind and waves did result in lower predicted survival times (Figure 4), which suggests that immersion suit performance determined in standards testing that prescribe calm water tests, may be over-estimated compared to some emergency scenarios where wind and waves are present.
Our data agree with some previous studies, but are not consistent with others. The significant increase in heat loss measured in the current studies (Figure 1) agrees with the findings of Ducharme and Brooks (1998) who found increasing wave heights significantly increased heat loss compared to calm water. Similar to work by Hayes and et al. (1985), there was a trend for waves to increase heat loss (Figure 1) which did not translate into a significant fall in deep body temperature (Figure 3). The current studies also agree with the results reported by Steinman and et al. (1987) who reported that immersions in wave conditions while wearing immersion dry suits did not result in a significantly greater fall in deep body temperature compared to those seen in calm water.
However, our data are not in agreement with previous work by Tipton (1991), who found that their subjects, whilst wearing an uninsulated immersion dry suit, were
unable to stabilize their fall in deep body temperature while immersed in conditions with mild wind, waves, and periodic spraying. A possible explanation for this discrepancy is that the subjects in the study by Tipton (1991) were immersed in 4°C water which was much lower than the temperatures used in the current studies, and the dry suit used by Tipton accumulated 1.32 L of water leakage over the duration of the test. Since water leakage underneath an immersion suit will reduce the overall insulation provided (Hall and Polte 1956, Light et al. 1987, Tipton and Balmi 1996) due to the water replacing the trapped air in the insulative material of the inner garment, the thermal protection provided by that particular immersion suit decreased over time to the point where the subjects were unable to stabilize their fall in deep body temperature. Due to the lack of significant change in deep body temperature in the current studies (Figure 3), the thermal stress was, by definition, compensable. This was most likely accomplished by decreased cutaneous blood flow and an increase in metabolic heat generation through shivering, which was evident in most subjects by the end of each 3 hour test. Maximum vasoconstriction, and therefore the maximum increase in “internal” insulation due to unperfused skin, occurs when mean skin temperature is below 30°C (Barcroft and Edholm 1943). T in both studies (Figure 2) was below 30°C, which is consistent with this suggestion.
The PST in Study 2 confirms that lowering the water temperature or worsening the immersion conditions and increasing water leakage will increase the strain on the thermoregulatory system to a point where heat loss will become uncompensable, resulting in a falling deep body temperature. For example, for the average individual in the present studies wearing a dry immersion suit in calm, 2°C water, the PST is near the maximum of 36 h (Figure 4). To achieve the same PST when wind and waves are added, the water temperature must be closer to 8°C. In this example, immersions in 2°C calm water wearing an immersion suit produces a level of strain on the thermoregulatory system equivalent to that seen on immersion in 8°C with wind and waves. The same effect is observed with the PST when individuals are wet underneath the immersion suit. To achieve the same PST with water under the immersion suit, as when dry in 2°C water, the water temperature would have approximate 10°C (Figure 4). When the subjects were dry underneath the immersion suit (Study 1), the low VO and M values (Table II) indicated that only a mild level of shivering was required to
compensate for the thermal stress. Not surprisingly, VO and M were significantly higher for the Study 2 subjects who had 500 mL of water underneath their immersion suits (Table II). This can be attributed to both the wetting of the underclothing, and a lower water temperature that the subjects were immersed in; both of which increased the thermal stressed placed upon them. Thus, while they were able to maintain a stable deep body temperature (Figure 3), doing so incurred greater “physiological cost” (increased shivering thermogenesis) compared to Study 1. That is, the thermal stress was compensable in Study 2, but the 500 mL of leakage, and lower water temperature during the immersion, resulted in a greater thermoregulatory strain. Therefore, a sensible approach to the evaluation of protective clothing should address two questions: 1. Does the clothing allow the wearer to thermoregulate (i.e. is the thermal stress compensable) in realistic conditions?; 2. If so, at what “physiological cost”? For many protective clothing assemblies the critical defence will not be the achievement of thermal balance (many will do this), but the “cost” in terms of how long the increased metabolic heat production and substrate utilisation can be sustained.
Changing the water temperature, immersion conditions, and level of water underneath an immersion suit will increase or decrease the level of thermal stress that the thermoregulatory system must compensate, and thus the amount of physiological strain a person experiences when trying to maintain a stable deep body temperature. A decrease in water temperature would increase the thermal gradient between it and the skin increasing heat loss. The addition of waves and winds would increase convective heat loss as increased water/air particle velocity increases heat loss (Witherspoon et al. 1971). Water leakage underneath an immersion suit has also been shown to significantly increase heat loss compared to being dry (, Light et al. 1987, Tipton and Balmi 1996). A person may be able to thermoregulate in a calm water laboratory setting, but the conditions typically found offshore may increase thermal stress due to the addition of wind, waves, and unexpected water leakage to the point where it is uncompensable resulting in falling deep body temperatures and hypothermia. Therefore, the critical question is what point does the thermal stress of an environment, whether caused by leakage into a suit, water temperature, wind or waves move from compensable to uncompensable?
5.0 Study Limitations
Even though the addition of water underneath the immersion suits in Study 2 resulted in greater strain on the thermoregulatory system, the subjects did not experience a significant drop in deep body temperature during those tests. A limitation of the current study was that the temperature of the water in both studies, when combined with the level of insulation provided by the immersion ensemble, did not induce a level of thermal stress that exceeded the compensatory capabilities of the thermoregulatory system. The water temperatures used were higher than prescribed in testing standards (e.g. 2°C for CAN/CGSB-65.16-2005) or recorded offshore. The inability to set water temperatures in the physical tests closer to those values offshore necessitated the use of modelling software to predict what would happen in colder environments. However, the CESM is a robust software program that has been validated against many real situations and has shown to accurately predict drops in deep body temperature (Keefe and Tikuisis 2008, Tikuisis 1995; 1997). Its prediction of a reduced PST in lower water temperatures with wind and waves compared to calm water for the suit tested concurs with expectations.
6.0 Conclusions
It is concluded that testing and certifying immersion suits with humans in calm water will result in an overestimation of survival performance in harsher, but more realistic, conditions such as those found offshore that often include wind and waves, and the possibility of water leakage, all of which will increase thermal stress. If this stress is not compensable by the thermoregulatory system, deep body temperature will fall resulting in the potential development of fatal hypothermia that might not be anticipated from tests undertaken in calmer conditions.
7.0 Conflict of Interest Statement
8.0 Acknowledgements
The authors are grateful to the financial support provided by Transport Canada and the Program of Energy Research and Development (PERD).
The authors would like to thank the project’s research assistant, Lise Petrie, for her help and dedication as well as all the staff at National Research Council of Canada who were involved with this research.
The first author is extremely grateful to Dr. Chris Brooks and Dr. Scott MacKinnon for all their help and support over the years.
We would like to extend our gratitude to all our subjects who volunteered for this research.
9.0 References
Barcroft, H., and O. G. Edholm. 1943. The effect of temperature on blood flow and deep temperature in the human forearm. J Physiol 102 (1):5-20.
Transportation Safety Board of Canada. 2010. Aviation Investigation Report . Main Gearbox Malfunction/ Collision With Water. Cougar Helicopters Inc. Sikorsky S-92A, C-Gzch. St. John's, Newfoundland and Labrador, 35 NM E. 12 March 2009. A09A0016.
Canadian General Standards Board. 2005. Immersion Suit Systems. CAN/CGSB-65.16-2005.
Domitrovich, J. W., J. S. Cuddy, and B. C. Ruby. 2010. Core-temperature sensor ingestion timing and measurement variability. J Athl Train 45 (6):594-600. Ducharme, M. B., and C. J. Brooks. 1998. The effect of wave motion on dry suit
insulation and the responses to cold water immersion. Aviat Space Environ Med 69 (10):957-64.
Durnin, J. V., and J. Womersley. 1969. The relationship between skinfold thickness and body fat in adults of middle age. J Physiol 200 (2):105-106.
Frampton, D. R., and P. B. Savage. 2008. Search and Rescue Operation Report: Sinking of Checkmate III: Case N2008-0015. Maritime Rescue Sub-Center St. John's. Gehan, E. A., and S. L. George. 1970. Estimation of human body surface area from
height and weight. Cancer Chemother Rep 54 (4):225-35.
Hall, J. F., Jr., and J. W. Polte. 1956. Effect of water content and compression on clothing insulation. J Appl Physiol 8 (5):539-45.
Hardy, J.D., and E.F. DuBois. 1938. The technic of measuring radiation and convection
J of Nutr 15:461-75.
Hayes, P.A. , P.J. Sowood, and R. Crackness. 1985. Reactions to cold water immersion with and without waves. RAF Instiute of Aviation Medicine.
Hayward, J. S., and J. D. Eckerson. 1984. Physiological responses and survival time prediction for humans in ice-water. Aviat Space Environ Med 55 (3):206-11. International Maritime Organization. 2010. Life-Saving Appliances.
Keefe, A. A., and P. Tikuisis. 2008. A guide to making stochastic and single point predictions using the Cold Exposure Survival Model. Defense Research Development Canada.
Light, I. M., A. Avery, and A. M. Grieve. 1987. Immersion suit insulation: the effect of dampening on survival estimates. Aviat Space Environ Med 58 (10):964-9. Peronnet, F., and D. Massicotte. 1991. Table of nonprotein respiratory quotient: an
update. Can J Sport Sci 16 (1):23-9.
Steinman, A. M., J. S. Hayward, M. J. Nemiroff, and P. S. Kubilis. 1987. Immersion hypothermia: comparative protection of anti-exposure garments in calm versus rough seas. Aviat Space Environ Med 58 (6):550-8.
Tikuisis, P. 1995. Predicting survival time for cold exposure. Int J Biometeorol 39 (2):94-102.
Tikuisis, P. 1997. Prediction of survival time at sea based on observed body cooling rates. Aviat Space Environ Med 68 (5):441-8.
Tikuisis, P. 1999. Considerations for the measurement and analysis of heat debt for cold exposure. J. Human-Environ. Sys. 2:9-18.
Tipton, M. J. 1989. The initial responses to cold-water immersion in man. Clin Sci
(Lond) 77 (6):581-8.
Tipton, M. J. 1991. Laboratory-based evaluation of the protection provided against cold water by two helicopter passenger suits. J Soc Occup Med 41 (4):161-7.
Tipton, M. J. 1995. Immersion fatalities: hazardous responses and dangerous discrepancies. J R Nav Med Serv 81 (2):101-7.
Tipton, M. J., and P. J. Balmi. 1996. The effect of water leakage on the results obtained from human and thermal manikin tests of immersion protective clothing. Eur J
Appl Physiol Occup Physiol 72 (5-6):394-400.
Witherspoon, J. M., R. F. Goldman, and J. R. Breckenridge. 1971. Heat transfer coefficients of humans in cold water. J Physiol (Paris) 63 (3):459-62.
![Figure 1. Mean skin heat loss (W·m -2 ) averaged over the last 5 min of the 3 h immersions in Studies 1 and 2 (Mean [SD]; S1 = Study 1, S2 = Study 2; Study 1 n = 12, Study 2 n = 10; * = P < 0.05, ** = P < 0.001)](https://thumb-eu.123doks.com/thumbv2/123doknet/14087379.464261/14.918.235.659.358.672/figure-averaged-immersions-studies-study-study-study-study.webp)
![Figure 3. Absolute T GI (°C) during the 3 h immersions in Studies 1 and 2 (Study 1: n = 12, average [SD] (°C) Calm: 0.24; Weather 1: 0.26; Weather 2: 0.30; Study 2: n = 8, average [SD] (°C) Calm: 0.29; Weather 1: 0.31; Weather 2: 0.29)](https://thumb-eu.123doks.com/thumbv2/123doknet/14087379.464261/16.918.260.684.233.730/figure-absolute-immersions-studies-weather-weather-weather-weather.webp)