HAL Id: hal-01191220
https://hal.archives-ouvertes.fr/hal-01191220
Submitted on 29 May 2020
HAL is a multi-disciplinary open access
archive for the deposit and dissemination of
sci-entific research documents, whether they are
pub-lished or not. The documents may come from
teaching and research institutions in France or
abroad, or from public or private research centers.
L’archive ouverte pluridisciplinaire HAL, est
destinée au dépôt et à la diffusion de documents
scientifiques de niveau recherche, publiés ou non,
émanant des établissements d’enseignement et de
recherche français ou étrangers, des laboratoires
publics ou privés.
Participatory modelling with farmer groups to help
them redesign their livestock farming systems
Lucie Gouttenoire, Sylvie Cournut, Stéphane Ingrand
To cite this version:
Lucie Gouttenoire, Sylvie Cournut, Stéphane Ingrand. Participatory modelling with farmer groups to
help them redesign their livestock farming systems. Agronomy for Sustainable Development, Springer
Verlag/EDP Sciences/INRA, 2013, 33 (2), pp.413-424. �10.1007/s13593-012-0112-y�. �hal-01191220�
RESEARCH ARTICLE
Participatory modelling with farmer groups to help
them redesign their livestock farming systems
Lucie Gouttenoire&Sylvie Cournut&Stéphane Ingrand
Accepted: 3 August 2012 / Published online: 5 September 2012 # INRA and Springer-Verlag, France 2012
Abstract To improve sustainability, farmers may want to redesign their livestock farming systems in depth. Systemic modelling has proved an efficient tool to study complex issues regarding farming systems, but it remains inefficient to support farmers in their system redesign processes. This paper describes and discusses a novel method to model livestock farming systems with groups of farmers to help them redesign their own systems. Modelling livestock farm-ing systems at the farm scale with farmer groups is an original approach in livestock farming system modelling. Following a constructivist approach, our method involves working with farmers already involved in redesign process-es and building causal maps according to their own repre-sentations, without using models previously created by scientists. Applying the method, we built two causal maps of livestock farming system operation, each one built with a group of five farmers including both those converting and converted to organic farming. Converting to organic farm-ing was considered as one example of a redesign process. On the basis of a subjective assessment by both the partic-ipating farmers and researchers, and an analysis of map
structures, we assessed the method’s strengths and weak-nesses. We considered that one of its main advantages lay in its collective dimension: sharing, comparing and question-ing interested the participatquestion-ing farmers greatly; however, it requires good facilitation skills and suitable group compo-sition. Furthermore, the formalising process identified, for example, vicious circles in system operation, which made the farmers think about solutions for breaking them. Finally, analysis of map structures identified similarities and differ-ences between the two groups that were discussed with both of them during a final workshop; this activity continued farmers’ self-reflection about their systems, which may help lead to innovative and more sustainable livestock farming systems.
Keywords Livestock farming systems . Modelling . Participation . Redesign . Support tools . Causal mapping
1 Introduction
Livestock farming has recently come under close scrutiny, especially in response to environmental issues (Steinfeld et al.2006). There is increasing societal pressure for more sus-tainable livestock practices, with a strong emphasis on the environmental pillar of sustainability. In response, stock-breeders may decide to convert their systems to new forms of operation that they judge more sustainable, in which case they face what we call‘systemic innovation’. ‘Systemic innovation’ contrasts with ‘genetic innovation’, such as new animal or plant genotypes, and with‘technological innovation’, such as new tools to calculate animal diets or fertiliser levels (Meynard et al.2006). Systemic, genetic and technological innovations are based on different technological paradigms that have had different impacts on shaping agricultural research, which has disfavoured systemic innovation (Vanloqueren and Baret
L. Gouttenoire (*)
:
S. Cournut:
S. Ingrand INRA, UMR1273 Métafort,63122 Saint-Genes Champanelle, France e-mail: [email protected] L. Gouttenoire
:
S. Cournut:
S. IngrandClermont Université, VetAgro Sup, UMR Métafort, 63370 Lempdes, France
L. Gouttenoire
:
S. Cournut:
S. Ingrand AgroParisTech, UMR Métafort, 63170 Aubière, FranceL. Gouttenoire
:
S. Cournut:
S. Ingrand Irstea, UMR Métafort,63170 Aubière, France
Agron. Sustain. Dev. (2013) 33:413–424 DOI 10.1007/s13593-012-0112-y
2009). However, more recently, systemic innovation has been significantly encouraged. For example, the International Assessment of Agricultural Science and Technology for Development has recommended, after a 4-year process involv-ing over 400 international experts, a reorientation of agricul-tural science and technology towards more holistic approaches (IAASTD2008).
Undertaking systemic innovation by switching to new forms of operation in farming systems entails certain transition processes. In converting to organic farming for instance, such transition processes, the importance of which is often mini-mised in the literature, would benefit from being addressed in terms of system redesign rather than in terms of simple input substitution (Lamine and Bellon 2009). Both expressions ‘system redesign’ and ‘input substitution’ stem from the ESR model (Hill and McRae1996). According to this model, there are three ways of managing a transition from conven-tional to sustainable agriculture: (1) improving input Efficiency (E), such as in precision agriculture—improving the efficiency of conventional practices without reducing de-pendence on external inputs; (2) input Substitution (S)— replacing chemical inputs by biological inputs, thus replacing conventional practices by more environmentally friendly ones; or (3) system Redesign (R) so as to achieve fertility, productivity and resilience of the farming system thanks to a new ecological balance—preventing problems rather than curing them. A more holistic view of the farming system’s operation may support such redesigning processes. This could be achieved through approaches such as system modelling. A ‘model’ can be broadly defined as a representation of reality (Legay1997). It can be either conceptual (i.e. theoretical) or implemented in a simulation and/or optimisation platform. In the study of farming systems, modelling has proved an effi-cient tool for learning how systems operate, identifying knowledge gaps, predicting change and assisting system man-agers in their decision processes (Malézieux et al.2001). Can modelling also be a relevant tool to help farmers redesign their systems? The present paper aims at considering this question. A preliminary study based on a literature review of livestock farming system models published in English or French in journals referenced in Journal Citation Reports from 2000 to mid-2009 (n079) showed that the following four conditions were never all completely met, which limit-ed the models’ usefulness in helping farmers rlimit-edesign their systems: (1) modelling at the farm scale, (2) addressing the long-term perspective, (3) considering in-depth changes that require questioning the system’s very fabric and (4) includ-ing factors that are relevant for the farmers to decide (Gouttenoire et al.2011). From this study, two main chal-lenges were identified for livestock farming system model-lers. The first, addressed in this paper, is to design modelling processes that directly help farmers consider changes in the operation of their systems, including in-depth changes. The
second, addressed in the accompanying paper (Gouttenoire et al., this issue), is to integrate different time scales, sub-systems and viewpoints within the same model (Gouttenoire et al.2011).
In the literature, it is increasingly recognised that imple-menting participatory modelling projects with farmers is one way of making farming systems models more suitable for the latter (Newman et al.2000; McCown2002; Cerf et al.
2008; Woodward et al.2008). However, few livestock farm-ing system models have been built in a participatory way with farmers. Livestock farming system models built by scientists have been used (Bernet et al.2001) or even mod-ified and enriched (Vayssières et al. 2007; Cabrera et al.
2008) in a participatory way involving farmers, but as of mid-2009, there appear to have been no attempts to build conceptual models of livestock farming system operation solely on the basis of farmer participation, i.e. without using a model previously created by scientists (Gouttenoire et al.
2011). Since then, a conceptual model of livestock farming system was built in such a participatory way with farmers in New Zealand to learn how they see their farm as a system (Fairweather and Hunt 2009). With such a cognitive per-spective, there was no specific assessment of the possible impacts of the modelling process itself on farmers’ decisions about their farming systems. In any case, because the authors did not aim to support participating farmers, this work contributed little to the question of supporting farmers in their system redesign processes using modelling.
We have not mentioned models designed to answer ques-tions at scales larger than the whole farm, for example collectively managing rangelands, defining breeding objec-tives for a local breed, or designing preventive strategies to control the spread of a veterinary disease in a territory. Participatory approaches are more frequent in these cases, in which there is more than one main decision-maker for the problem under consideration. Participatory modelling approaches in all domains were recently reviewed, and most concerned business applications or natural resource manage-ment (Voinov and Bousquet2010). In the latter, a variety of participatory modelling approaches have been developed, using tools such as causal mapping (Prell et al. 2007) or a combination of agent-based models and role-playing games in the ‘Companion Modelling’ approach (Antona et al.
2005). Modelling interactions between cattle farming and forestry in a Thai province in a participatory way with stakeholders to improve landscape management is one re-cent example of the latter case that involved livestock farm-ing systems (Dumrongrojwatthana 2010). The common denominator of these natural-resource-management approaches is that all participants are concerned by the same resource system that can be impacted by their actions. The participatory modelling process makes it possible (1) to develop simulation models integrating diverse stakeholders’
viewpoints to better understand the system under study and (2) to facilitate collective learning, coordination and negoti-ation processes supporting adaptive co-management of re-newable resources (Antona et al. 2005) while addressing individual impacts on participants, such as changes in be-haviour, perceptions, decision-making processes and practi-ces (Etienne2010).
Redesigning a livestock farming system does not concern as many decision-makers and does not require many coordination and negotiation processes; farmers must address specific sit-uations in their own livestock farming systems. However, we hypothesise that collective modelling approaches to livestock farming systems involving farmers who face the same kind of redesign issue will still support them in their individual system redesign processes. Some studies already support our hypoth-esis; collective approaches based on exchanges of practices do exist and have helped farmers (Sulpice et al.2005; Goulet et al.
2008; Eksvärd2009; Vaarst et al.2010), but none is modelling-based.
The objective of this paper is to describe and discuss a novel method to model livestock farming systems with groups of farmers to help them redesign their own systems. Based on the literature review presented above, two charac-teristics of our contribution are original: (1) modelling live-stock farming systems at the farm scale in a participatory way with groups of farmers and (2) supporting farmers in their system redesign processes using modelling.
We first describe our method’s main principles, the study area where it was applied and the methodological process. We then explain, illustrate and discuss its strengths and weaknesses, which were subjectively assessed by the researchers and farmers who participated in the modelling process, in particular by analysing the content of the models we obtained.
2 A participatory method to build causal maps with farmers
2.1 Principles, tools and objectives
It is according to one’s own representations that one thinks, decides and acts. This constructivist principle (Jiggins and Röling 1997; Cossette2003; Bawden 2010) was the basis for our methodological approach. Thus, to support farmers in their system redesign processes using modelling, we decided the following (Gouttenoire et al.2010):
1. Farmers themselves would choose the items to be intro-duced into the modelling process and define the links between these items, according to their own representa-tions; no model created by scientists would be used to begin the modelling process;
2. We would work with farmers already involved in sys-tem redesign processes and willing to exchange ideas on this topic;
3. The modelling process would be carried out in participa-tory workshops rather than individual interviews, so as to share representations and foster farmers’ self-reflection; 4. Practical issues that specifically concerned the
partici-pating farmers would be used to begin the modelling process, so as to focus on livestock practices, facilitate farmers’ expression and prevent overreliance on theory.
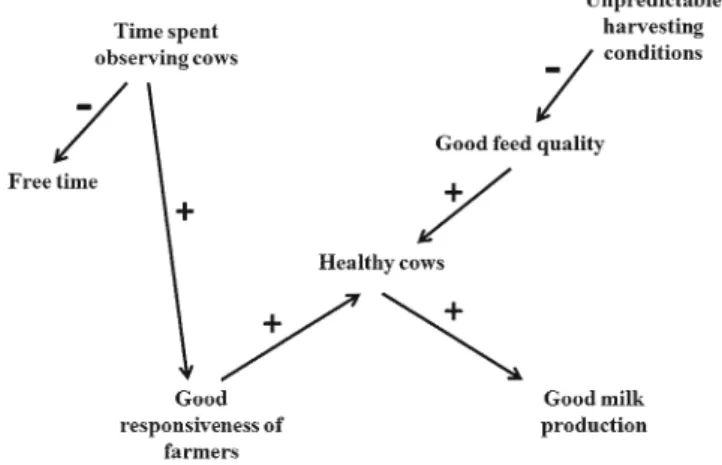
Cognitive mapping, specifically causal mapping, was cho-sen to carry out the modelling process following these four principles, in part because it had already been used in con-structivist perspectives (Cossette2003). A cognitive map is a ‘graphic representation of a set of discursive representations made by a subject with regard to an object in the context of a particular interaction. It is the work of a researcher who con-structs a graphical representation of a discourse uttered or written by a subject’ (Cossette and Audet 1992). A causal map is a cognitive map based on formalising causal relation-ships (cause/effect or means/goal) between items expressed by one or several subjects. Items are represented by words, and causal relationships are represented by arrows (meaning‘may lead to’) from influencing items to influenced items. Arrows can be either positive (if the two items vary the same way) or negative (if they vary in opposite ways) (Fig.1). Causal maps are built using the subjects’ natural language (Cossette and Audet1992), which prevents researchers from formatting the model according to their own representations, thus making participation more meaningful. Furthermore, as causal maps represent the modelled system as a set of items and causal relationships between them, they are useful for systemic anal-ysis—an advantage when more holistic approaches are to be used. Finally, as they are based on causal relationships, they are particularly valuable for examining changes and their consequences for livestock farming systems, which is useful
as support to redesign processes. In natural resource manage-ment (Prell et al. 2007) and in organisational research (Ackermann and Eden2005), causal mapping has been used in group settings to help formulate problems, create and compare conceptual understanding, and explore implications. In the same way, our purpose in using causal maps was not to model the cognitive processes of the actors but rather to build representations useful for discussing redesign of a livestock farming system.
The modelling process (i.e. the mapping process) and the models obtained (i.e. the causal maps) have different meanings for participating farmers and researchers. Because the mapping process itself supports the farmers’ redesign processes, they consider it the end product rather than the causal maps, which interest them less. Consequently, farmers were not required to validate the maps; instead, we asked them to validate the method’s relevance for supporting their redesign processes. In contrast, the causal maps interested the researchers most because (1) they record group exchanges, allowing a posteriori analysis of them and, especially, the method’s ability to support farmers; and (2) they constitute an original representation of livestock farming system operation that can be compared to scientist-built models of such systems.
2.2 Study area
To design and implement our participatory modelling proj-ect, we chose a study area that appeared promising to us given our principles and objectives described above. The project was mainly researcher driven, but we paid special attention to choose an area where the stakeholders expressed strong motivation to participate and where farmers were deeply involved in system redesign processes. Such a study area was found in the Pilat region, a semi-mountainous area (altitude 400–1,400 m) located in the eastern Massif central, France. In this area, 12 dairy cattle farmers converted to organic farming in the late 1990s, which convinced their milk plant to launch an organic milk line. In 2007, the milk plant wanted to increase its organic production and therefore encouraged local milk producers to convert to organic farm-ing by providfarm-ing financial and technical support. The project interested about 15–20 conventional farmers, who began conversion to organic farming in 2007 or 2008, precisely at the time we wanted to implement a participatory model-ling project. This study area particularly interested us for three reasons. First, farmers, local agricultural advisors and the milk plant were clearly involved in collective dynamics and expressed great willingness to discuss the organic proj-ect. In particular, farmers converting to organic farming were highly interested in discussing with those who had converted 10 years before. Second, converting to organic farming is a major redesign process that questions the very fabric of a livestock farming system. Third, the planned
transition processes were oriented towards increasing sus-tainability. We therefore initiated a partnership with the milk plant and the local agricultural advisors, who supported the project until enough farmers volunteered for us to launch the programme.
2.3 Steps of the modelling project
The core of the modelling method was two participatory workshops during which causal maps of livestock farming system operation were built with farmers. Nevertheless, preliminary work was required to prepare these workshops, and further work was required to test how farmers’ self-reflection about their systems could be continued and to assess the modelling process, implementing the methodo-logical approach described below.
2.3.1 Individual on-farm interviews
First, individual semi-structured interviews were carried out with 15 farmers who had indicated their interest in the programme by sending back a coupon in reply to a letter we had sent to all farmers concerned by organic farming in the study area (n033). All the farmers who had indicated their interest were interviewed. Farm operations, conversion to or-ganic farming, health management and feed self-sufficiency were the main topics discussed. The topics ‘health manage-ment’ and ‘feed self-sufficiency’ had previously been identi-fied by farmers and local agricultural advisors as particularly relevant for conversion to organic farming. These interviews allowed us to meet the farmers individually, initiate good working relationships with them and identify‘practical issues’ that were meaningful for them.‘Practical issues’ did not nec-essarily mean short-term technical issues; for example,‘grass silage’ and ‘livestock building and long-term investing’ were two issues identified. Next, at a meeting with the farmers, local agricultural advisors and a representative of the milk plant, we presented the information collected during the interviews and officially invited the farmers to participate in the workshops, whose principles we explained during the meeting. Two groups of five farmers each volunteered to participate in two subsequent workshops per group. The two groups were formed on the basis of geographic proximity of their members’ farms to facilitate logistics. In addition, each group had to include both farmers converting and already converted to organic production. This choice aimed to stimulate group discussions, as the former were highly motivated to learn from the latter, who were just as interested in sharing their experiences. 2.3.2 The modelling process: participatory workshops We then led the modelling process in two steps. The first step had the farmers in each group identify items for the
causal maps during a half-day workshop. The Metaplan technique (Schnelle 1979) was used for brainstorming the practical questions identified via the interviews. All mem-bers of each group were asked at least two open questions previously shortlisted as being of particular interest to its members, for example‘Silage on your farm: what does it mean for you?’ and ‘Calving patterns: what does it conjure up for you?’. The first question was specifically chosen for group 1 because its converting farmers planned to modify the quantities of silage produced and used during their conversion, whereas its converted farmers had used various silage-production strategies during their conversion. One converting farmer wanted to suppress silage production and use, another one wanted to reduce it and the converted farmers were satisfied with their own situations, either with or without silage production and use. Therefore, we thought that discussing silage in this group would lead to a rich and interesting debate for the farmers. In the same way, the second question was specifically chosen for group 2, which was interested in rethinking calving patterns. For each ques-tion, each farmer was asked to write down three to four ideas, using one repositionable note per idea. All notes were then read out loud by farmer volunteers, disagreements were discussed and the notes were placed on a board to form groups of similar ideas. From this display, we later devel-oped a list of all the ideas that had appeared during the workshop, such as ‘healthy animals’, ‘heavy investment’ or‘low ecological footprint’. We either kept farmers’ ideas ‘as written’ on the notes or, if necessary, we slightly reworded them to appear as potential causes and/or effects, which allows them to be interconnected on a causal map (Fig. 1). For example, ‘livestock building’ could not be integrated into a causal map because it does not suggest a cause or consequence. On the contrary, ‘comfortable live-stock building’ can be interpreted as a cause of ‘healthy animals’ and/or as an effect of ‘heavy investment’. Likewise, ‘no livestock building’ can be seen as a cause that impairs cow well-being. Any rewording was as minor as possible and was based on our understanding of work-shop discussions.
The second step of the modelling process was aimed at building one causal map per group by formalising links between items and adding new items. We wanted each map to form a holistic view of a livestock farming system while being as topically rich and varied as possible. The mapping process took place during another half-day work-shop for each group, beginning with five of the list of ideas that it had formulated, which we had selected beforehand. As these five items were to operate as‘modelling kernels’, they had to be as different as possible to build a rich map. Given the complex nature of livestock farming systems and their many interactions, we hypothesised that it would be possible to build a highly integrated view of the system even
with topically different modelling kernels. For group 1, for example, the five ‘kernels’ were ‘healthy animals’, ‘heavy investment’, ‘unpredictable harvesting conditions’, ‘good public image’ and ‘farmer well-being’. We systematically explored each of these five items with each group by drawing one causal map per item, beginning with the item written in the centre of a sheet of paper. We asked the group to tell us all the factors that could influence and be influenced by the centre item. We wrote down the responses and connected them with arrows, repeatedly ensuring that the farmers agreed with the developing map. If group members disagreed, we asked them to discuss the matter until they arrived at a consensus. Farmers could use the same factor on the same or different sheets as often as necessary. Once this exercise was finished for the centre item, we repeated it for each of the secondary items around it, and so on, until the group was satisfied with its map. After this second workshop, we aggregated the five maps built by each group to create one master map per group. This aggregation step was based on the items that appeared on several grids. For most of these items, when for example they were used a second or a third time, the farmers spontaneously noticed that they had already been written for another topic, which reinforced our hypothesis that groups could build inte-grated maps of a livestock farming system from topically different modelling kernels.
2.3.3 Continuing the support process and assessing the modelling process
After this aggregation, we analysed the maps’ structures and used the results to build a discussion support tool that was used during a final workshop with farmers from both groups to further stimulate their reflections. We did not consider the final workshop the end result of the process. As the first two workshops aimed to help the farmers redesign their systems, this final workshop was not essential for them; instead, it can be considered for inclusion in future participatory mod-elling activities. The final workshop also made it possible to collect farmers’ opinions about the strengths and weak-nesses of the first two workshops since farmers were inter-viewed there about what they thought of their participation in the modelling project.
To analyse map structure, we used Decision Explorer soft-ware (Eden2004), which bases analyses on the topography of the causal map, formed by the links between items. To build the discussion support tool, we used this software mainly to identify the most central items in the maps, which have high structural importance, as they are directly and indirectly linked to many other items. The software calculated a centrality score for every item (Eden 2004); the higher the score, the more significant the item is. For the most central items in each map, we calculated the ratio of the number of in-pointing arrows to the total number of in-pointing arrows plus out-pointing
arrows symbolizing direct links (Eden 2004). These ratios indicate an item’s ‘function’ in the model: high ratios indicate ‘outputs’, the expected positive or negative results, whereas low ratios are associated with‘inputs’, the system options or elements of context. A value around 0.5 is associated with items considered to be both inputs and outputs. The systemic nature of the causal maps is visible in these items that repre-sent both objectives and means for the livestock farming system. A graph that compared the most central items in the two maps and their‘function’ ratios constituted our discussion support tool.
3 Strengths and weaknesses of the participatory approach
3.1 Assessing the method’s strengths and weaknesses
Two elements were used to assess the method’s strengths and weaknesses in supporting farmers in their system rede-sign processes: (1) subjective assessment by both farmers and researchers and (2) analysis of map content.
For the subjective assessment, farmers were collectively interviewed about what they thought of their participation in the modelling project during the final workshop (see ‘Continuing the support process and assessing the modelling process’ section). Their answers were audio-recorded and
then transcribed. We researchers also had feelings about how the modelling process may have supported the farmers. These feelings helped structure our analysis of map content, which aimed to illustrate how and to what extent the mod-elling process made it possible to support strategic thinking about the redesign issue.
We considered the two maps obtained as intermediary objects (Vinck1999): they constituted both a support tool to foster discussions between farmers and a way to keep track of the exchanges. One map contained 178 items and 304 links, and the other map contained 128 items and 181 links. Consequently, analysis of their content was not straightfor-ward and used two different media. First, the sheets of paper on which maps had been drawn during the workshops helped visualise the succession of topics that farmers had raised. Many of them were easy to identify as groups of spatially close and strongly interrelated items. Second, all workshops had been audio-recorded, which allowed an ex-ternal observer to listen to the recordings while looking at the sheets to critically assess and validate how we had translated the farmers’ discourses into causal maps.
3.2 Strengths and weaknesses
Benefits of the participatory modelling method for the par-ticipating farmers were found at three levels: (1) the group
supports the individual, (2) modelling helps participants better structure issues and problems, and (3) the causal maps obtained can serve to support further activities with farmers. 3.2.1 The group supports the individual
All farmers interviewed during the final workshop sponta-neously noticed and agreed that working in a group was a major strength of the method. They emphasised that sharing, comparing and thinking together was of great importance to better manage conversion to organic farming. ‘Farmers re-ally need this kind of workshop’, one concluded. In addi-tion, ‘knowing what others do’ was considered to be ‘reassuring’, especially for the converting farmers, who had the opportunity to discover the converted farmers’ practices.
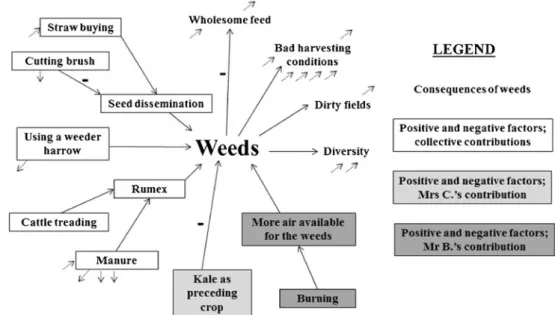
To us, the method appeared a powerful way to enable farmers to share knowledge, experiences, viewpoints and strategies. When analysing the groups’ causal maps and listening to the recordings, we identified topics for which collective analysis may have enriched individual view-points. For example, weed management appeared to be an important concern, as organic specifications ban the use of herbicides. This topic was clearly represented in group 1’s causal map, along with some weed-control methods and consequences of weed infestation on other components of the system (Fig. 2). Although some control methods were known and expressed by all farmers in the group, others were evoked only by one farmer. For example, Mrs C. said that kale as a preceding crop decreased weed abundance. She explained how she had casually discovered this fact by observing that, in the same field in the same year, triticale was less infested by weeds where kale, instead of maize, had been the preceding crop. The other participants agreed to include this idea in the causal map, as an individual experi-ence that may enrich everyone’s thinking. Another partici-pant, Mr B., warned the group against the negative impact of burning, which he claimed ‘gives more air’ (i.e. more ‘room’) to the weeds that proliferate afterwards. The same kind of complementarities was observed for animal health and alternative medicines (not shown).
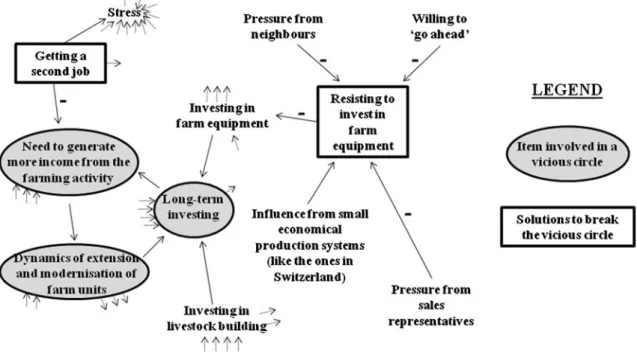
Group mapping may also raise farmer awareness of their unique objectives and strategies and their consequences. For example, Mr P. affirmed that his personality was self-oriented. The mapping process explored the consequences and trade-offs that this trait caused Mr P. to face (Fig.3). In the farmers’
opinion, self-oriented people tend to avoid both associating with other people and organising their harvesting tasks col-lectively due to the constraints they may impose. Although doing so may free up some weekends or provide economies of scale, self-oriented people see the objective of being their own bosses as a priority. Buying a round baler or building a barn hay-drying system may therefore appear to them to be a good
solution for eliminating a number of work-organisation con-straints. In contrast, other farmers like to be involved in collective harvesting tasks and wish to keep doing so. To us, collective analysis adds meaning to everyone’s actions: par-ticipants can question their own position within a range of possibilities, which we assume to be a good way to foster strategic thinking and consequently to support farmers in their system redesign processes.
Implementing collective approaches specifically to sup-port farmers in their individual situations is not new. Here, however, the fact that the workshops were focused not on the situation of a given participant but on a model to be built collectively by all the participants is original. Furthermore,
farmers greatly appreciated the facilitation method and having all of their ideas taken into account in the map:‘I did not know this method [causal mapping]. I like it. Everybody can partic-ipate. It prevents the facilitator from only listening to the ones who speak the loudest!’.
Facilitators’ tasks are particularly important in this method to initiate and maintain good working dynamics during work-shops. First, they must choose good initiating questions for the Metaplan during the first workshop to stimulate participation. Then, they must explain the rules and enforce them: for instance, respectful discussions and listening, enthusiasm, no judgment… Last, they must ensure that everyone has the opportunity to speak. During the first workshops, largely
Fig. 2 Causal mapping makes it possible to practice collective analysis on common problems. Excerpt from a causal map built with one group of farmers
Fig. 3 Group mapping makes it possible to explore the implications of individual specificities and the associated tradeoffs. Excerpt from a causal map built with one group of farmers
based on writing, reading and commenting on repositionable notes, this task was easy. But during the second workshop, balanced participation of the farmers was more difficult to achieve, especially in group 2 where some converted farmers were considered leaders of the local organic‘movement’ and spoke more than the others. Consequently, developing facili-tation skills is critical to carry out such participatory projects. To sum up, facilitation skills and group composition are two factors that largely influence the method’s success. In a meta-analysis of different group experiences aimed to help farmers better manage herd health (‘farmer stable schools’), Vaarst el al. (2010) noticed the importance of group com-position and, especially, participant motivation. In our case, motivation was high for both the converting and the con-verted farmers. Combining converting and concon-verted farmers within a same group helped foster motivation and create heterogeneity conducive to richer discussions. Thus, there is a tradeoff between sufficient homogeneity within the group to facilitate expression and sufficient heterogeneity to guarantee rich debates.
3.2.2 Modelling helps participants better structure issues and problems
In some cases, causal maps revealed‘loops’ in the system in which a chain of causes and consequences loops back on itself to form a‘vicious circle’, ‘virtuous circle’ or ‘regula-tory loop’ (Eden2004). Vicious and virtuous circles have an even number of negative arrows or only positive arrows and indicate regenerative or degenerative dynamics in which a
perturbation results in exponential growth or decline (Eden
2004). The subjective opinion of the person or people who develop the causal map determines whether the circle is considered virtuous (good) or vicious (bad). In contrast, regulatory loops have an odd number of negative arrows, which depicts auto-regulation; perturbation will result in stabilising dynamics, bringing the activity back into equi-librium (Eden2004).
Vicious circles and regulatory loops were identified in our causal maps, allowing participants to think about how to break the former and reinforce the latter. For example, group 1 identified a vicious circle concerning long-term farm invest-ment (Fig.4): the more one invests, the greater the need to generate income from farming to reimburse the loans, and the greater the pressure to extend and modernise, which in turn leads to new investment, and so on. The farmers came up with two ideas to break this vicious circle: either get a second job to get out of debt without having to extend the farm structure, which may prove stressful, or avoid investing, especially in farm equipment. The latter option implies resisting different pressures but can be made easier by adopting certain econom-ical production practices. This idea was introduced by Mr B., who had visited small successful farms in Switzerland based on economical practices such as low inputs, or inexpensive but comfortable livestock buildings, that had greatly impressed and influenced him.
One regulatory loop identified concerned cow health: when cows become unhealthy, milk protein and fat content can decrease, which warns farmers to respond to the prob-lem to nurse the cows back to health (Fig. 5). One way to
Fig. 4 Modelling makes it possible to identify vicious circles and think about solutions for breaking them. Excerpt from a causal map built with one group of farmers
reinforce the stabilising effect of this loop is to pay more attention to the signals of impaired health, which can be achieved by asking external visitors such as inseminator, veterinarian, and other farmers for their opinion on the herd’s apparent health status.
Without the mandatory formalisation of modelling, it prob-ably would have been more difficult to identify these phe-nomena as vicious circles or regulatory loops and consequently to find solutions for breaking or reinforcing them, respectively. This study therefore reaffirms the rele-vance of modelling for treating complex problems, although the way its models were conceived and used remains original. Of the 79 models, 74 were computer simulation and/or opti-misation tools (Gouttenoire et al.2011). Conceptual model-ling to formalise, understand and improve the fabric of livestock farming systems therefore has yet to become well established. However, this study suggests that this kind of qualitative approach, which does not require computers, can support farmers in their redesign processes and thus offers interesting prospects for conceptual modelling of livestock farming systems. According to one farmer,‘This thinking exercise gave us some clues that each of us can afterwards transform into solutions adapted to their own situation’. They emphasised that creating their own models was a source of pride, and they particularly appreciated the fact that they were not given‘ready-made answers’ by researchers.
3.2.3 Causal maps can support further activities with farmers
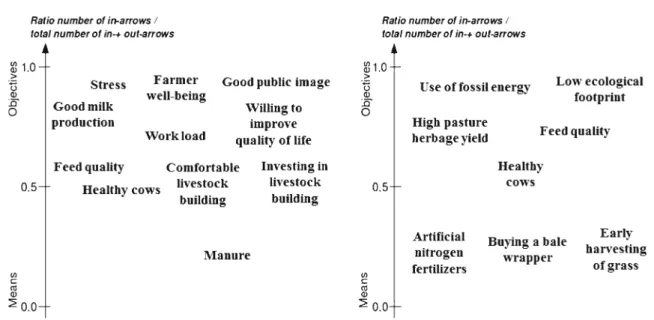
The discussion support tool we built after the workshops (Fig.6) from analysis of map structure contained the most central map items (the top 6 % of items in each map). We chose the number of items to be selected on the basis of the distribution of their centrality scores (Fig.7).
‘Healthy cows’ and ‘feed quality’ appeared as top items for both groups. Their‘function’ ratios were similar between groups and at an intermediate level, suggesting that these items lay at the core of the livestock farming systems to be redesigned. This result did not surprise the farmers.
In contrast, the central items considered objectives or results differed significantly between the two groups: they were farmer-centred for group 1 (‘stress’, ‘farmer well-being’, ‘good public image’) but environmentally oriented for group 2 (‘use of fossil energy’, ‘low ecological foot-print’). There were also differences in the most important questions to answer during the redesign process. One of the main concerns for farmers in group 1 was whether to invest in livestock buildings to make them more comfortable for both farmer and animals (items—‘comfortable livestock building’, ‘investing in livestock building’, ‘willing to im-prove quality of life’). In group 2, one important issue was how to manage the forage system without using artificial nitrogen fertilisers, which are banned under organic specifi-cations (items—‘artificial nitrogen fertilisers’, ‘high pasture herbage yield’, ‘buying a bale wrapper’, ‘early harvesting of grass’). These differences may be related to the details of each mapping process such as initiating questions, model-ling kernels, or to certain characteristics of each group. Farmers in group 1 live in an area where stall-type stabling is common, but its potentially negative influence on animal welfare means that organic specifications only tolerate stall-stabling under certain conditions. This led these farmers to think about and possibly consider adopting alternative sol-utions. In group 2, not concerned by stall-type stabling, but by cubicle buildings or straw bedding, the farmers were used to thinking about how to improve their forage system, as one of the group belonged to a network of reference farms and thus had worked with forage-system agricultural advi-sors and discussed this topic with group members. We do
Fig. 5 Modelling makes it possible to identify regulatory loops and think about solutions for reinforcing them. Excerpt from a causal map built with one group of farmers
not aim to explain the differences between the two maps in a deterministic way; instead, we wish to identify their respec-tive emergent properties so that participating farmers can be made aware of them and consequently better position their concerns within a range of possibilities.
Other observations from map analysis can be shown to farmers. For example, farmers were shown the similarities and differences mapped for fertilisers. In both maps (Fig.6), fertilisers (‘manure’ or ‘artificial nitrogen fertilisers’) appeared
at the bottom of the list of top items, as means. In each group, using fertilisers had both a positive impact (‘good public im-age’ or ‘high pasture herbage yield’) and a negative impact (‘work load’ or ‘use of fossil energy’). Farmers were surprised by this result, especially those in group 2, who were disap-pointed that‘artificial nitrogen fertilisers’ were so central even though they no longer used them, as banned by the organic specifications. After, the farmers concluded that although arti-ficial nitrogen fertilisers were no longer used, they remained
Fig. 6 Analysing map structure identifies similarities and differences between the two groups that are later discussed with all participants
Fig. 7 Distribution of centrality scores in the map built with group 1. Eleven items out of 178 were selected for the discussion support tool built after the modelling workshops
important in their representations of livestock farming system operation, at least for group 2.
By using an analysis that identifies emergent properties in causal map structures and discussing these properties with farmers to foster strategic thinking, we clearly did not use modelling as a way to produce generic knowledge. On the contrary, we tried to use the particular characteristics of the two maps instead of averaging them, which makes the representations built even more applicable. Following the constructivist epistemology, our purpose was not to create a body of objective knowledge but to formulate ‘fresh per-spectives’ (Jiggins and Röling1997).
These post-workshops activities are only an example of what can be done with the causal maps built with farmers to continue their self-reflection. Other activities could be proposed if the method was to be applied with other groups of farmers faced with other kinds of redesign questions. This proposal aims to give new ideas to those who want to support farmers in system redesign processes. It can be seen as a way to enrich the group-support methods already used by agricultural advisors.
4 Conclusion
Working with a new participatory modelling method with two groups of dairy farmers, each constituted by farmers both converting and converted to organic farming, we built two causal maps representing the operation of a livestock farming system. On the basis of a subjective assessment by both the participating farmers and researchers, and an analysis of the map structures, we assessed the method’s strengths and weak-nesses in supporting farmers in their system redesign processes. We found that one of the method’s main strengths rested on its collective dimension: sharing, comparing and questioning the similarities and differences in their livestock farming systems greatly interested the participating farmers. This collective dimension requires good facilitation skills and suitable group composition, avoiding too much or too little homogeneity. Furthermore, the formalising process made it possible to iden-tify vicious circles and regulatory loops in the livestock farming system operation. Farmers were then able to think about sol-utions for breaking the vicious circles and reinforcing the regulatory loops. Finally, analysis of the map structures identi-fied similarities and differences in the representations built by the two groups of farmers, which were discussed with farmers from both groups during a final workshop as a way to continue farmers’ self-reflection about redesigning their systems.
Assessment of the method’s strengths and weaknesses could be improved by more systematic analysis of the impacts of the modelling workshops on farmers’ represen-tations and redesign processes. Such analyses of the impacts of participatory projects on participants have been carried out by the ‘ComMod’ branch of participatory modelling
(Etienne 2010) and still constitute a research front (Perez et al.2010).
Finally, we advocate our method as a good ‘initial step’ to support farmers in system redesign. In fact, we assume that this step gives farmers clues about how to redesign their livestock farming systems, by fostering their strategic think-ing and maybe by initiatthink-ing new group dynamics in their area. The next steps, either facilitated by an external facili-tator, according to methods to be defined, or carried out by the farmers alone, should therefore be made easier and richer, which may be conducive to innovative livestock farming systems, well adapted to the new context of live-stock farming.
Acknowledgements The authors wish to thank all the farmers, agri-cultural advisors and representatives of the milk plant who participated in the programme. This work was funded by the SAD (Science for Action and Development) department of the French National Institute for Agri-cultural Research (INRA) and by the Education and Research Directorate (DGER) of the French Ministry of Agriculture and Fisheries.
References
Ackermann F, Eden C (2005) Using causal mapping with group support systems to elicit an understanding of failure in complex projects: some implications for organizational research. Group Decis Negot 14:355–376. doi:10.1007/s10726-005-8917-6 Antona M, D’Aquino P, Aubert S, Barreteau O, Boissau S, Bousquet F,
Daré W, Etienne M, Le Page C, Mathevet R, Trébuil G, Weber J (2005) La modélisation comme outil d’accompagnement. Nat Sci Soc 13:165–168. doi:10.1051/nss:2005023
Bawden R (2010) From transforming systems to transforming systems— and back again?, 9th European IFSA Symposium, Vienna Bernet T, Ortiz O, Estrada RD, Quiroz R, Swinton SM (2001) Tailoring
agricultural extension to different production contexts: a user-friendly farm-household model to improve decision-making for participatory research. Agric Syst 69:183–198. doi:10.1016/ S0308-521X(01)00024-5
Cabrera VE, Breuer NE, Hildebrand PE (2008) Participatory modeling in dairy farm systems: a method for building consensual environ-mental sustainability using seasonal climate forecasts. Clim Chang 89:395–409. doi:10.1007/s10584-007-9371-z
Cerf M, Mathieu A, Béguin P, Thiery O (2008) A collective analysis of co-design projects 8th European IFSA Symposium, Clermont-Ferrand Cossette P (2003) Méthode systématique d’aide à la formulation de la
vision stratégique: illustration auprès d’un propriétaire-dirigeant. Revue de l’Entrepreneuriat 2:1–18
Cossette P, Audet M (1992) Mapping of an idiosyncratic schema. J Manag Stud 29:325–347. doi:10.1111/j.1467-6486.1992.tb00668.x Dumrongrojwatthana P (2010) Interactions between cattle raising and reforestation in the highland socio-ecosystem of Nan province, Northern Thailand: a companion modelling process to improve landscape management. Doctoral thesis, Université Paris-Ouest Nanterre-La Défense, Paris
Eden C (2004) Analyzing cognitive maps to help structure issues or problems. Eur J Oper Res 159:673–686. doi:10.1016/S0377-2217 (03)00431-4
Eksvärd K (2009) Exploring new ways. Systemic research transitions for agricultural sustainability. Doctoral thesis, Department of
Rural and Urban Development, Faculty of Natural Resources and Agricultural Sciences, Uppsala
Etienne M (2010) La modélisation d’accompagnement: Une démarche participative en appui au développement durable. Editions Quae, Versailles
Fairweather JR, Hunt LM (2009) Can farmers map their farm system? Causal mapping and the sustainability of sheep/beef farms in New Zealand. Agric Hum Values 28:55–66. doi: 10.1007/s10460-009-9252-3
Goulet F, Pervanchon F, Conteau C, Cerf M (2008) Les agriculteurs innovent par eux-mêmes pour leurs systèmes de culture. In: Reau R, Doré T (eds) Systèmes de culture innovants et durables. Trans-versales, Educagri Editions, Dijon, pp 59–67
Gouttenoire L, Cournut S, Ingrand S (2010) Building causal maps of livestock farming systems using a participatory method with dairy farmers, 9th European IFSA Symposium, Vienna
Gouttenoire L, Cournut S, Ingrand S (2011) Modelling as a tool to redesign livestock farming systems: a literature review. Animal 5:1957–1971. doi:10.1017/S175173111100111X
Hill SB, MacRae RJ (1996) Conceptual frameworks for the transition from conventional to sustainable agriculture. J Sustain Agric 7:81–87. doi:10.1300/J064v07n01_07
IAASTD (2008) Agriculture at a crossroads: synthesis report of the International Assessment of Agricultural Knowledge. Science and Technology for Development, Washington DC
Jiggins J, Röling N (1997) Action research in natural resource man-agement: marginal in the first paradigm, core in the second. Etud Rech Syst Agraires Dév 30:151–167
Lamine C, Bellon S (2009) Conversion to organic farming: a multidi-mensional research object at the crossroads of agricultural and social sciences. A review. Agron Sustain Dev 29:97–112. doi:10.1051/ agro:2008007
Legay JM (1997) L’expérience et le modèle: Un discours sur la méth-ode. INRA Editions, Paris
Malézieux E, Trébuil G, Jaeger M (2001) Modélisation des agroéco-systèmes et aide à la décision. Editions Quae, Montpellier McCown RL (2002) Changing systems for supporting farmers’
deci-sions: problems, paradigms, and prospects. Agric Syst 74:179– 220. doi:S0308-521X(02)00026-4
Meynard J.M., Aggeri F., Coulon J.B., Habib R. (2006) Recherches sur la conception de systèmes agricoles innovants. Working group report, September 2006, 71 p
Newman S, Lynch T, Plummer AA (2000) Success and failure of decision support systems: learning as we go. J Animal Sci 77(E-Suppl):1–12
Perez P, Aubert S, Daré W, Ducrot R, Jones N, Queste J, Trébuil G, Van Paassen A (2010) Evaluation et suivi des effets de la dé-marche. In: Etienne M (ed) La modélisation d’accompagnement: Une démarche participative en appui au développement durable. Editions Quae, Versailles
Prell C, Hubacek K, Reed M, Quinn C, Jin N, Holden J, Burt T, Kirby M, Sendzimir J (2007) If you have a hammer every-thing looks like a nail:‘traditional’ versus participatory model building. Interdiscip Sci Rev 32:1–20. doi:10.1179/ 030801807X211720
Schnelle E (1979) The Metaplan-method: communication tools for planning and learning groups. Metaplan Series 7, Metaplan GmbH, Quickborn
Steinfeld H, Gerber P, Wassenaar T, Castel V, Rosales M, De Haan C (2006) Livestock’s long shadow: environmental issues and options. FAO, Rome
Sulpice P, Pichard G, Dufour A, Cloye J, Aimoz H (2005) Des formations innovantes basées sur l’écoute des personnes et l’échange des pratiques: propositions concrètes pour la for-mation des éleveurs en santé animale. Renc Rech Rumin 12:57–60
Vaarst M, Gratzer E, Walkenhorst M, Ivemeyer S, Brinkmann J, March S, Whistance LK, Smolders G, Stöger E, Huber J, Leeb C, Roderick S, Winckler C, Henriksen BIF, Nicholas P, Hansen B, Mejdell CM (2010) Farmer groups for animal health and welfare planning in European organic dairy herds, 9th European IFSA Symposium, Vienna
Vanloqueren G, Baret PV (2009) How agricultural research systems shape a technological regime that develops genetic engineering but locks out agroecological innovations. Res Policy 38:971–983. doi:10.1016/j.respol.2009.02.008
Vayssières J, Lecomte P, Guerrin F, Nidumolu UB (2007) Model-ling farmers’ action: decision rules capture methodology and formalisation structure: a case of biomass flow operations in dairy farms of a tropical island. Animal 1:716–733. doi:10.1017/ S1751731107696657
Vinck D (1999) Les objets intermédaires dans les réseaux de coopération scientifique. Contribution à la prise en compte des objets dans les dynamiques sociales. Rev Fr Sociol 40:385–414
Voinov A, Bousquet F (2010) Modelling with stakeholders. Environ Model Softw 25:1268–1281. doi:10.1016/j.envsoft.2010.03.007 Woodward SJR, Romera AJ, Beskow WB, Lovatt SJ (2008)
Better simulation modelling to support farming systems in-novation: review and synthesis. N Z J Agric Res 51:235– 252. doi:10.1080/00288230809510452