EUROPEAN ORGANISATION FOR NUCLEAR RESEARCH (CERN)
Phys. Lett. B 786 (2018) 59
DOI:10.1016/j.physletb.2018.09.013
CERN-EP-2018-215 2nd October 2018
Observation of H → b ¯
b decays and V H production
with the ATLAS detector
The ATLAS Collaboration
A search for the decay of the Standard Model Higgs boson into a b ¯b pair when produced in association with a W or Z boson is performed with the ATLAS detector. The data, corres-ponding to an integrated luminosity of 79.8 fb−1were collected in proton–proton collisions during Run 2 of the Large Hadron Collider at a centre-of-mass energy of 13 TeV. For a Higgs boson mass of 125 GeV, an excess of events over the expected background from other Stand-ard Model processes is found with an observed (expected) significance of 4.9 (4.3) standStand-ard deviations. A combination with the results from other searches in Run 1 and in Run 2 for the Higgs boson in the b ¯b decay mode is performed, which yields an observed (expected) significance of 5.4 (5.5) standard deviations, thus providing direct observation of the Higgs boson decay into b-quarks. The ratio of the measured event yield for a Higgs boson decaying into b ¯b to the Standard Model expectation is 1.01 ± 0.12(stat.)+0.16−0.15(syst.). Additionally, a combination of Run 2 results searching for the Higgs boson produced in association with a vector boson yields an observed (expected) significance of 5.3 (4.8) standard deviations.
© 2018 CERN for the benefit of the ATLAS Collaboration.
Reproduction of this article or parts of it is allowed as specified in the CC-BY-4.0 license.
Contents
1 Introduction 3
2 The ATLAS detector 4
3 Object and event selection 4
3.1 Object reconstruction 5
3.2 Event selection and categorisation 6
3.3 Multivariate analysis 8
3.4 Dijet-mass analysis 9
4 Data, simulated samples and multi-jet background 9
5 Systematic uncertainties 11
5.1 Experimental uncertainties 11
5.2 Simulated sample uncertainties 12
5.2.1 Background uncertainties 13
5.2.2 Signal uncertainties 15
5.3 Multi-jet background uncertainties 16
6 Statistical analysis 16 6.1 Multivariate analysis 17 6.2 Dijet-mass analysis 17 6.3 Diboson analysis 18 6.4 Combinations 19 6.4.1 Run 1 19 6.4.2 H → b ¯b 19 6.4.3 V H 19 7 Results 20
7.1 Results of the SM Higgs boson search at √
s= 13 TeV 20
7.2 Results of the dijet-mass analysis 25
7.3 Results of the diboson analysis 25
7.4 Results of combinations 26
7.4.1 Run 1 and Run 2 combination for V H, H → b ¯b 26
7.4.2 Observation of H → b ¯b decays 26
7.4.3 Observation of V H production 27
1 Introduction
The Higgs boson [1–4] was discovered in 2012 by the ATLAS and CMS Collaborations [5, 6] with a mass of approximately 125 GeV from the analysis of proton–proton (pp) collisions produced by the Large Hadron Collider (LHC) [7]. Since then, the analysis of data collected at centre-of-mass energies of 7 TeV, 8 TeV and 13 TeV in Runs 1 and 2 of the LHC has led to the observation of many of the production modes and decay channels predicted by the Standard Model (SM). The bosonic decay channels are well established and have entered an era of precision measurements [8–18]. The decay into τ-lepton pairs was first observed in the combination of the ATLAS and CMS analyses [19,20]. The main Higgs boson production modes, gluon–gluon fusion (ggF) and vector-boson fusion (VBF), were already measured following the analysis of the Run 1 data, and recently the coupling of the Higgs boson to top quarks was directly observed by the ATLAS and CMS Collaborations [21, 22] through the observation of the associated production of a Higgs boson and a top-quark pair (t ¯tH).
The dominant decay of the SM Higgs boson is into pairs of b-quarks, with an expected branching fraction of approximately 58% for a mass of mH = 125 GeV [23]. However, large backgrounds from multi-jet production make a search in the dominant gluon–gluon fusion production mode very challenging at hadron colliders. The most sensitive production modes for detecting H → b ¯b decays are the associated production of a Higgs boson and a W or Z boson [24] (V H), where the leptonic decay of the vector boson enables efficient triggering and a significant reduction of the multi-jet background. As well as probing the dominant decay of the Higgs boson, this measurement allows the overall Higgs boson decay width [25,
26] to be constrained and provides the best sensitivity to the Z H and W H production modes, which are (for instance) important elements in the interpretation of Higgs boson measurements in effective field theories [27].
Searches in this channel at the Tevatron by the CDF and D0 Collaborations showed an excess of events with a significance of 2.8 standard deviations for a Higgs boson with a mass of 125 GeV [28]. Analysing the 2015 and 2016 data and combining with the Run 1 results [29, 30], both the ATLAS and CMS Collaborations reported evidence for Higgs boson production and decay in this channel, with observed (expected) significances of 3.6 (4.0) and 3.8 (3.8) standard deviations, respectively [31,32]. Searches for H → b ¯b decays have also been conducted in the VBF [33–35] and t ¯tH [36–41] channels, and with high transverse momentum Higgs bosons [42], but with markedly lower sensitivities.
This Letter reports an update to the search for the SM Higgs boson decaying into a b ¯b pair in the V H production mode with the ATLAS detector in Run 2 of the LHC presented in Ref. [31]. This update uses 79.8 fb−1of pp collision data collected at a centre-of-mass energy of 13 TeV, to be compared with 36.1 fb−1for the previous result. In addition, an updated version of the ATLAS reconstruction code and improved object calibrations are used, the impact of the luminosity and modelling systematic uncertainties are reduced from updated measurements and estimates, and larger samples of simulated events are used to model the background processes. Events are selected in 0-, 1- and 2-lepton channels, based on the number of charged leptons, ` (electrons or muons), to explore the Z H → ννb ¯b, W H → `νb ¯b and Z H → ``b¯b signatures, respectively. The dominant background processes after the event selection are V+ jets, t¯t, single-top and diboson process. Multivariate discriminants, built from variables that describe the kinematics of the selected events, are used to maximise the sensitivity to the Higgs boson signal. Their output distributions are combined using a binned maximum-likelihood fit, referred to as the global likelihood fit, which allows the signal yield and the background normalisations to be extracted. The signal extraction method is cross-checked with the dijet-mass analysis, where the signal yield is extracted using the mass of the dijet system as the main fit observable, and validated using the diboson analysis, where the
nominal multivariate analysis is modified to extract the V Z , Z → b ¯b diboson process. The result of the multivariate analysis is then combined with that of the previously published analysis of Run 1 data [30], with other searches for b ¯b decays of the Higgs boson and with other searches in the V H production mode. The latter two combinations lead to the observation of both the b ¯b decay of the Higgs boson and V H production. An observation of the b ¯b decay of the Higgs boson by the CMS Collaboration [43] was submitted for publication at the same time as this Letter.
2 The ATLAS detector
ATLAS [44] is a general-purpose particle detector covering nearly the entire solid angle1 around the collision point. An inner tracking detector, located within a 2 T axial magnetic field generated by a thin superconducting solenoid, is used to measure the trajectories and momenta of charged particles. The inner layers consist of high-granularity silicon pixel detectors covering a pseudorapidity range |η| < 2.5, and include an innermost layer [45, 46] that was added to the detector between Run 1 and Run 2. Silicon microstrip detectors covering |η| < 2.5 are located beyond the pixel detectors. Outside the microstrip detectors and covering |η| < 2.0, there are straw-tube tracking detectors, which also provide measurements of transition radiation that are used in electron identification. A calorimeter system surrounds the inner tracking detector, covering the pseudorapidity range |η| < 4.9. Within the region |η| < 3.2, electromagnetic calorimetry is provided by barrel (|η| < 1.475) and endcap (1.375 < |η| < 3.2) high-granularity lead/liquid-argon (LAr) sampling calorimeters, with an additional thin LAr presampler covering |η| < 1.8 to correct for energy loss in material upstream of the calorimeters. Hadronic calorimetry is provided by a steel/scintillator-tile calorimeter within |η| < 1.7, and copper/LAr endcap calorimeters extend the coverage to |η| = 3.2. The solid angle coverage for |η| between 3.2 and 4.9 is completed with copper/LAr and tungsten/LAr calorimeter modules optimised for electromagnetic and hadronic measurements, respectively. The outermost part of the detector is the muon spectrometer, which measures the curved trajectories of muons in the magnetic field of three large air-core superconducting toroidal magnets. High-precision tracking is performed within the range |η| < 2.7 and there are chambers for fast triggering within the range |η| < 2.4. A two-level trigger system [47] is used to reduce the recorded data rate. The first level is a hardware implementation aiming to reduce the rate to around 100 kHz, while the software-based high-level trigger provides the remaining rate reduction to approximately 1 kHz.
3 Object and event selection
The event topologies characteristic of V H, H → b ¯b processes considered contain zero, one or two charged leptons, and two ‘b-jets’ containing particles from b-hadron decays. The object and event selections follow those of Ref. [31] to a large extent.
1ATLAS uses a right-handed coordinate system with its origin at the nominal interaction point (IP) in the centre of the detector
and the z-axis coinciding with the axis of the beam pipe. The x-axis points from the IP towards the centre of the LHC ring, and the y-axis points upward. Cylindrical coordinates (r,φ) are used in the transverse plane, φ being the azimuthal angle around the z-axis. The pseudorapidity is defined in terms of the polar angle θ as η = − ln tan(θ/2). The distance in (η,φ) coordinates, ∆R=p(∆φ)2+ (∆η)2, is also used to define cone sizes. Transverse momentum and energy are defined as p
T= p sin θ and
3.1 Object reconstruction
Tracks measured in the inner detector are used to reconstruct interaction vertices [48], of which the one with the highest sum of squared transverse momenta of associated tracks is selected as the primary vertex.
Electrons are reconstructed from topological clusters of energy deposits in the calorimeter [49] and matched to a track in the inner detector. Following Refs. [31, 50], loose electrons are required to have pT> 7 GeV and |η| < 2.47, to have small impact parameters,2to fulfil a loose track isolation requirement, and to meet a ‘LooseLH’ quality criterion computed from shower shape and track quality variables [51]. In the 1-lepton channel, tight electrons are selected using a ‘TightLH’ likelihood requirement and a stricter calorimeter-based isolation.
Muons are required to be within the acceptance of the muon spectrometer |η| < 2.7, to have pT > 7 GeV,
and to have small impact parameters. Loose muons are selected using a ‘loose’ quality criterion [52] and a loose track isolation. In the 1-lepton channel, tight muons fulfil the ‘medium’ quality criterion and a stricter track isolation.
Hadronically decaying τ-leptons [53,54] are required to have pT > 20 GeV and |η| < 2.5, to be outside
of the transition region between the barrel and end-cap electromagnetic calorimeters 1.37 < |η| < 1.52, and to meet a ‘medium’ quality criterion [54]. They are only used in the analysis to avoid τ-leptons being misidentified as jets.
Jets are reconstructed from topological clusters [55] using the anti-ktalgorithm [56] with radius parameter R = 0.4. A jet vertex tagger [57] is used to remove jets associated with vertices other than the primary one for jet pT < 60 GeV and |η| < 2.4. Jet cleaning criteria are used to identify jets arising from
non-collision backgrounds or noise in the calorimeters [58] and events containing such jets are removed. Jets are required to have pT > 20 GeV in the central region (|η| < 2.5), and pT > 30 GeV outside
(2.5 < |η| < 4.5) of the tracker acceptance. In the central region, they are tagged as containing b-hadrons using a multivariate discriminant [59] (MV2), with the selection tuned to produce an average efficiency of 70% for b-jets in simulated t ¯t events, which corresponds to light-flavour (u-, d-, s-quark and gluon) and c-jet misidentification efficiencies of 0.3% and 12.5% respectively.
Simulated jets are labelled as b-, c- or light-flavour jets according to which hadrons with pT > 5 GeV
are found within a cone of size ∆R = 0.3 around their axis. Simulated V +jets events are categorised depending on the labels of the jets that form the Higgs boson candidate: V + ll when they are both light-flavour jets, V + cl when there is one c-jet and one light-flavour jet, and V +HF (heavy flavour) in all other cases, mainly two b-jets. Owing to the large rejection of light-flavour jets achieved by the MV2 discriminant, simulated V + ll, V + cl and WW events are not subjected to the b-tagging requirement due to the resulting low number of simulated events, but instead they are weighted by the probability that their jets pass the b-tagging selection [31].
In addition to the standard jet energy scale calibration [60], b-tagged jets receive additional flavour-specific corrections to improve their energy measurement (scale and resolution): if any muons are found within ∆R= 0.4, the four-momentum of the closest muon is added to that of the jet, and a residual correction is applied to equalise the response to jets with leptonic or hadronic decays of heavy-flavour hadrons. In the 2-lepton channel, a per-event kinematic likelihood uses the full reconstruction of the event kinematics to
2Transverse and longitudinal impact parameters are defined relative to the primary vertex position, where the beam line is used
improve the estimate of the energy of the b-jets. The corrections improve the resolution of the dijet mass by up to 40% [31].
The missing transverse momentum EmissT is reconstructed as the negative vector sum of the momenta of leptons, hadronically decaying τ-leptons and jets, and of a ‘soft term’ built from additional tracks matched to the primary vertex [61]. The magnitude of EmissT is referred to as ETmiss. An overlap removal procedure is applied to avoid any double-counting between the reconstructed leptons, including the hadronically decaying τ-leptons, and jets.
3.2 Event selection and categorisation
Events are categorised into the 0-, 1- and 2-lepton channels depending on the number of selected electrons and muons, to target the Z H → vvb ¯b, W H → `νb ¯b and Z H → ``b ¯b signatures, respectively. In all channels, events are required to have exactly two b-tagged jets, which form the Higgs boson candidate. At least one b-tagged jet is required to have pTgreater than 45 GeV. Events are further split into 2-jet or 3-jet
categories depending on whether additional, untagged jets are present. In the 0- and 1-lepton channels, only one such jet is allowed, as the t ¯t background is much larger in events with four jets or more. In the 2-lepton channel any number of jets is accepted in the 3-jet category.
The reconstructed transverse momentum pVT of the vector boson corresponds to ETmiss in the 0-lepton channel, to the vectorial sum of EmissT and the charged-lepton transverse momentum in the 1-lepton channel, and to the transverse momentum of the 2-lepton system in the 2-lepton channel. As the signal-to-background ratio increases for large Higgs boson transverse momenta [62,63], the analysis focuses on a high-pVT region defined as pVT > 150 GeV. In the 2-lepton channel, the sensitivity is increased by the addition of a medium-pVT region with 75 GeV < pVT < 150 GeV.
Two versions of the analysis are carried out, one using a multivariate approach and the other using the dijet mass as the final discriminant. The event selection shown in Table1is applied to both versions, with further selections applied for the dijet-mass analysis. The two versions of the analysis also have different event categorisations, with further details outlined below.
0-lepton channel The online selection uses Emiss
T triggers with thresholds that varied from 70 GeV to
110 GeV between the 2015 and 2017 data-taking periods. Their efficiency was measured in W +jets, Z +jets and t ¯t events in data using single-muon triggers, resulting in correction factors that are applied to the simulated events, ranging from 1.05 at the offline ETmiss threshold of 150 GeV to a negligible deviation from unity at an ETmissabove 200 GeV. A requirement on the scalar sum of the transverse momenta HTof
the jets removes a small part of the phase space where the trigger efficiency depends mildly on the number of jets in the event. Events with any loose lepton are rejected. High ETmiss in multi-jet events typically arises from mismeasured jets in the calorimeters. Such events are efficiently removed by requirements on the angular separation of the EmissT , jets, and pmissT (the missing transverse momentum calculated using only tracks reconstructed in the inner tracking detector and matched to the primary vertex).
1-lepton channel In the electron sub-channel, events are required to satisfy a logical OR of
single-electron triggers with identification and isolation criteria looser than those used in the offline analysis, and pT thresholds that started at 24 GeV in 2015 and increased to 26 GeV in 2016 and 2017. The muon
T able 1 : Summar y of the e v ent selection and categor isation in the 0-, 1-and 2-lepton c hannels. Selection 0-lepton 1-lepton 2-lepton e sub-c hannel µ sub-c hannel T rigg er E miss T Single lepton E miss T Single lepton Leptons 0 loose leptons 1 tight electron 1 tight muon 2 loose leptons with pT > 7 Ge V with pT > 7 Ge V pT > 27 Ge V pT > 25 Ge V ≥ 1 lepton with pT > 27 Ge V E miss T > 150 Ge V > 30 Ge V – – m`` – – 81 Ge V < m`` < 101 Ge V Jets Ex actl y 2 / Ex actl y 3 jets Ex actl y 2 / ≥ 3 jets Jet pT > 20 Ge V for |η | < 2.5 > 30 Ge V for 2.5 < |η | < 4.5 b-jets Ex actl y 2 b-tagg ed jets Leading b-tagg ed jet pT > 45 Ge V HT > 120 Ge V (2 jets), >150 Ge V (3 jets) – – min [∆ φ (E miss T ,je ts )] > 20 ◦ (2 jets), > 30 ◦ (3 jets) – – ∆ φ (E miss T ,b b ) > 120 ◦ – – ∆ φ (b 1 ,b2 ) < 140 ◦ – – ∆ φ (E miss T ,p miss T ) < 90 ◦ – – p V T regions > 150 Ge V 75 Ge V < p V T < 150 Ge V, > 150 Ge V Signal regions – mb b ≥ 75 Ge V or mtop ≤ 225 Ge V Same-fla v our leptons Opposite-sign c har g es ( µ µ sub-c hannel) Control regions – mb b < 75 Ge V and mtop > 225 Ge V Different-fla v our leptons Opposite-sign c har g es
Table 2: The cross-section (σ) times branching fraction (B) and acceptance for the three channels at √
s= 13 TeV. The qq- and gg-initiated Z H processes are shown separately. The branching fractions are calculated considering only decays into muons and electrons for Z → ``, decays into all three lepton flavours for W → `ν and decays into all neutrino flavours for Z → νν. The acceptance is calculated as the fraction of events remaining in the combined signal and control regions after the full event selection.
Process σ × B [fb] Acceptance [%]
0-lepton 1-lepton 2-lepton
qq → Z H →``b¯b 29.9 <0.1 0.1 6.0
gg → Z H →``b¯b 4.8 <0.1 0.2 13.5
qq → W H →`νb¯b 269.0 0.2 1.0 –
qq → Z H →ννb¯b 89.1 1.9 – –
gg → Z H →ννb¯b 14.3 3.5 – –
effectively select on pVT given that muons are not included in the online ETmisscalculation and they perform more efficiently than the single-muon triggers in the analysis phase space. Events are required to have exactly one high-pTtight electron or muon, and no additional loose leptons. In the electron sub-channel
an additional selection of ETmiss> 30 GeV is applied to reduce the background from multi-jet production. Events are categorised into the signal region (SR) or into a control region enriched in W +HF events (W +HF CR) using selections on the invariant mass of the two b-tagged jets (mbb), and on the reconstructed mass of a semi-leptonically decaying top-quark candidate (mtop). The latter is calculated as the invariant mass
of the lepton, the reconstructed neutrino3 and the b-tagged jet that yields the lowest mass value. The resulting purity of the W +HF control region is around 75%.
2-lepton channel The online selection in the electron sub-channel is the same as in the 1-lepton channel.
In the muon sub-channel, a similar OR of single-muon triggers is used, with lowest pTthresholds increasing
with luminosity and ranging from 20 GeV to 26 GeV. Events must have exactly two loose leptons, one of which must have pT > 27 GeV, and the invariant mass of the lepton pair must be compatible with that of
the Z boson. Events with same-flavour leptons enter the signal region, while events with one muon and one electron define an e µ control region which is over 99% pure in t ¯t and single-top-quark events. The acceptances in the three channels after the event selection, as well as the predicted cross-sections times branching fractions for (W /Z )H with W → `ν, Z → ``, Z → νν, and H → b ¯b are given in Table2. The non-negligible acceptance for the qq → W H process in the 0-lepton channel is mostly due to events with an unidentified hadronically decaying τ-lepton produced in the W decay, while the larger acceptance for the gg → Z H process compared with qq → Z H is due to the harder pVT spectrum of the gluon-induced process.
3.3 Multivariate analysis
Boosted decision trees (BDT) are trained in eight signal regions, corresponding to two jet categories for the three lepton channels in the high-pVT region, in addition to the two jet categories for the 2-lepton
3The transverse component of the neutrino momentum is identified with Emiss
T , and the longitudinal component is obtained by
medium-pVT region. The BDT outputs are used as the final discriminating variables in the analysis. Two sets of BDTs are constructed with the same input variables and parameters. The nominal one (BDTV H) is designed to separate Higgs boson events from the sum of expected backgrounds, while the second one (BDTV Z) is used to validate the analysis by the extraction of the diboson V Z , Z → b ¯b process from the sum of all other SM processes.
The same input variables, BDT settings and BDT output binning transformation as those detailed in Ref. [31] are used, with one exception in the 2-lepton channel where the ETmissis replaced with ETmiss/
√ ST (where ST is the scalar sum of transverse momenta of the charged leptons and jets in the event). Eight
to thirteen input variables describing the kinematics of the events are used depending on the channels, of which mbb, pVT and ∆R(b1, b2) (where b1and b2refer to the two b-tagged jets) are the most
discriminat-ing.
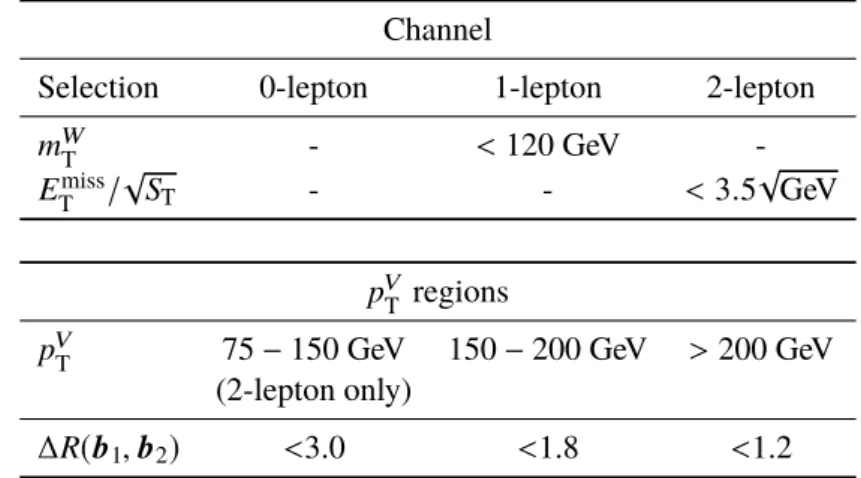
3.4 Dijet-mass analysis
A cross-check of the main multivariate analysis is performed by using the invariant mass of the two b-tagged jets as the discriminating variable. Additional selections displayed in Table3increase the purity of the signal regions and are necessary to improve the sensitivity of this method.
The high-pVT region is split into two regions 150 GeV < pVT < 200 GeV and pVT > 200 GeV, with further requirements placed upon ∆R(b1, b2). Selections on the transverse mass of the W boson (mW
T ) and on
Emiss
T /
√
STreduce the t ¯t background in the 1- and 2-lepton channels, respectively.
In the 1-lepton channel the mbb distribution is able to sufficiently constrain the W +HF background, thus it is not necessary to separate events into a dedicated W +HF CR.
Table 3: Summary of the event selection criteria in the 0-, 1- and 2-lepton channels for the dijet-mass analysis, applied in addition to those described in Table1for the multivariate analysis.
Channel
Selection 0-lepton 1-lepton 2-lepton
mW T - < 120 GeV -Emiss T / √ ST - - < 3.5√GeV pV T regions pV
T 75 − 150 GeV 150 − 200 GeV > 200 GeV
(2-lepton only)
∆R(b1, b2) <3.0 <1.8 <1.2
4 Data, simulated samples and multi-jet background
The data used in this analysis were collected at a centre-of-mass energy of 13 TeV during the 2015–2017 running periods. Events are selected for analysis only if they are of good quality and if all the relevant
Table 4: The generators used for the simulation of the signal and background processes. If not specified, the order of the cross-section calculation refers to the expansion in the strong coupling constant (αS). The acronyms ME, PS
and UE stand for matrix element, parton shower and underlying event, respectively. (?) The events were generated using the first PDF in the NNPDF3.0NLO set and subsequently reweighted to the PDF4LHC15NLO set [73] using the internal algorithm in Powheg-Box v2. (†) The NNLO(QCD)+NLO(EW) cross-section calculation for the pp → Z H process already includes the gg → Z H contribution. The qq → Z H process is normalised using the cross-section for the pp → Z H process, after subtracting the gg → Z H contribution. An additional scale factor is applied to the qq → V H processes as a function of the transverse momentum of the vector boson, to account for electroweak (EW) corrections at NLO. This makes use of the V H differential cross-section computed with Hawk [74,75].
Process ME generator ME PDF PS and UE model Cross-section
Hadronisation tune order
Signal, mass set to 125 GeV and b ¯b branching fraction to 58%
qq → W H Powheg-Box v2 [76] + NNPDF3.0NLO(?)[77] Pythia 8.212 [68] AZNLO [78] NNLO(QCD)+
→`νb ¯b GoSam [79] + MiNLO [80,81] NLO(EW) [82–88]
qq → Z H Powheg-Box v2 + NNPDF3.0NLO(?) Pythia 8.212 AZNLO NNLO(QCD)(†)+
→ννb ¯b/``b ¯b GoSam + MiNLO NLO(EW)
gg → Z H Powheg-Box v2 NNPDF3.0NLO(?) Pythia 8.212 AZNLO NLO+
→ννb ¯b/``b ¯b NLL [89–93]
Top quark, mass set to 172.5 GeV
t ¯t Powheg-Box v2 [94] NNPDF3.0NLO Pythia 8.230 A14 [95] NNLO+NNLL [96]
s-channel Powheg-Box v2 [97] NNPDF3.0NLO Pythia 8.230 A14 NLO [98]
t-channel Powheg-Box v2 [97] NNPDF3.0NLO Pythia 8.230 A14 NLO [99]
W t Powheg-Box v2 [100] NNPDF3.0NLO Pythia 8.230 A14 Approximate NNLO [101]
Vector boson + jets
W → `ν Sherpa 2.2.1 [71,102,103] NNPDF3.0NNLO Sherpa 2.2.1 [104,105] Default NNLO [106]
Z/γ∗→``
Sherpa 2.2.1 NNPDF3.0NNLO Sherpa 2.2.1 Default NNLO
Z → νν Sherpa 2.2.1 NNPDF3.0NNLO Sherpa 2.2.1 Default NNLO
Diboson
qq → W W Sherpa 2.2.1 NNPDF3.0NNLO Sherpa 2.2.1 Default NLO
qq → W Z Sherpa 2.2.1 NNPDF3.0NNLO Sherpa 2.2.1 Default NLO
qq → Z Z Sherpa 2.2.1 NNPDF3.0NNLO Sherpa 2.2.1 Default NLO
gg → VV Sherpa 2.2.2 NNPDF3.0NNLO Sherpa 2.2.2 Default NLO
detector components are known to have been in good operating condition, which corresponds to a total integrated luminosity of 79.8 ± 1.6 fb−1[64,65]. The recorded events contain an average of 32 inelastic pp collisions.
Monte Carlo (MC) simulated events are used to model the backgrounds from SM processes and V H, H → b ¯b signal processes. All simulated processes are normalised using the most accurate theoretical cross-section predictions currently available and were generated at least to next-to-leading-order (NLO) accuracy. All samples of simulated events were passed through the ATLAS detector simulation [66] based on GEANT 4 [67] and were reconstructed with the standard ATLAS reconstruction software. The effects of multiple interactions in the same and nearby bunch crossings (pile-up) were modelled by overlaying minimum-bias events, simulated using the soft QCD processes of Pythia 8.186 [68] with the A2 [69] set of tuned parameters (tune) and MSTW2008LO [70] parton distribution functions (PDF). For all samples of simulated events, except for those generated using Sherpa [71], the EvtGen v1.2.0 program [72] was used to describe the decays of bottom and charm hadrons. A summary of all the generators used for the simulation of the signal and background processes is shown in Table4. Samples produced with alternative generators are used to estimate systematic uncertainties in the event modelling, as described in Section5.
The background processes involving W or Z boson decays into leptons (including those in which the W boson arises from a top-quark decay) are collectively referred to in the following as electroweak (EW) backgrounds and were simulated as described above. In contrast, the multi-jet background is estimated in all three channels using data-driven methods. In both the 0- and 2-lepton channels, the multi-jet contribution is estimated from template fits to data, using the simulated samples to model the EW backgrounds and a functional form to model the multi-jet background. The template fit is performed using a variable that provides significant discrimination between the multi-jet and EW processes, with any selection on that variable removed. In the 0-lepton channel, min[∆φ(EmissT , jets)] is used, and in the 2-lepton channel, the dilepton mass distribution is used for the case where the charges of the lepton candidates have the same sign, assuming the multi-jet contribution is symmetric for opposite- and same-sign lepton charges. In both cases, it is found that the multi-jet contribution is sufficiently small that it can be neglected in the global likelihood fit without having any impact on the extracted signal.
The multi-jet background is found to be non-negligible in the 1-lepton channel and is estimated separately in the electron and muon sub-channels, and in the 2- and 3-jet categories. In each category, a template fit to the transverse mass distribution of the W boson candidate is performed, which offers the clearest discrimination between the multi-jet and EW processes, to extract the multi-jet yield. The template used for the multi-jet contribution is obtained from data in a control region after subtraction of the residual EW contribution, based on MC predictions, while the template for the EW contribution in the signal region is obtained directly from MC predictions. The control region is enriched in multi-jet events that are kinematically close to the corresponding signal region but not overlapping with it, and is defined by applying the nominal selection but inverting the stricter lepton isolation requirements. To increase the statistical precision of the data-driven estimate, the number of required b-tagged jets is reduced from two to one in the multi-jet enriched control region. The template fit applied in the signal region determines the normalisation of the multi-jet contribution, while the shape of the BDT discriminant (or of other relevant observables) is obtained using a control region analogously to the mWT template. Both the normalisation and shape derived for the BDT discriminant are then used in the global likelihood fit. The multi-jet contribution in the 2-jet category is found to be 1.9% (2.8%) of the total background contribution in the electron (muon) sub-channel, while in the 3-jet category it is found to be 0.2% (0.4%). These estimates are subject to sizeable systematic uncertainties, which are described in Section5.
5 Systematic uncertainties
The sources of systematic uncertainty can be broadly divided into four groups: those of experimental nature, those related to the modelling of the simulated backgrounds, those related to the multi-jet back-ground estimation, and those associated with the Higgs boson signal simulation. The estimation of the uncertainties closely follows the methodology outlined in Ref. [31] and is briefly summarised below.
5.1 Experimental uncertainties
The dominant experimental uncertainties originate from the b-tagging correction factors, determined from the difference between the efficiency measured in data and simulation, from the jet energy scale corrections and from the modelling of the jet energy resolution. The b-tagging correction factors are derived separately for b-jets, c-jets and light-flavour jets [107–109]. All three correction factors have uncertainties estimated from multiple measurements, which are decomposed into uncorrelated components that are then treated
independently, resulting in three uncertainties for b-jets and c-jets, and five for light-flavour jets. The approximate size of the uncertainty in the tagging efficiency is 2% for b-jets, 10% for c-jets and 40% for light-flavour jets. Additional uncertainties are considered in the extrapolation of the b-jet efficiency calibration to jets with pT > 300 GeV and in the misidentification of hadronically decaying τ-leptons as
b-jets. The uncertainties in the jet energy scale and resolution are based on their respective measurements [60,
110]. The many sources of uncertainty in the correction of the jet energy scale are decomposed into 23 uncorrelated components that are treated as independent. An additional specific uncertainty in the energy calibration of b- and c-jets is considered.
Uncertainties in the reconstruction, identification, isolation and trigger efficiencies of muons [52] and electrons [50], along with the uncertainty in their energy scale and resolution, are estimated using 13 TeV data. These are found to have only a small impact on the result. The uncertainties in the energy scale and resolution of the jets and leptons are propagated to the calculation of ETmiss, which also has additional uncertainties from the scale, resolution and reconstruction efficiency of the tracks used to compute the soft term [61], along with the modelling of the underlying event. An uncertainty is assigned to the ETmisstrigger correction factors, determined from the difference between the trigger efficiency in data and simulation, to account for the statistical uncertainty in the measured correction factors and for differences between the correction factors determined from W + jets, Z + jets and t ¯t events. The uncertainty in the combined 2015–2017 integrated luminosity is 2.0%. It is derived, following a methodology similar to that detailed in Ref. [64], and using the LUCID-2 detector for the baseline luminosity measurements [65]. The average number of interactions per bunch crossing is rescaled by 1.03 to improve agreement between simulation and data, based on the measurement of the visible cross-section in minimum-bias events [111], and an uncertainty, as large as the correction, is included.
5.2 Simulated sample uncertainties
Modelling uncertainties are derived for the simulated samples and broadly cover three areas: normal-isations, acceptance differences that affect the relative normalisations between analysis regions with a common normalisation, and the shapes of the differential distributions of the most important kinematic variables. The overall normalisations and associated uncertainties for the background processes are taken from the currently most accurate calculations as detailed in Table4, apart from the main backgrounds whose normalisations are left unconstrained (floated) in the global likelihood fit. The additional system-atic uncertainties in the acceptance differences and in the shapes are derived either from particle-level comparisons between nominal and alternative simulated samples, or from comparisons with data in con-trol regions. The particle-level comparisons are cross-checked with detector-level simulations whenever these are available, and good agreement is found. The alternative samples were either produced by other generators or by altering the nominal values of generator parameters. When acceptance uncertainties are estimated, the nominal and alternative samples are normalised using the same production cross-section. Shape uncertainties are considered in each of the analysis regions separately, with the samples scaled to have the same normalisation in each region. In this case, the uncertainty is taken from the alternative sample that differs most in shape from the nominal sample. Shape uncertainties are only derived for the mbband pVT variables, as it was found sufficient to only consider the changes induced in these variables to cover the overall shape variation of the BDTV H discriminant. Full details are provided in Ref. [31].
5.2.1 Background uncertainties
The systematic uncertainties affecting the modelling of the background samples are summarised in Tables5
and6and key details of the treatment of the backgrounds are reported below.
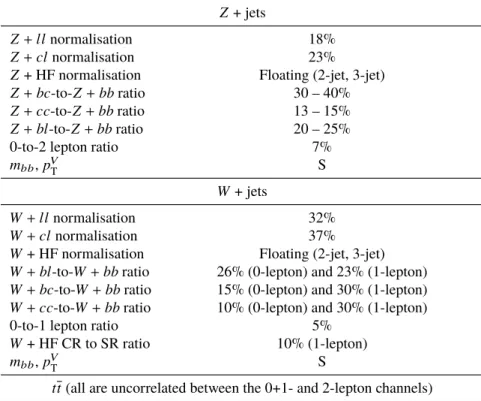
V + jets production The V + jets backgrounds are subdivided into three different components based upon the jet flavour labels of the two b-tagged jets in the event. The main background contributions (V + bb, V + bc, V + bl and V + cc) are jointly considered as the V + HF background. Their overall normalisation, separately in the 2- and 3-jet categories, is free to float in the global likelihood fit. The remaining flavour components, V + cl and V + ll, constitute less than ∼ 1% of the background in each analysis region, so only uncertainties in the normalisation of these backgrounds are included. Acceptance uncertainties are estimated for the relative normalisations of the different regions that share a common floating normalisation parameter. In the case of the W + HF background, this includes the uncertainties in the ratio of the event yield in the 0-lepton channel to that in the 1-lepton channel and, in the 1-lepton channel, in the ratio of the event yield in the W + HF control region to that in the signal region. For the Z + HF background, there is an uncertainty in the ratio of the event yield in the 0-lepton channel to that in the 2-lepton channel. Uncertainties are also estimated in the relative normalisation of the four heavy-flavour components that constitute the V + HF background. These are taken as uncertainties in the bc, cc and bl yields compared with the dominant bb yield and are estimated separately in each channel in a manner similar to the acceptance systematic uncertainties. Uncertainties are also derived for the shapes of the mbb and pVT distributions, which are evaluated for W + HF from comparisons with alternative samples and for Z + HF from comparisons with data in mbb sidebands.
t t production Due to the significantly different regions of phase space probed, the tt background in the 0- and 1-lepton channels (jointly referred to as 0+1-lepton channel in the following) is considered independently from the tt background in the 2-lepton channel; different overall floating normalisation factors are considered, and acceptance uncertainties are derived separately and taken as uncorrelated between the 0+1- and 2-lepton channels. For the 0+1- lepton channels, uncertainties are considered in the normalisation ratios of the 2-jet and 3-jet categories, of the W + HF control and signal regions, and of the 1-lepton and 0-lepton channels. For the 2-lepton channel, the normalisations in the 2- and 3-jet categories are both left floating, and are effectively determined in their respective e µ control regions. Uncertainties in the shapes of the pVT and mbb distributions are estimated in the 0+1- and 2-lepton channels separately from comparisons with alternative samples. In addition, the modelling of the tt background is validated in the 2-lepton channel by using the data events from the e µ control region to model this background in the signal region, with good agreement found.
Single top-quark production In the Wt- and t-channels, uncertainties are derived for the normalisation,
acceptance and shapes of the mbb and pVT distributions. For the W t-channel, the estimated modelling uncertainties are based on the flavour of the two b-tagged jets, due to the different regions of phase space being probed when there are two b-jets (bb) present compared with events where there are fewer b-jets present (other). Only a normalisation uncertainty is derived for the s-channel, since its contribution is negligible overall.
Diboson production The diboson backgrounds are composed of three distinct processes: W Z, WW and
Z Z production. Given the small contribution from WW production (< 0.1% of the total background) only a normalisation uncertainty is assigned. The more important contributions from the W Z and Z Z backgrounds have uncertainties derived for the overall normalisation, the relative acceptance between
Table 5: Summary of the systematic uncertainties in the background modelling for Z + jets, W + jets, tt, single top-quark and multi-jet production. An ‘S’ symbol is used when only a shape uncertainty is assessed. The regions for which the normalisations float independently are listed in brackets. Where the size of an acceptance systematic uncertainty varies between regions, a range is displayed.
Z + jets
Z+ ll normalisation 18%
Z+ cl normalisation 23%
Z + HF normalisation Floating (2-jet, 3-jet)
Z+ bc-to-Z + bb ratio 30 – 40%
Z+ cc-to-Z + bb ratio 13 – 15%
Z+ bl-to-Z + bb ratio 20 – 25%
0-to-2 lepton ratio 7%
mbb, pVT S
W + jets
W+ ll normalisation 32%
W+ cl normalisation 37%
W + HF normalisation Floating (2-jet, 3-jet)
W+ bl-to-W + bb ratio 26% (0-lepton) and 23% (1-lepton) W+ bc-to-W + bb ratio 15% (0-lepton) and 30% (1-lepton) W+ cc-to-W + bb ratio 10% (0-lepton) and 30% (1-lepton)
0-to-1 lepton ratio 5%
W + HF CR to SR ratio 10% (1-lepton)
mbb, pVT S
tt (all are uncorrelated between the 0+1- and 2-lepton channels) tt normalisation Floating (0+1-lepton, 2-lepton 2-jet, 2-lepton 3-jet)
0-to-1 lepton ratio 8%
2-to-3-jet ratio 9% (0+1-lepton only)
W + HF CR to SR ratio 25%
mbb, pVT S
Single top-quark
Cross-section 4.6% (s-channel), 4.4% (t-channel), 6.2% (W t) Acceptance 2-jet 17% (t-channel), 55% (W t(bb)), 24% (W t(other)) Acceptance 3-jet 20% (t-channel), 51% (W t(bb)), 21% (W t(other))
mbb, pVT S (t-channel, W t(bb), W t(other))
Multi-jet (1-lepton)
Normalisation 60 – 100% (2-jet), 90 – 140% (3-jet)
Table 6: Summary of the systematic uncertainties in the background modelling for diboson production. An ‘S’ symbol is used when only a shape uncertainty is assessed and ‘PS/UE’ indicates parton shower/underlying event. When extracting the (W /Z )Z diboson production signal yield, as the normalisations are unconstrained, the normalisation uncertainties are removed. Where the size of an acceptance systematic uncertainty varies between regions, a range is displayed.
Z Z
Normalisation 20%
0-to-2 lepton ratio 6%
Acceptance from scale variations 10 – 18%
Acceptance from PS/UE variations for 2 or more jets 6%
Acceptance from PS/UE variations for 3 jets 7% (0-lepton), 3% (2-lepton) mbb, pVT, from scale variations S (correlated with W Z uncertainties) mbb, pVT, from PS/UE variations S (correlated with W Z uncertainties) mbb, from matrix-element variations S (correlated with W Z uncertainties)
W Z
Normalisation 26%
0-to-1 lepton ratio 11%
Acceptance from scale variations 13 – 21%
Acceptance from PS/UE variations for 2 or more jets 4%
Acceptance from PS/UE variations for 3 jets 11%
mbb, pVT, from scale variations S (correlated with Z Z uncertainties) mbb, pVT, from PS/UE variations S (correlated with Z Z uncertainties) mbb, from matrix-element variations S (correlated with Z Z uncertainties)
WW
Normalisation 25%
regions and for the mbb and pVT shapes. These are derived following the procedure described in Ref. [31] and are outlined in Table6.
5.2.2 Signal uncertainties
The systematic uncertainties that affect the modelling of the signal are summarised in Table7. They are derived following the procedure outlined in Ref. [31], but with updated alternative samples generated with a larger number of events, and using a parameter tune optimized more recently for the evaluation of the parton shower uncertainty. This substantially reduces the parton shower and underlying event (PS/UE) uncertainties. The systematic uncertainties in the calculations of the V H production cross-sections and the H → b ¯b branching fraction4are assigned following the recommendations of the LHC Higgs Cross Section Working Group [26,92,93,112,113].
4Such systematic uncertainties fully degenerate with the signal yield do not affect the calculation of the significance relative to
Table 7: Summary of the systematic uncertainties in the signal modelling. An ‘S’ symbol is used when only a shape uncertainty is assessed and ‘PS/UE’ indicates parton shower / underlying event. Where the size of an acceptance systematic uncertainty varies between regions, a range is displayed.
Signal
Cross-section (scale) 0.7% (qq), 27% (gg)
Cross-section (PDF) 1.9% (qq → W H), 1.6% (qq → Z H), 5% (gg)
H → b ¯b branching fraction 1.7%
Acceptance from scale variations 2.5 – 8.8%
Acceptance from PS/UE variations for 2 or more jets 2.9 – 6.2% (depending on lepton channel)
Acceptance from PS/UE variations for 3 jets 1.8 – 11%
Acceptance from PDF+αSvariations 0.5 – 1.3%
mbb, pVT, from scale variations S
mbb, pVT, from PS/UE variations S
mbb, pVT, from PDF+αSvariations S
pV
T from NLO EW correction S
5.3 Multi-jet background uncertainties
Systematic uncertainties can have an impact on the data-driven multi-jet estimate used in the 1-lepton channel in two ways: either changing the mWT distributions used in the multi-jet template fits, thus impacting the extracted multi-jet normalisations, or directly changing the multi-jet BDT distributions used in the global likelihood fit. Several uncertainties are considered, uncorrelated between the electron and muon sub-channels. The respective variations are added in quadrature for the normalisations, or considered as separate shape uncertainties. Variations are obtained by changing the definition of the multi-jet control region (more stringent isolation requirements, a different single-electron trigger to probe a potential trigger bias in the isolation requirements), and varying the normalisation of the contamination from the top (t ¯t and W t) and V + jets processes in the multi-jet control region. In addition, the following systematic uncertainties have an impact only on the multi-jet normalisation: use of another discriminant variable instead of mWT for the template fit (the azimuthal separation between the directions of the lepton transverse momentum and the vectorial sum of the momenta of the two or three jets) and, for the electron sub-channel only, the inclusion of the ETmiss < 30 GeV region, which significantly enhances the multi-jet contribution in the template fit.
6 Statistical analysis
The statistical procedure is based on a likelihood function L(µ, θ), constructed as the product of Poisson probability terms over the bins of the input distributions. The parameter of interest, µ, is the signal strength that multiplies the SM Higgs boson production cross-section times the branching fraction into b ¯b and is extracted by maximising the likelihood. Systematic uncertainties enter the likelihood as nuisance parameters (NP), θ. Most of the uncertainties discussed in Section 5 are constrained with Gaussian or log-normal probability density functions. The normalisations of the largest backgrounds, t ¯t, W +HF and Z +HF, can be reliably determined by the fit, so they are left unconstrained in the likelihood. The uncertainties due to the limited number of events in the simulated samples used for the background predictions are included using the Beeston–Barlow technique [114]. As detailed in Ref. [30], systematic
Table 8: Factors applied to the nominal normalisations of the tt, W + HF and Z + HF backgrounds, as obtained from the global likelihood fit to the 13 TeV data for the nominal multivariate analysis, used to extract the Higgs boson signal. The errors represent the combined statistical and systematic uncertainties.
Process Normalisation factor
tt 0- and 1-lepton 0.98 ± 0.08 tt 2-lepton 2-jet 1.06 ± 0.09 tt 2-lepton 3-jet 0.95 ± 0.06 W+ HF 2-jet 1.19 ± 0.12 W+ HF 3-jet 1.05 ± 0.12 Z+ HF 2-jet 1.37 ± 0.11 Z+ HF 3-jet 1.09 ± 0.09
variations that are subject to large statistical fluctuations are smoothed, and systematic uncertainties that have a negligible impact on the final results are pruned away region-by-region.
The probability that the background-only hypothesis is compatible with the observed data is determined using the q0 test statistic constructed from the profile-likelihood ratio with the asymptotic
approxima-tion [115].
6.1 Multivariate analysis
As discussed in Section3.3, the global likelihood fit comprises eight signal regions, defined as the 2- and 3-jet categories in the high-pVT region for the three channels, and in the medium-pVT region for the 2-lepton channel. The BDTV H multivariate discriminant output distributions in these regions are input to the fit. The event yields are used in the two W +HF control regions of the 1-lepton channel. In the four e µ control regions of the 2-lepton channel, the mbb distributions are input to the fit, except for the 2-jet category of the high-pVT region, where the event yield is used. The post-fit normalisation factors of the unconstrained backgrounds in the global likelihood fit to the 13 TeV data are shown in Table8.
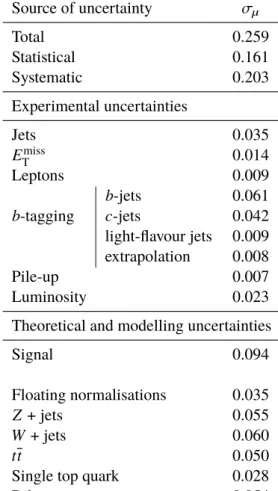
The effects of systematic uncertainties on the measurement of the signal strength are displayed in Table9. The impact of a category of systematic uncertainties is defined as the difference in quadrature between the uncertainty in µ computed when all NPs are fitted and that when the NPs in the category are fixed to their best-fit values. The total statistical uncertainty is defined as the uncertainty in µ when all the NPs are fixed to their best-fit values. The total systematic uncertainty is then defined as the difference in quadrature between the total uncertainty in µ and the total statistical uncertainty. As shown in the table, the systematic uncertainties due to the modelling of the signal play a dominant role, followed by the uncertainty due to the limited size of the simulated samples, the modelling of the backgrounds and the b-tagging uncertainty.
6.2 Dijet-mass analysis
In the dijet-mass analysis, the number of signal regions is increased to fourteen as a consequence of splitting the event regions with pVT> 150 GeV in two, while the W+HF CRs are merged into the corresponding SR,
Table 9: Breakdown of the contributions to the uncertainty in µ. The sum in quadrature of the systematic uncertainties attached to the categories differs from the total systematic uncertainty due to correlations.
Source of uncertainty σµ Total 0.259 Statistical 0.161 Systematic 0.203 Experimental uncertainties Jets 0.035 Emiss T 0.014 Leptons 0.009 b-tagging b-jets 0.061 c-jets 0.042 light-flavour jets 0.009 extrapolation 0.008 Pile-up 0.007 Luminosity 0.023
Theoretical and modelling uncertainties
Signal 0.094
Floating normalisations 0.035
Z + jets 0.055
W + jets 0.060
tt 0.050
Single top quark 0.028
Diboson 0.054
Multi-jet 0.005
MC statistical 0.070
as outlined in Section3.4. The mbb distributions are input to the fit in all categories, except for the 2-jet medium- and high-pVT categories of the 2-lepton e µ control region, where the event yield is used.
6.3 Diboson analysis
In the diboson analysis, a measurement of the signal strength of the Z Z and W Z processes is conducted to validate the main multivariate analysis. The method differs from the global likelihood fit only by the use of the BDTV Z output distributions as inputs, instead of BDTV H. The parameter of interest, µV Z, is the signal strength of the combined W Z and Z Z diboson processes, and the SM Higgs boson is included as a background process normalised to the predicted SM cross-section with an uncertainty of 50%, which conservatively encompasses the previous measurement and uncertainty [31].
6.4 Combinations
6.4.1 Run 1
The results of the statistical analysis of the 13 TeV data are combined with those from the data recorded at 7 TeV and 8 TeV [30] to improve the precision of the measurement. Detailed studies of the impact of the correlation of systematic uncertainties between the two analyses are reported in Ref. [31]. In most cases, the impact of correlations was found to be negligible. Only a b-jet-specific jet energy scale, and theory uncertainties in the Higgs boson signal (overall cross-section, branching fraction and pVT-dependent NLO EW corrections) are correlated across the different centre-of-mass energies.
6.4.2 H → b ¯b
A second combination is performed with the results of the searches for the H → b ¯b decay in the t ¯tH [36,
38] and VBF [33, 35] production modes carried out with the Run 1 and Run 2 data. As the analysis targeting the VBF production mode has a sizeable contribution from gluon–gluon fusion events, it is referred to as the VBF+ggF analysis in the following. Constraining the cross-sections of the production modes to be as predicted by the SM, the combination measures the ratio of the branching fraction of the Higgs boson into b-quarks to the SM prediction. The only NP correlated across the six analyses is the H → b ¯b branching fraction that affects the SM prediction. A few other NPs are correlated across some of the analyses, following the studies conducted for the combinations of Run 1 results [19], of analyses of the t ¯tH production mode [21], and of Run 2 results.
6.4.3 V H
A third combination is also performed combining the Run 2 V H, H → b ¯b result with other results in the V H production mode, but for the case of the Higgs boson decaying into two photons or via Z Z∗into four leptons.
The measurement of V H production in the H→γγ channel, which uses five reconstruction-level categor-ies to target leptonic decays of the vector boson, and two categorcategor-ies targeting hadronic decays of the vector boson, as described in Ref. [9], is updated using 79.8 fb−1 of data. Photons are reconstructed from calorimeter energy clusters formed using an enhanced dynamical, topological cell-clustering-based algorithm [49]. The signal yield is extracted in each category using a fit to the diphoton invariant mass distribution in the range 105–160 GeV. Contamination in these categories from non-V H Higgs boson production is constrained using separate categories designed to measure the t ¯tH [21], VBF, and ggF production modes.
The measurement of V H production in the four-lepton final state, H → Z Z∗ → 4`, where ` = e or µ, was performed with 36.1 fb−1[10] and has now been extended to 79.8 fb−1. The main enhancements are: improved electron reconstruction [49] and an additional event category targeting vector-boson decays that include missing transverse momentum due to the presence of one or two neutrinos in the final state. This results in three V H categories, targeting the hadronic decays of the vector boson, charged leptonic decays of the vector boson and decays of the vector boson containing one or more neutrinos.
The combination is undertaken as outlined in Ref. [116]. Constraining the branching fractions for the Z Z∗, diphoton and b ¯b decays to be as predicted by the SM, this combination measures the signal strength of the V H production mode.
7 Results
7.1 Results of the SM Higgs boson search at√s = 13 TeV
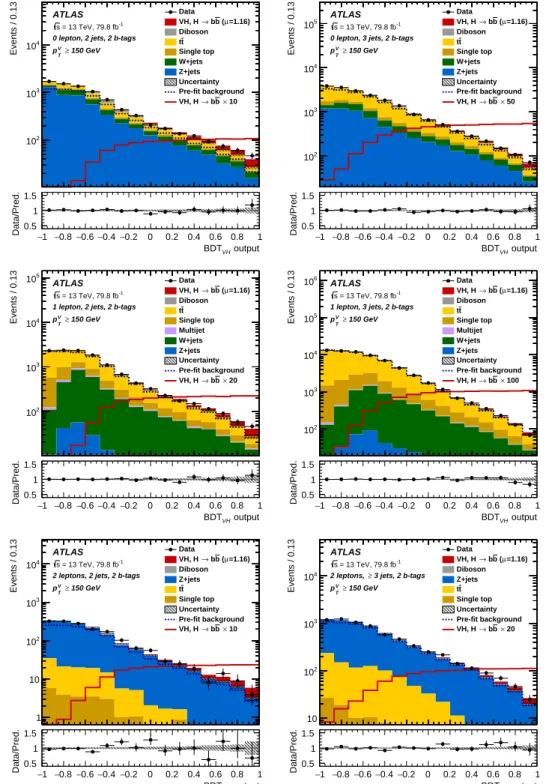
Figure 1 shows the BDT output distributions in the most sensitive, high-pVT, region. The background prediction in all post-fit distributions is obtained by normalising the backgrounds and setting the nuisance parameters according to the results of the signal extraction fit. The post-fit signal and background yields are shown in Table10for all signal regions.
For a Higgs boson mass of 125 GeV, when all lepton channels are combined, the probability p0of obtaining
a signal at least as strong as the observation from background alone is 5.3 · 10−7, whilst the expected value is 7.3 · 10−6. The observation corresponds to an excess with a significance of 4.9 standard deviations, to be compared with an expectation of 4.3 standard deviations. The fitted value of the signal strength is:
µbb
V H = 1.16+0.27−0.25= 1.16 ± 0.16(stat.)+0.21−0.19(syst.).
Figure2 shows the data, background and signal yields, where final-discriminant bins in all regions are combined into bins of log10(S/B). Here, S and B are the fitted signal and background yields in each analysis bin, respectively.
Table11shows the signal strengths, p0and significance values from the combined fit with a single signal
strength, and from a fit where the lepton channels each have their own signal strength. The probability that the signal strengths measured in the three lepton channels5are compatible is 80%.
A combined fit is also performed with floating signal strengths separately for the W H and Z H production processes. The results of this fit are shown in Figure 3. The W H and Z H production modes have observed (expected) significances of 2.5 (2.3) and 4.0 (3.5) standard deviations, respectively, with a linear correlation between the two signal strengths of −1%.
5The probability of compatibility between fits differing only in their number of parameters of interest is evaluated in the
asymptotics regime, where the difference between their maximum likelihoods follows a χ2distribution with a number of degrees of freedom equal to the difference between the numbers of parameters of interest.
T able 10 : The Higgs boson signal, bac k g round and data yields for eac h signal region categor y in eac h c hannel after the full selection of the multiv ar iate anal y sis. The signal and bac k g round yields are nor malised to the results of the global lik elihood fit. All sy stematic uncer tainties are included in the indicated uncer tainties. An entr y of “–” indicates that a specific bac k g round component is negligible in a cer tain region, or that no simulated e v ents are left after the anal y sis selection. 0-lepton 1-lepton 2-lepton p V T > 150 Ge V, 2-b-tag p V T > 150 Ge V, 2-b-tag 75 Ge V < p V T < 150 Ge V, 2-b-tag p V T > 150 Ge V, 2-b-tag Process 2-jet 3-jet 2-jet 3-jet 2-jet ≥ 3-jet 2-jet ≥ 3-jet Z + ll 17 ± 11 27 ± 18 2 ± 1 3 ± 2 14 ± 9 49 ± 32 4 ± 3 30 ± 19 Z + c l 45 ± 18 76 ± 30 3 ± 1 7 ± 3 43 ± 17 170 ± 67 12 ± 5 88 ± 35 Z + HF 4770 ± 140 5940 ± 300 180 ± 9 348 ± 21 7400 ± 120 14160 ± 220 1421 ± 34 5370 ± 100 W + ll 20 ± 13 32 ± 22 31 ± 23 65 ± 48 < 1 < 1 < 1 < 1 W + c l 43 ± 20 83 ± 38 139 ± 67 250 ± 120 < 1 < 1 < 1 < 1 W + HF 1000 ± 87 1990 ± 200 2660 ± 270 5400 ± 670 2 ± 0 13 ± 2 1 ± 0 4 ± 1 Single top q uark 368 ± 53 1410 ± 210 2080 ± 290 9400 ± 1400 188 ± 89 440 ± 200 23 ± 7 93 ± 26 t¯t 1333 ± 82 9150 ± 400 6600 ± 320 50200 ± 1400 3170 ± 100 8880 ± 220 104 ± 6 839 ± 40 Diboson 254 ± 49 318 ± 90 178 ± 47 330 ± 110 152 ± 32 355 ± 68 52 ± 11 196 ± 35 Multi-jet e sub-c h. – – 100 ± 100 41 ± 35 – – – – Multi-jet µ sub-c h. – – 138 ± 92 260 ± 270 – – – – T otal bk g. 7850 ± 90 19020 ± 140 12110 ± 120 66230 ± 270 10960 ± 100 24070 ± 150 1620 ± 30 6620 ± 80 Signal (pos t-fit) 128 ± 28 128 ± 29 131 ± 30 125 ± 30 51 ± 11 86 ± 22 28 ± 6 67 ± 17 Data 8003 19143 12242 66348 11014 24197 1626 6686
1 − −0.8−0.6−0.4−0.2 0 0.2 0.4 0.6 0.8 1 output VH BDT 2 10 3 10 4 10 Events / 0.13 Data =1.16) µ ( b b → VH, H Diboson t t Single top W+jets Z+jets Uncertainty Pre-fit background 10 × b b → VH, H ATLAS -1 = 13 TeV, 79.8 fb s
0 lepton, 2 jets, 2 b-tags 150 GeV ≥ V T p 1 − −0.8−0.6−0.4−0.2 0 0.2 0.4 0.6 0.8 1 output VH BDT 0.5 1 1.5 Data/Pred. 1 − −0.8−0.6−0.4−0.2 0 0.2 0.4 0.6 0.8 1 output VH BDT 2 10 3 10 4 10 5 10 Events / 0.13 Data =1.16) µ ( b b → VH, H Diboson t t Single top W+jets Z+jets Uncertainty Pre-fit background 50 × b b → VH, H ATLAS -1 = 13 TeV, 79.8 fb s
0 lepton, 3 jets, 2 b-tags 150 GeV ≥ V T p 1 − −0.8−0.6−0.4−0.2 0 0.2 0.4 0.6 0.8 1 output VH BDT 0.5 1 1.5 Data/Pred. 1 − −0.8−0.6−0.4−0.2 0 0.2 0.4 0.6 0.8 1 output VH BDT 2 10 3 10 4 10 5 10 Events / 0.13 Data =1.16) µ ( b b → VH, H Diboson t t Single top Multijet W+jets Z+jets Uncertainty Pre-fit background 20 × b b → VH, H ATLAS -1 = 13 TeV, 79.8 fb s
1 lepton, 2 jets, 2 b-tags 150 GeV ≥ V T p 1 − −0.8−0.6−0.4−0.2 0 0.2 0.4 0.6 0.8 1 output VH BDT 0.5 1 1.5 Data/Pred. 1 − −0.8−0.6−0.4−0.2 0 0.2 0.4 0.6 0.8 1 output VH BDT 2 10 3 10 4 10 5 10 6 10 Events / 0.13 Data =1.16) µ ( b b → VH, H Diboson t t Single top Multijet W+jets Z+jets Uncertainty Pre-fit background 100 × b b → VH, H ATLAS -1 = 13 TeV, 79.8 fb s
1 lepton, 3 jets, 2 b-tags 150 GeV ≥ V T p 1 − −0.8−0.6−0.4−0.2 0 0.2 0.4 0.6 0.8 1 output VH BDT 0.5 1 1.5 Data/Pred. 1 − −0.8−0.6−0.4−0.2 0 0.2 0.4 0.6 0.8 1 output VH BDT 1 10 2 10 3 10 4 10 Events / 0.13 Data =1.16) µ ( b b → VH, H Diboson Z+jets t t Single top Uncertainty Pre-fit background 10 × b b → VH, H ATLAS -1 = 13 TeV, 79.8 fb s
2 leptons, 2 jets, 2 b-tags 150 GeV ≥ V T p 1 − −0.8−0.6−0.4−0.2 0 0.2 0.4 0.6 0.8 1 output VH BDT 0.5 1 1.5 Data/Pred. 1 − −0.8−0.6−0.4−0.2 0 0.2 0.4 0.6 0.8 1 output VH BDT 10 2 10 3 10 4 10 Events / 0.13 Data =1.16) µ ( b b → VH, H Diboson Z+jets t t Single top Uncertainty Pre-fit background 20 × b b → VH, H ATLAS -1 = 13 TeV, 79.8 fb s 3 jets, 2 b-tags ≥ 2 leptons, 150 GeV ≥ V T p 1 − −0.8−0.6−0.4−0.2 0 0.2 0.4 0.6 0.8 1 output VH BDT 0.5 1 1.5 Data/Pred.
Figure 1: The BDTV H output post-fit distributions in the 0-lepton (top), 1-lepton (middle) and 2-lepton (bottom) channels for 2-b-tag events, in the 2-jet (left) and exactly 3-jet (or ≥ 3 jets for the 2-lepton case) (right) categories in the high-pVTregion. The background contributions after the global likelihood fit are shown as filled histograms. The Higgs boson signal (mH = 125 GeV) is shown as a filled histogram on top of the fitted backgrounds normalised to
the signal yield extracted from data (µ = 1.16), and unstacked as an unfilled histogram, scaled by the factor indicated in the legend. The dashed histogram shows the total pre-fit background. The size of the combined statistical and systematic uncertainty for the sum of the fitted signal and background is indicated by the hatched band. The ratio of the data to the sum of the fitted signal (µ = 1.16) and background is shown in the lower panel. The BDTV Houtput
3.5 − −3 −2.5 −2 −1.5 −1 −0.5 0 (S/B) 10 log 2 10 3 10 4 10 5 10 6 10 Events / 0.35 Data =1.16) µ ( b b → VH, H t t Single top Z+jets Multijet W+jets Diboson ATLAS -1 = 13 TeV, 79.8 fb s 3.5 − −3 −2.5 −2 −1.5 −1 −0.5 0 (S/B) 10 log 0 5 Pull (stat.)
Figure 2: Event yields as a function of log10(S/B) for data, background and a Higgs boson signal with mH = 125 GeV.
Final-discriminant bins in all regions are combined into bins of log10(S/B), with S being the fitted signal and B
the fitted background yields. The Higgs boson signal contribution is shown after rescaling the SM cross-section according to the value of the signal strength extracted from data (µ = 1.16). In the lower panel, the pull of the data relative to the background (the statistical significance of the difference between data and fitted background) is shown with statistical uncertainties only. The full line indicates the pull expected from the sum of fitted signal and background relative to the fitted background.
Table 11: Measured signal strengths with their combined statistical and systematic uncertainties, expected and observed p0and significance values (in standard deviations) from the combined fit with a single signal strength, and
from a combined fit where each of the lepton channels has its own signal strength, using 13 TeV data.
Signal strength Signal strength
p0 Significance
Exp. Obs. Exp. Obs.
0-lepton 1.04+0.34−0.32 9.5 · 10−4 5.1 · 10−4 3.1 3.3
1-lepton 1.09+0.46−0.42 8.7 · 10−3 4.9 · 10−3 2.4 2.6
2-lepton 1.38+0.46−0.42 4.0 · 10−3 3.3 · 10−4 2.6 3.4
bb VH
µ
0 0.5 1 1.5 2 2.5 3 3.5 4 4.5 5 Comb. ZH WH 0.25 − +0.27 1.16 ( ) −+0.160.16 , −+0.210.19 0.31 − +0.33 1.20 ( ) −+0.230.23 , −+0.230.20 0.43 − +0.47 1.08 ( ) −+0.270.27 , −+0.380.34Tot. ( Stat., Syst. )
Total Stat.
ATLAS VH, H→ bb s=13 TeV, 79.8 fb-1
Figure 3: The fitted values of the Higgs boson signal strength µbbV Hfor mH = 125 GeV for the WH and ZH processes
and their combination. The individual µV Hbb values for the (W /Z )H processes are obtained from a simultaneous fit with the signal strength for each of the W H and Z H processes floating independently. The probability of compatibility of the individual signal strengths is 84%.
7.2 Results of the dijet-mass analysis
For all channels combined the fitted value of the signal strength is µbb
V H = 1.06+0.36−0.33 = 1.06 ± 0.20(stat.)+0.30−0.26(syst.),
in good agreement with the result of the multivariate analysis. The observed excess has a significance of 3.6 standard deviations, compared to an expectation of 3.5 standard deviations. Good agreement is also found when comparing the values of signal strengths in the individual channels from the dijet-mass analysis with those from the multivariate analysis.
The mbb distribution is shown in Figure 4 summed over all channels and regions, weighted by their respective values of the ratio of fitted Higgs boson signal and background yields and after subtraction of all backgrounds except for the W Z and Z Z diboson processes.
40 60 80 100 120 140 160 180 200
[GeV]
bbm
2
−
0
2
4
6
8
10
12
14
16
18
Events / 10 GeV (Weighted, backgr. sub.)
Data =1.06) µ ( b b → VH, H Diboson Uncertainty ATLAS -1 = 13 TeV, 79.8 fb s
Dijet mass analysis 0+1+2 leptons
2+3 jets, 2 b-tags Weighted by Higgs S/B
Figure 4: The distribution of mbb in data after subtraction of all backgrounds except for the W Z and Z Z diboson processes, as obtained with the dijet-mass analysis. The contributions from all lepton channels, pVT regions and number-of-jets categories are summed and weighted by their respective S/B, with S being the total fitted signal and B the total fitted background in each region. The expected contribution of the associated W H and Z H production of a SM Higgs boson with mH= 125 GeV is shown scaled by the measured signal strength (µ = 1.06). The size of
the combined statistical and systematic uncertainty for the fitted background is indicated by the hatched band.
7.3 Results of the diboson analysis
As a validation of the Higgs boson search analysis, the measurement of V Z production based on the multivariate analysis described in Section6.3returns a value of signal strength
µbb
in good agreement with the Standard Model prediction. Analogously to the V H signal, fits are also performed with separate signal strengths for the W Z and Z Z production modes, and the results are shown in Figure5. bb VZ
µ
0 0.5 1 1.5 2 2.5 3 3.5 4 4.5 5 Comb. ZZ WZ 0.18 − +0.20 1.20 ( ) −+0.080.08 , −+0.190.16 0.20 − +0.23 1.26 ( ) −+0.100.10 , −+0.200.17 0.44 − +0.46 0.90 ( ) −+0.170.17 , −+0.430.41Tot. ( Stat., Syst. )
Total Stat.
ATLAS VZ, Z→ bb s=13 TeV, 79.8 fb-1
Figure 5: The fitted values of the V Z signal strength µV Zbb for the W Z and Z Z processes and their combination. The
individual µbbV Z values for the (W /Z )Z processes are obtained from a simultaneous fit with the signal strengths for each of the W Z and Z Z processes floating independently. The probability of compatibility of the individual signal strengths is 47%.
7.4 Results of combinations
7.4.1 Run 1 and Run 2 combination for V H , H → b ¯b
The result of the Run 2 analysis is combined with the Run 1 V H, H → b ¯b result following the methodology described in Section6.4. The observed p0value is 5.5·10−7, corresponding to an excess with a significance
of 4.9 standard deviations, compared with an expectation of 5.1 standard deviations. The measured signal strength is:
µbb
V H = 0.98+0.22−0.21= 0.98 ± 0.14(stat.)+0.17−0.16(syst.).
Fits are also performed with the signal strengths floated independently for the W H and Z H production processes. The probability of compatibility of the signal strengths for the W H and Z H production processes is 72%, and the results of this fit are shown in Figure6.
7.4.2 Observation of H → b ¯b decays
The V H result is further combined with results of the searches for the Standard Model Higgs boson decaying into a b ¯b pair produced in association with a t ¯t pair and in vector-boson fusion for both Run 1