HAL Id: hal-03107162
https://hal.archives-ouvertes.fr/hal-03107162
Submitted on 12 Jan 2021
HAL is a multi-disciplinary open access
archive for the deposit and dissemination of
sci-entific research documents, whether they are
pub-lished or not. The documents may come from
teaching and research institutions in France or
abroad, or from public or private research centers.
L’archive ouverte pluridisciplinaire HAL, est
destinée au dépôt et à la diffusion de documents
scientifiques de niveau recherche, publiés ou non,
émanant des établissements d’enseignement et de
recherche français ou étrangers, des laboratoires
publics ou privés.
A new Last Interglacial temperature data synthesis as
an improved benchmark for climate modeling
Emilie Capron, Aline Govin, E.J. Stone
To cite this version:
Emilie Capron, Aline Govin, E.J. Stone. A new Last Interglacial temperature data synthesis as an
improved benchmark for climate modeling. Past Global Changes Magazine, Past Global Changes
(PAGES) project, 2015, 23 (1), pp.4-5. �hal-03107162�
PAGES MAGAZINE ∙ VOLUME 23 ∙ NO 1 ∙ JANUAry 2015
4
SCIENCE HIGHLIGHTS: Glacial terminations and interGlacials
The Last Interglacial (LIG, ~129-116 thousand of years BP, ka) represents a test bed for climate model feedbacks under warmer-than-present conditions. A spatio-temporal picture of LIG temperature evolution is indispensable to per-form robust model-data comparisons and ex-amine the General Circulation Models (GCMs) used for future climate projections (e.g. Lunt et al. 2013; Bakker and renssen 2014).
However, existing LIG data syntheses (e.g. Turney and Jones 2010; McKay et al. 2011) consist of a single time slice and introduced dating uncertainties of up to several thousands of years by using the paleoclimatic records on their original timescales. Nevertheless, there is evidence that LIG surface temperatures peaked asynchronously around the globe (e.g. Bauch and Erlenkeuser 2008; Govin et al. 2012).
Here, we overcome the difficulty of aligning temperature records from different paleocli-matic archives retrieved across the world by limiting a new data synthesis to the high-lat-itudes. Our compilation provides a dynamic representation of the LIG temperature evolution, allowing more robust model-data comparisons.
A new LIG data synthesis associated with a coherent temporal framework
We combined 47 surface air and sea surface temperature records across the LIG polewards of 40°N and 40°S, respectively (Capron et al. 2014). Surface air temperature records are deduced from water stable isotopic profiles of ice cores. Sea surface temperatures (SST) are reconstructed from foraminiferal Mg/Ca ratios, alkenone unsaturation ratios, and faunal assemblages in marine sediment cores. We use as a reference chronology for both marine and ice records, the recent Antarctic ice core chronology AICC2012. It is the first integrated timescale over the LIG, based on a multi-site approach including both Greenland (NGrIP) and Antarctic ice cores (EDC, EDML, TALDICE, Vostok). The numerous new strati-graphic links significantly reduce the absolute dating uncertainty down to ±1.6 ka (1σ) during the studied time interval (Bazin et al. 2013)
making it a particularly well-constrained age scale.
In a first step we have transferred the Dome F and NEEM ice cores onto AICC2012 since they were not initially included in the construc-tion of AICC2012. In a second step, to align marine records onto AICC2012, we follow the strategy of Govin et al. (2012). It is based on the assumption that surface-water tempera-ture changes in the sub-Antarctic zone of the
Southern Ocean (respectively in the North Atlantic) occurred simultaneously with air tem-perature variations above Antarctica (respec-tively Greenland).
The aligned time series have already been used for comparison with transient model sim-ulations (as in Loutre et al. 2014). In addition, we constructed four time slices to assist snap-shot simulation assessment. We calculated temperature anomalies relative to present-day
We compiled ice and marine records of high-latitude temperature changes and placed them on a common timescale.
We also produced climatic time slices for 115, 120, 125, and 130 ka. They represent improved benchmarks to perform
Last Interglacial model-data comparisons.
a new last interglacial temperature
data synthesis as an improved
benchmark for climate modeling
Emilie Capron
1, A. Govin
2and E.J. Stone
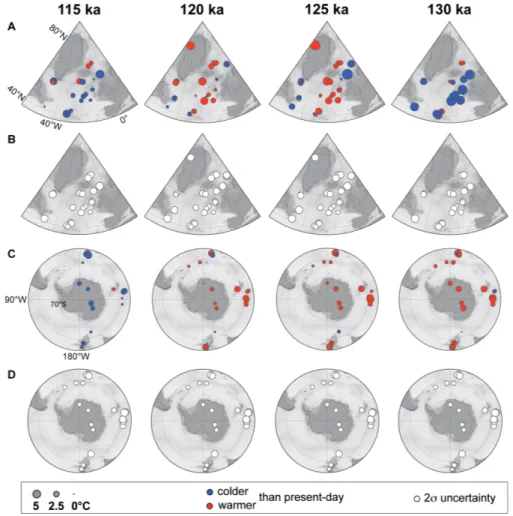
3Figure 1: Temperature time slices across the Last Interglacial. NH air and sea surface temperature anomalies (A)
associated with 2σ uncertainties (B). (C) and (D) are the same as (A) and (B) for the SH. The size of the dots (both for temperature anomaly and associated 2σ uncertainty) follows the temperature scale given in the box. For all panels, warming (cooling) compared with modern temperature is represented in red (purple). The temperature anomalies are relative to the World Ocean Atlas (WOA) 1998, 10 m-depth data for marine records and relative to present-day instrumental surface air temperature measurements for ice records.
PAGES MAGAZINE ∙ VOLUME 23 ∙ NO 1 ∙ JANUAry 2015
5
SCIENCE HIGHLIGHTS: Glacial terminations and interGlacials
conditions over 2 ka time windows centred on 115, 120, 125, and 130 ka.
The aligned surface temperature time series and the time slice reconstructions benefit from quantitative uncertainty estimates. We used a Monte-Carlo analysis, taking into account temperature reconstruction errors as well as the propagation of dating uncertainties (see Capron et al. 2014 for details). This results in a final uncertainty estimate of ± 2.6°C on aver-age for SST records and ± 1.5°C for surface air temperature Antarctic records (Fig. 1).
LIG climatic features
Producing robust age models and SST recon-structions remains difficult in the Nordic Seas. Thus, we focus on the robust climatic patterns found in the North Atlantic and Southern Ocean. The time slices (Fig. 2) capture the major features characterizing the spatial se-quence of events described in the time series (Capron et al. 2014). In particular, the com-parison of the 130 ka time slices from the two polar regions illustrates that warming in the Southern Hemisphere (SH) preceded warming of the North Atlantic. This interhemispheric asynchrony, which has already previously been reported (e.g. Govin et al. 2012), is attributed to the “bipolar seesaw” mechanism, induced by changes in the intensity of the Atlantic Meridional Overturning Circulation (AMOC; Stocker and Johnsen 2003). The melting of northern ice sheets extended beyond the penultimate deglaciation into the early LIG and the associated release of meltwater into the North Atlantic was suggested to have delayed the full establishment of a vigorous AMOC, resulting in peak Antarctic temperatures while the North Atlantic was still cold (Govin et al. 2012).
The 130 ka time slice also reveals SSTs signif-icantly cooler-than-present-day conditions, e.g. up to 7.5 ± 3°C cooler in the northern high latitudes, while temperatures were slightly warmer than present-day (1.7 ± 2.5°C on average) in most of the SH sites. Warmer-than-present-day climatic conditions are clearly visi-ble in the 130, 125, and 120 ka time slices in the SH, while they are only observed locally and with a relatively high uncertainty in the 125 and 120 ka time slices of the Northern Hemisphere (NH). Warmer-than-present-day conditions hence lasted longer at southern high latitudes than at northern ones. Finally, the magnitude of temperature changes is larger at northern than at southern high latitudes during the LIG onset and demise.
Toward more robust model-data comparisons
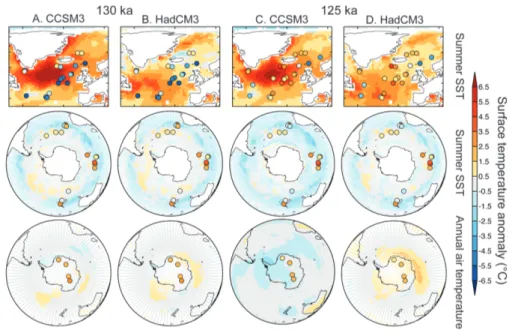
To illustrate the potential of our new LIG data synthesis for model-data comparisons, we compared 125 and 130 ka snapshot simu-lations performed with two GCMs, CCSM3 (Otto-Bliesner et al. 2013; Collins et al. 2006), and HadCM3 (Gordon et al. 2000), to the corresponding data-based time slices (Fig. 2; Capron et al. 2014).
We observe that both models predict warmer-than-present-day North Atlantic conditions at 130 ka, i.e. earlier than in our data compilation. Furthermore, neither of the models reproduce
the reconstructed early SH warming (Fig. 2A,B). This means that the 130 ka simulations do not reproduce the bipolar seesaw pattern identified from the data synthesis. This is pos-sibly because they only simulate the climate response to the static orbital and greenhouse gas forcing at 130 ka without taking into ac-count potential dynamic AMOC responses to persistent NH ice sheet melting. Indeed, sim-ulations where freshwater forcing to the North Atlantic from the Laurentide and Eurasian ice sheets is introduced perform better in reproducing the late NH warming (Govin et al. 2012). Also both models run under modern polar ice sheet and vegetation configurations, not under 130 ka ones. Other simulations considering an additional feedback linked to the disintegration of the West Antarctic ice sheet resulted in an additional warming over Antarctica (Holden et al. 2010; Otto-Bliesner et al. 2013).
At 125 ka, both models produce warmer-than-present-day conditions in the North Atlantic region (Fig. 2C,D). In Antarctica, CCSM3 suggests a cooler climate at 125 ka compared to present-day while ice core data suggest warmer conditions (Fig. 2C). The observed dissimilarities between CCSM3 and HadCM3 simulations are likely related to their different sea ice sensitivities (Otto-Bliesner et al. 2013).
Summary and outlook
We produced the first data synthesis that documents the spatio-temporal evolution of high-latitude temperatures from the LIG onset to its demise, using one single refer-ence chronology. We paid careful attention to estimate quantitatively the temperature errors, including the propagation of dating uncertain-ties. Our study reveals asynchronous temper-ature changes between the polar regions and highlights the importance of considering the LIG sequence of events rather than averaging climate conditions over the entire LIG period.
This work should encourage more in-depth model-data comparison exercises with both snapshots and transient model simulations. Future work should not only consider surface temperature, but include additional climatic parameters (e.g. deep ocean circulation changes, sea ice extent) to move towards a more complete picture of LIG climatic and environmental changes.
ACKNOWLEDGEMENTS
This work has also received funding from the UK-NErC consortium iGlass (NE/I009906/1).
AFFILIATIONS
1British Antarctic Survey, Cambridge, UK
2MArUM/Center for Marine Environmental Sciences,
University of Bremen, Germany
3School of Geographical Sciences, University of
Bristol, UK
CONTACT
Emilie Capron: [email protected]
rEFErENCES
Bakker P, renssen H (2014) Clim Past 10: 1633-1644 Bauch HA, Erlenkeuser H (2008) Polar res 27: 135-151 Bazin L et al. (2013) Clim Past 9: 1715-1731
Capron E et al. (2014) Quat Sci rev 103: 116-133 Collins WD et al. (2006) J Clim 19: 2122-2143 Gordon C et al. (2000) Clim Dyn 16: 147-168 Govin A et al. (2012) Clim Past 8: 483-507 Holden PB et al. (2010) Clim Past 6: 431-443 Loutre MF et al. (2014) Clim Past 10: 1541-1565 Lunt DJ et al. (2013) Clim Past 9: 699-717 McKay NP et al. (2011) Geophys res Lett 38,
doi:10.1029/2011GL048280
Otto-Bliesner B et al. (2013) Phil Trans r Soc London, Ser A, doi: 10.1098/rsta.2013.0097
Stocker TF, Johnsen SJ (2003) Paleoceanography 18, doi:10.1029/2003PA000920
Turney CSM, Jones rT (2010) J Quat Sci 25(6): 839–843 Veres D et al. (2013) Clim Past 9: 1733-1748
Figure 2: Model-data comparison of time slice reconstructions for 130 ka (A and B) and 125 ka (C and D) with
respective snapshot simulations using the CCSM3 and HadCM3 models. Summer SST temperature anomalies from the marine sediment data (dots) superimposed onto model July-August-September SSTs in the NH and model January-February-March SSTs in the Southern Ocean; Annual mean surface air temperature anomalies from ice core data (dots) superimposed onto the model annual surface air temperature.