HAL Id: hal-02968254
https://hal.archives-ouvertes.fr/hal-02968254
Submitted on 16 Oct 2020
HAL is a multi-disciplinary open access
archive for the deposit and dissemination of
sci-entific research documents, whether they are
pub-lished or not. The documents may come from
teaching and research institutions in France or
abroad, or from public or private research centers.
L’archive ouverte pluridisciplinaire HAL, est
destinée au dépôt et à la diffusion de documents
scientifiques de niveau recherche, publiés ou non,
émanant des établissements d’enseignement et de
recherche français ou étrangers, des laboratoires
publics ou privés.
HoanKiemAir: simulating impacts of urban
management practices on traffic and air pollution using
a tangible agent-based model
Pham Minh Duc, Kevin Chapuis, Alexis Drogoul, Benoit Gaudou, Arnaud
Grignard, Nicolas Marilleau, Nguyen-Huu Tri
To cite this version:
Pham Minh Duc, Kevin Chapuis, Alexis Drogoul, Benoit Gaudou, Arnaud Grignard, et al..
HoanKiemAir: simulating impacts of urban management practices on traffic and air pollution using
a tangible agent-based model. International Conference on Computing and Communication
Tech-nologies (RIVF 2020), Oct 2020, Ho Chi Minh, Vietnam. pp.1-7, �10.1109/RIVF48685.2020.9140787�.
�hal-02968254�
HoanKiemAir: simulating impacts of urban
management practices on traffic and air pollution
using a tangible agent-based model
PHAM Minh Duc
ICTLab USTH Ha Noi, Viet Nam phamminhduc0711@gmail.com
Kevin CHAPUIS
UMMISCO Sorbonne University, IRD
F-93143, Bondy, France kevin.chapuis@ird.fr
Alexis DROGOUL
UMMISCO Sorbonne University, IRD
F-93143, Bondy, France alexis.drogoul@ird.fr
Benoit GAUDOU
University Toulouse Capitole UMMISCO Sorbonne University, IRD
Ha Noi, Viet Nam benoit.gaudou@gmail.com
Arnaud GRIGNARD
City Science MIT Media Lab Cambridge, USA agrignard@gmail.com
Nicolas MARILLEAU
UMMISCO Sorbonne University, IRD
F-93143, Bondy, France nmarilleau@gmail.com
NGUYEN-Huu Tri
UMMISCO Sorbonne University, IRD
IXXI, ENS Lyon F-93143, Bondy, France
tnguyenh@gmail.com
Abstract—Pedestrian zones are present in numerous cities around the world, and Hanoi city began to organize one a few years ago. However, closing roads can lead to heavy traffic congestion in surrounding areas and, consequently, more air pollution in these areas. There is, therefore, a need for analyzing and predicting the outcomes in terms of air pollution when certain roads are closed, before actually implementing a plan. In this project, we used the GAMA platform to build an agent-based model that simulates the traffic and air quality in Hoan Kiem district. This model can be used as a decision support tool for local authorities and as an information tool for the general public: thanks to its output on a tangible interface, people can interact with the simulation at public venues and explore various scenarios. Although more accurate data and realistic diffusion models are still lacking and will need further research in the future, the simulation is alreay able to reflect traffic and air pollution peaks during rush hours quite realistically.
Index Terms—GAMA platform, agent-based modeling, traffic modeling, air quality, 3D map
I. INTRODUCTION
Air pollution is a problem that has become more and more serious over the years, especially in developing countries. In Hanoi, Vietnam, the measured amount of PM2.5 (particles with a diameter < 2.5µm)1 is often higher than the safety
level recommended by the World Health Organization2, and
this is likely to lead, in a not so distant future, to serious respiratory diseases. Although sorting out the causes of air pollution is not an easy task as no inventory has ever been made for Hanoi, one of the major factors is the constant and
1Air pollution monitoring provided by Hanoi authorities is available on the
website: https://moitruongthudo.vn/.
2WHO recommendations related to Air pollution are available here:
https://www.who.int/news-room/fact-sheets/detail/ambient-(outdoor) -air-quality-and-health
heavy load of traffic, mainly caused by the fact that most of the inhabitants use private modes of transport [1].
In 2016, the Hanoi People Committee came up with a plan to organize pedestrian zones in Hanoi, where vehicles would be prohibited during the weekends. It has been experimented, and then implemented, in two different areas of the city, one of which is situated around the iconic Hoan Kiem lake. Over the years, this area has become a popular tourist attraction as well as a gathering point for locals. However, in a city as dense as Hanoi, closing roads, especially in the city centre, is not without consequences on the traffic flows and, albeit indirectly, on the air pollution induced by this temporarily reorganized traffic. While the local quality of air certainly improves around Hoan Kiem lake, traffic congestion caused by this closure is likely to lead to a degradation elsewhere, potentially harming the health of other districts’ inhabitants. It is therefore of importance to provide means for assessing the impacts of such decisions on air quality, as well as examining the consequences of possible extensions of the current pedestrian policies on traffic and the patterns of induced air pollution.
For this reason, we developed HoanKiemAir, an agent-based model which can simulate traffic and the consequent air pollu-tion in the Hoan Kiem district area. Using these simulapollu-tions, one is able to observe and study the impact of pedestrian zones on traffic and air quality. By allowing to explore multiple scenarios, it can not only serve as a decision-support tool, but also provide information and raise public awareness about the current situation. The model was developed using the GAMA platform [2], which is an integrated development environment designed for building agent-based models and launch simulations. We also included different road closing strategies to find out how they alter the simulation. To improve
the user immersion, we set up a tangible interface consisting of a 3D-printed map of the area, a video projector and an Android application. This allows users to interact with the application and see changes in traffic and pollution directly on the 3D map.
The paper is organized as follows: Section II presents a review of related works. Section III describes the agent-based model. Section IV presents how the tangible interface works. Section V presents the simulation results. Section VI concludes and proposes possible future developments.
II. RELATEDWORKS A. Agent-based modeling
An Agent-Based Model (ABM) [3] is a way to represent a system by modeling its individual components, named agents, their behaviors (perception, decision-making process, learning...) and their interactions, and to locate them in an environment (that can be a continuous 2D/3D Euclidean space or discrete grids or graphs). ABMs have now a wide variety of applications, from physical & life sciences to economics and social sciences. A great advantage of ABMs is the fact that they can generate emergent phenomena from interactions between agents. Another advantage of ABMs is their flexibil-ity: one can always modify the agent population or fine tune agents’ behaviors to observe effects on simulation results. B. Traffic flow models
Traffic flow models are used to optimize traffic flow or reduce the number of traffic jams. They are usually classified into 3 types [4]. Macroscopic models assume that traffic flows share similarities with fluid flows. Mathematical equations are devised to describe various characteristics of the flow, such as mean speed, density and volume. Although they can produce realistic outputs with low computational cost, they ignore the heterogeneous behaviors of vehicles. On the other hand, microscopic models describe vehicles as individuals with a state (position, speed, acceleration) and a behavior. However, the computation cost increases with the number of vehicles in the network. Lastly, mesoscopic models are hybrid models, which represents vehicles in small groups, where vehicles can make certain decisions but with limitations to their behaviors. C. Air pollution models
To model air pollution, an emission model and a dispersion model are needed. The emission model calculates the amount of pollutant released by vehicles, whereas the dispersion model aims to describe how air pollutants disperse in the atmosphere. A widely used dispersion model is the Operational Street Pollution Model (OSPM) [5], suitable for areas with street canyons (i.e. streets surrounded by tall buildings). It assumes that two factors contribute to the concentration of pollutant in a street canyon: traffic flow (with direct emission from vehicles and air recirculation in the street canyon) and other sources (pollution from other streets, factories, power plants,...). OSPM also includes a submodel for chemical reactions that generate NO2. The European emission model
COPERT IV [6] is integrated into OSPM as an emission module. The emission values are derived based on fuel type, emission factor as well as vehicle type and diurnal traffic frequency. [7] created a GAMA model to study traffic-induced air pollution in Hanoi using a simplified version of OSPM. D. Tangible simulation
The idea of tangible simulation is to associate a tangible support with simulations, such as a 3D printed map, sandbox, laser cut map [8]... A tangible platform helps non-experts to better understand complex processes thanks to visualizations that synthesize data analyses and simulation outputs in a coherent and physical manner. Such platforms like the ones developed by [9]–[11] give the possibility to visualize the link between mobility patterns and the quality of the air but also to simulate the impact of different scenarios to support decision making through a dynamic, iterative, and evidence-based process.
III. MODEL DESCRIPTION
The model is described following the standard ODD (Overview, Design concepts, Details) protocol [12].
A. Overview
1) Purpose: The model aims at simulating traffic and air pollution in the Hoan Kiem district, along with a road management module to change the arrangement of pedestrian zone. This can support planning of these zones, as well as helping people to think about interactions between these three components.
2) Entities, state variables, scales: The model is composed of two main dynamics, the traffic sub-model and the pollution sub-model, influenced by several scenarios of pedestrianiza-tion.
The traffic sub-model generates the movement of vehicles on a road network. It is composed of three types of agents: vehicle,roadandintersection. The pollution sub-model is split into an emission and a dispersion model. The emission model is represented by only one pollutant_manageragent, which takes the output of the traffic model, computes the amount of pollutants by vehicles, and then passes them to the dispersion model. The dispersion model has a collection of pollutant_cell agents, which represent air parcels. The main attributes for each species are listed in Table I.
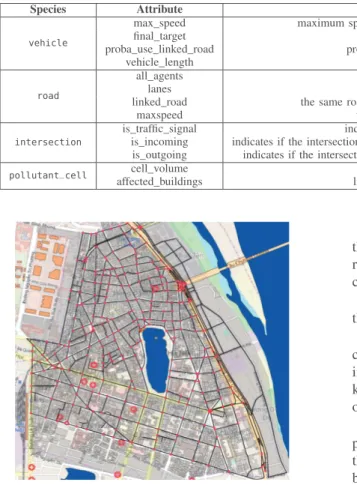
The modeled area is shown in Figure 1. The bounding box of the area is about 2506m x 2779m. The grid in the dispersion model has 64 x 64 cells, so each is approximately 39m x 43m. Increasing the number of cells can improve the precision of the dispersion process, but increases the computational cost. The time step is set to a value of 15 seconds (as vehicle moves require a short duration).
3) Process overview & scheduling: In a simulation cycle, the agents in the traffic model are scheduled first, followed by those in the emission and dispersion model.
In the traffic model, theintersectionagents are executed first. Those with traffic signals check if they should switch
TABLE I: Species’ attributes (only notable attributes are listed)
Species Attribute Description
vehicle
max_speed maximum speed of the vehicle (i.e. the speed it wants to achieve) final_target the destination it wants to reach
proba_use_linked_road probability to turn around on a two-way road vehicle_length length of the vehicle
road
all_agents list of vehicles currently on the road
lanes number of lanes
linked_road the same road in the opposite direction (is nil for one-way road) maxspeed the maximum speed allowed on this road
intersection
is_traffic_signal indicates if the intersection has a traffic signal
is_incoming indicates if the intersection is on the boundary of the simulation area, and leads into the area is_outgoing indicates if the intersection is on the boundary of the simulation area, and leads outward
pollutant_cell cell_volume volume of the cell
affected_buildings list of buildings in the vicinity ofc the cell
Fig. 1: Chosen area for simulations: red dots are intersections between roads (black lines) and grey polygons are buildings.
state, and then block or unblock the roads accordingly. The roadagents are executed next, updating their congestion level. Finally, the vehicle agent are scheduled and they move towards their target on the traffic graph.
After all vehicle agents have completed their movement, thepollutant_manageragent computes the amount of traffic-induced pollutants and store them inpollutant_cellagents. Next, it decreases the pollutant values in these cells according to a predefined decay rate, as well as disperses the pollutants to neighboring cells.
B. Design concepts
1) Basic principles: Here are the principles and hypotheses of the model:
• Vehicles only emit pollutants when they move.
• Traffic is the only air pollution source in the simulation. • Different pollutants are similarly dispersed due to the
oversimplification of the atmospheric dispersion model. 2) Emergence: Even though the movements of vehicles are modeled with a simple strategy, the observed congestion is reported and concentrated in other areas when the pedestrian zone is active.
3) Adaptation: A vehicle can adjust its route depending on the traffic status ahead. Once a vehicle knows that its next road is heavily congested, it can either stick to its old plan, or change to another route with lighter traffic.
4) Objectives: The objective ofvehicleagents is to reach their target in the shortest amount of time.
5) Sensing: road agents are aware of which vehicle are currently moving on them and how long they have been stuck, in order to calculate the congestion factor.vehicleagents also know the congestion status of theroadthey are on. They also obey traffic signals given byintersectionagents.
6) Interaction: Thepollutant_manager agent derives the pollutant amount emitted by vehicle agents, and then add this amount to the appropriate pollutant_cell. Interactions between vehicle agents is indirect, through congestion on roads.
7) Stochasticity: Stochasticity only lies in the behavior of vehicle agents. When a vehicle agent has no target, it randomly chooses one of theintersectionas its new target, with a higher tendency to choose one that leads outside of Hoan Kiem area. When avehicleencounters a traffic jam, it has an option to change routes in order to circumvent the jam or it can proceed with the congested road, the latter being less probable.
8) Observation: The simulation comes with a graphical interface, allowing to visualize road congestion (Figure 2a) and pollution concentration (Figure 2b) in the simulated area. There is also a control panel where one can tweak the simula-tion parameters. A graph illustrating the maximum Air Quality Index (AQI) is included, and the results are continuously saved in order to compare with data coming from real sensors. C. Details
1) Initialization: At the start of the simulation, the follow-ing steps are performed:
• The bounding box of the simulation is defined as
the envelope of the shapefile containing roads. A grid of pollutant_cell agents is created, spanning the entire bounding box. The pollutant values in each pollutant_cellis set to 0.
(a) Traffic (red intensity indi-cates congestion)
(b) Pollution (AQI displayed on buildings)
Fig. 2: Two display modes for the simulation UI
• Buildings are also created from a shapefile, and are linked
to their respective pollutant_cell. pollutant_cell agents then calculate the attribute building_density from the area and height of buildings that are inside the cell.
The vehicle agents are not created when the simulation is initialized, but when the variable storing the number of vehicles is changed.
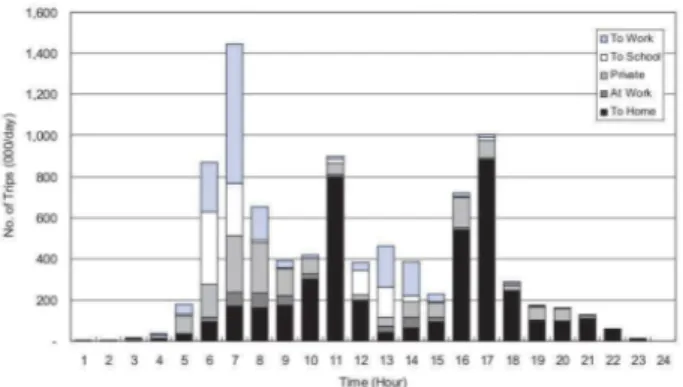
2) Input data: Hourly traffic distribution data (see Fig-ure 3) is provided by [13]. They estimated the number of trips in each hour throughout the day.
To create the road network in Hoan Kiem area, we used the data provided by OpenStreetMap (www.openstreetmap.org). Apart from geometry information, OSM data also contains various attributes for roads such as number of lanes, maximum speed allowed, one-way or two-way, traffic lights’ availability. Although OSM does provide some information for certain roads, most values are missing, so we defined a set of default values: the number of lanes as 4 or 3, respectively for one or two-way roads and max speed limit of 60 km/h. The road intersections were also extracted as a set of points, and several are tagged with an attribute indicating that there are traffic lights at these positions.
For visualization purposes, we also gathered data for build-ings (manually sketched out from satellite image), lakes and rivers in the area.
All of the data are summarized in Table II. 3) Sub-models:
a) Traffic model: The basic idea of the traffic model is to letvehicle agents move on a road network towards a target crossroad with a speed depending on their maximum speed and congestion on the road. When they reach their desire target, they choose another one and start again. Simulating traffic in GAMA is fairly straightforward, just by attaching three built-in GAMA skills [14]: skill_road, skill_road_node and advanced_driving to road,intersection and vehicles agents respectively. These skills provide necessary attributes and actions to agents, creating a simple traffic model inspired by the Intelligent Driver Model [15] along with the lane-changing model MOBIL [16].
Fig. 3: Hourly traffic distribution [13]
Road network. First of all, the road and intersection agents are combined to create a graph representing the road network, in which vertices are intersections and edges are roads. There are 3 types of vertices: incoming, outgoing and internal. Incoming and outgoing vertices are leaf vertices, which are linked to roads that come from or lead to other areas outside Hoan Kiem district, respectively. When a vehicleis created or finishes a road trip, it is placed on an incoming or an internal vertex, with the former option being more likely. Similarly, its target is either an outgoing or an internal vertex, with a higher probability assigned to the former. This provides an effect of traffic flowing in and out of the district. To model the attractiveness of each road, the edge weights are calculated as a linear combination of the road’s length, number of lanes and maximum speed limit.
Mobile agents. There are two types ofvehicleagents: cars and motorbikes, which only differ by their speed and size but nevertheless share the same behavior: they all move from one vertex to another using the optimal path. When approaching anintersection, they slow down and check for factors like traffic signals, othervehicleblocking theintersection, etc., before moving onto the nextroad.
Despite having a route planned out, avehiclecan alter its decision if it is stuck in a traffic jam. Whenever its speed is lower than a certain speed, it starts counting for how long it has been stuck. Once the counter passes a threshold, the attribute proba_use_linked_road is increased. This is a probability that encourages the vehicle to take the road in the opposite direction, escaping the traffic jam. We also follow an approach proposed by [17], by encoding the perception of a traffic jam into the road agents. Each road estimates a congestion value, which consists of not only the road’s current traffic density but also the number ofvehiclewhich have been stuck for a long time on the road. When this value reaches a specified threshold, theroadswitches to a "encumbered" state, and its edge weight significantly increases. During a road trip, a vehicle can be informed that the next road in its path is encumbered, giving it an opportunity to choose an alternative route.
Road management. Three road scenarios are included to examine how traffic flow changes when particular roads are
TABLE II: Input data to the simulation
Name Description Sources
Traffic
Roads Polylines representing the road network in Hoan Kiem area OpenStreetMap Intersections Points representing intersections Generated from the roads shapefile Traffic frequency Hourly distribution of trips in 2005 HAIDEP study team
Pollution
Sensors Points indicating the air quality sensors placed in the area Hoan Kiem district People’s Committee Misc
Buildings Polygons that represent buildings Created manually Water Polygons that represent lakes and rivers OpenStreetMap
closed: (i) the pedestrian area is not active, (ii) the current scenario of pedestrian area is active (Figure 4a), and (iii) a possible extension of the pedestrian area (Figure 4b). When the road_scenario parameter is changed, the road graph is recreated by changing the edges accordingly.
(a) Active pedestrian zone (b) Possible extension plan
Fig. 4: Road scenarios: roads in black are opened for vehicles, while those in orange are closed.
b) Emission model: To determine the amount of pollu-tants released by traffic, we use a small subset of emission factors provided by [18], displayed in Table III. When the simulation steps, the pollutant_manager agent compute the distance traveled by eachvehicleduring the last step, and use that distance to calculate the mass of emitted pollutants. The resulting values are then added to the pollutant_cellagent which the vehicleis inside.
TABLE III: Applied emission factors (from [18]) Vehicle type Emission factor (g km
-1)
PM SO2 NOx CO
Motorbike 0.10 0.03 0.30 3.62 Car 4-16 seats 0.10 0.17 1.50 3.62
c) Dispersion model: We tried two methods to model the dispersion of air pollutants: one that uses rectangular grid cells to model air parcels, and another one that uses road cells, i.e. cells that follow roads’ geometry and somewhat represent the idea of road canyons. Both are currently simplified, as they make two assumptions: (i) pollutants are distributed uni-formly in one cell, (ii) different pollutant types are dispersed identically. In this paper, we present only the first model. The model with grid cells simply computes the uniform diffusion
(with disappearance) of the four pollutants over the regular grid, using the convolution matrix product method.
AQI calculation. To make pollutant values in cells easy to interpret, an Air Quality Index (AQI) value is calculated from the amount of each pollutant. We use the method given by [19]: AQIh = maxx(AQI h x) with AQI h x = T Sh x QCx∗ 100 where AQIh
x is the AQI of a pollutant x at hour h, T S h xis the
measured average amount of pollutant x in h, and QCxis the
allowed average amount of pollutant x in an hour (Table IV). TABLE IV: Allowed hourly average amount for different pollutants (measured in µg/m3) [19]
CO NOx SO2 PM10
30000 200 350 300
IV. TANGIBLE INTERFACE
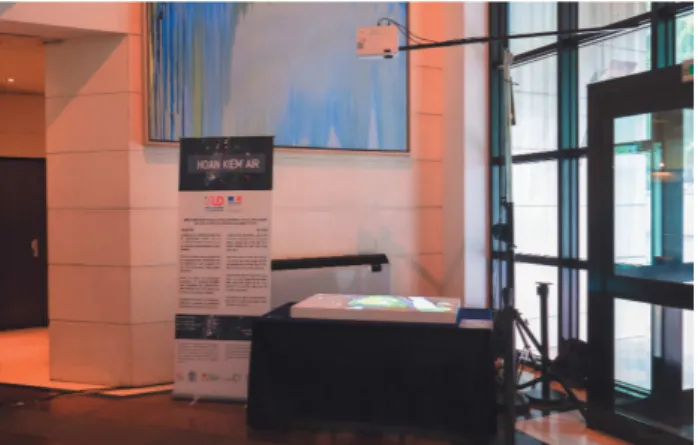
Inspired by the MarrakAir [10] project, we built a tangible interface to display the simulation with three components:
• A 3D-printed map of Hoan Kiem area,
• A video projector (using the 3D map as a screen), • An Android application that remotely communicates with
GAMA, allowing users to modify simulation parameters. The setup can be used either in interactive mode (users can change vehicle numbers) or in demonstration mode (the number of vehicles is set from the traffic data in Hanoi). A. The 3D model
To print the 3D map, we transformed the GIS shapefiles used to initialize the model into STL files (file format for 3D models)3. First, the roads, buildings and water shapefiles
are merged together to create one single shapefile. The empty holes are then filled with polygons to represent the base of the 3D map. Each polygon is assigned a height value that follow this order: road < base < building. Secondly, this shapefile is converted into a single STL file. Finally, this file is repaired and cut in a grid-like fashion into 28 (4 x 7) square pieces. Each piece is approximately 16 x 16cm (a size technically constrained by most of the common 3D printers).
3More details: https://github.com/WARMTeam/HoanKiemAir/tree/master/
Fig. 5: 3D map setup
A detailed description of the process can be found on the GitHub repository of the project4.
B. Android application for remote control
This application acts as a remote control for GAMA, allow-ing users to change some parameters: the vehicles numbers, the pedestrian scenario and the visualisation mode.
For communication between the app and GAMA, the MQTT (Message Queuing Telemetry Transport) protocol is used. It is a fast and lightweight publish/subscribe messaging protocol, commonly used in IoT applications. Basically, clients exchange messages through a server (often called a broker). A client can publish a message with a topic to the broker, then the broker distributes that message to clients that have subscribed to the topic.
For the implementation, we used ApacheMQ5, which
pro-vides an implementation for the MQTT broker. On the client side, we used Eclipse Paho6 for the Android app, and the
extension remoteGUI in GAMA.
Once the application is connected to the broker, it publishes messages with predefined topics as soon as users adjust any parameters. In the simulation, a special agent listens to the broker and modifies parameters depending on received messages.
V. RESULTS
To evaluate and improve the accuracy of the simulation, the parameters of the model are explored. As a first attempt we only focus on a single pollutant concentration, CO. The time series data is taken from real air quality sensors in Hanoi7. We retrieved the CO concentration of the sensor placed at Hang Dau street (in the Hoan Kiem district), in the period from 00:00 to 23:00 on July 15th, to compare with the results of our model.
The objective is to minimize the mean absolute error between the time series values, using Tabu Search [20] as
4https://github.com/WARMTeam/HoanKiemAir/tree/master/stl_convert 5https://activemq.apache.org/index.html
6https://github.com/eclipse/paho.mqtt.android 7moitruongthudo.vn
Fig. 6: Comparison between simulated and real CO concen-tration on Monday, July 15th 2019 (all roads available)
the exploration method. The parameters to explore are: the simulation time step length, the pollutant decay rate, the spread radius and the depth of the road cells.
We can observe that the two time series fit decently with the best parameter combination, apart from an unusual peak at 04:00. We can also notice that the simulated pollution series shows such peaks before each of the three rush hour periods. One explanation, that needs to be further investigated, could be a lack of bootstrap phase in the simulations to initially fill in the air pollution containers.
Some additional experiments have been conducted with data taken during week-end days (with the pedestrian area). Results show that the model still need to be improved to fit with real data.
VI. CONCLUSION AND FUTURE WORK
In this project, we built an agent-based model to simulate traffic and air quality in Hoan Kiem district of Ha Noi. We also created a tangible interface to showcase this simulation to the public. The simulation has been presented on World Environ-ment day, at the French Embassy of Hanoi. Yet, there is still a lot of room for improvement in order to make the simulation more realistic and accurate. The main directions concern (i) the gathering of more precise data related to traffic (number of vehicles and their moving behavior) and pollution (what are the other pollution sources and what is their contribution to the measured air pollution) and (ii) the improvement of models (in particular to add a decently accurate atmospheric dispersion model, e.g. one that takes into account relevant factors such as wind, moisture, temperature...).
ACKNOWLEDGMENT
The HoanKiemAir project was funded by the French em-bassy in Vietnam, in collaboration with the Hoan Kiem district People’s Committee.
REFERENCES
[1] V. A. Tuan, “Mode choice behavior and modal shift to public transport in developing countries - the case of Hanoi city,” Journal of the Eastern Asia Society for Transportation Studies, vol. 11, pp. 473–487, 2015. [2] P. Taillandier, B. Gaudou, A. Grignard, Q.-N. Huynh, N. Marilleau,
P. Caillou, D. Philippon, and A. Drogoul, “Building, composing and experimenting complex spatial models with the GAMA platform,” GeoInformatica, vol. 23, no. 2, pp. 299–322, 04 2019.
[3] C. Macal and M. North, “Tutorial on agent-based modelling and simulation,” J. Simulation, vol. 4, pp. 151–162, 09 2010.
[4] S. P. Hoogendoorn and P. H. L. Bovy, “State-of-the-art of vehicular traffic flow modelling,” Journal of Systems and Control Engineering, vol. 215, no. 4, pp. 283–303, 2001.
[5] O. Hertel and R. Berkowicz, “Operational Street Pollution Model (OSPM). evaluation of the model on data from St. Olavs street in Oslo,” National Environmental Research Institute, Danish Ministry of the Environment, Tech. Rep., 01 1989.
[6] L. Ntziachristos, D. Gkatzoflias, C. Kouridis, and Z. Samaras, “Copert: A european road transport emission inventory model,” Information Technologies in Environmental Engineering, pp. 491–504, 01 2009. [7] K. Rodrique, T. Ho, and M. H. Nguyen, “An agent-based simulation
for studying air pollution from traffic in urban areas: The case of Hanoi city,” IJACSA, vol. 10, pp. 596–604, 04 2019.
[8] F. Salim, “Tangible 3d urban simulation table,” in Proceedings of the Symposium on Simulation for Architecture & Urban Design, vol. 23. Society for Computer Simulation International, 2014.
[9] L. Alonso, Y. R. Zhang, A. Grignard, A. Noyman, Y. Sakai, M. ElKatsha, R. Doorley, and K. Larson, “Cityscope: a data-driven interactive simula-tion tool for urban design. use case volpe,” in Internasimula-tional Conference on Complex Systems. Springer, 2018, pp. 253–261.
[10] J. Emery, N. Marilleau, N. Martiny, T. Thévenin, T. Nguyen-Huu, M. Badram, A. Grignard, H. Hbdid, A.-M. Laatabi, and S. Toubhi, “Marrakair: une simulation participative pour observer les émissions atmosphériques du trafic routier en milieu urbain,” in Treizièmes Ren-contres de Théo Quant, 2017.
[11] A. Grignard, N. Macià, L. Alonso Pastor, A. Noyman, Y. Zhang, and K. Larson, “Cityscope andorra: a multi-level interactive and tangible agent-based visualization,” in Proc. of AAMAS, 2018, pp. 1939–1940. [12] V. Grimm, U. Berger, D. Deangelis, J. Polhill, J. Giske, and S. F.
Rails-back, “The ODD protocol: A review and first update,” Ecological Modelling, vol. 221, pp. 2760–2768, 11 2010.
[13] ALMEC Corp, Nippon Koei Co Ltd, Yachiyo Engineering Co Ltd, “The comprehensive urban development programme in hanoi capital city of the socialist republic of vietnam (haidep),” 3 2007.
[14] P. Taillandier, “Traffic simulation with the GAMA platform,” in Inter-national Workshop on Agents in Traffic and Transportation, 05 2014. [15] M. Treiber, A. Hennecke, and D. Helbing, “Congested traffic states in
empirical observations and microscopic simulations,” Physical Review E, vol. 62, pp. 1805–1824, 02 2000.
[16] A. Kesting, M. Treiber, and D. Helbing, “General lane-changing model mobil for car-following models,” Transportation Research Record, vol. 1999, pp. 86–94, 01 2007.
[17] P. Tranouez, D. Eric, and P. Langlois, “A multiagent urban traffic simulation,” JNSA, vol. 3, pp. 98–106, 01 2012.
[18] N. Tho Hung, M. Ketzel, S. Jensen, and N. T. Oanh, “Air pollution modeling at road sides using the operational street pollution model-a case study in hanoi, vietnam,” Journal of the Air & Waste Management Association (1995), vol. 60, pp. 1315–26, 11 2010.
[19] Vietnam Env. Admin., “Quyet ¯dinh 878/QÐ-TCMT ve viec ban hanh so tay huong dan tinh toan chi so chat luong khong khi (AQI),” 2011. [20] F. Glover, “Tabu search—part I,” ORSA Journal on computing, vol. 1,