HAL Id: hal-03169210
https://hal.archives-ouvertes.fr/hal-03169210
Submitted on 15 Mar 2021
HAL is a multi-disciplinary open access
archive for the deposit and dissemination of
sci-entific research documents, whether they are
pub-lished or not. The documents may come from
teaching and research institutions in France or
abroad, or from public or private research centers.
L’archive ouverte pluridisciplinaire HAL, est
destinée au dépôt et à la diffusion de documents
scientifiques de niveau recherche, publiés ou non,
émanant des établissements d’enseignement et de
recherche français ou étrangers, des laboratoires
publics ou privés.
Distributed under a Creative Commons Attribution - NonCommercial - NoDerivatives| 4.0
International License
1-year mortality from infective endocarditis
M. Collonnaz, M. L. Erpelding, Francois Alla, F. Goehringer, F. Delahaye, B.
Iung, V. Le Moing, B. Hoen, C. Selton-Suty, N. Agrinier
To cite this version:
M. Collonnaz, M. L. Erpelding, Francois Alla, F. Goehringer, F. Delahaye, et al.. Data on prognostic
factors associated with 3-month and 1-year mortality from infective endocarditis. Data in Brief,
Elsevier, 2020, 33, pp.106478. �10.1016/j.dib.2020.106478�. �hal-03169210�
Data in Brief 33 (2020) 106478
ContentslistsavailableatScienceDirect
Data
in
Brief
journalhomepage:www.elsevier.com/locate/dib
Data
Article
Data
on
prognostic
factors
associated
with
3-month
and
1-year
mortality
from
infective
endocarditis
Magali
Collonnaz
1
,
2
,
Marie-Line
Erpelding
1
,
François
Alla
3
,
François
Goehringer
4
,
François
Delahaye
5
,
Bernard
Iung
6
,
Vincent
Le
Moing
7
,
Bruno
Hoen
4
,
Christine
Selton-Suty
8
,
Nelly
Agrinier
1
,
2
,
∗
,
for
the
AEPEI
study
group
1 CHRU-Nancy, INSERM, CIC-EC, Epidémiologie clinique, F-540 0 0 Nancy, France 2 Université de Lorraine, APEMAC, F-540 0 0 Nancy, France
3 Bordeaux Population Health Research Center, Université de Bordeaux, Inserm, Bordeaux, France 4 Université de Lorraine, CHRU-Nancy, Infectious and tropical diseases, F-540 0 0 Nancy, France 5 Louis Pradel hospital, Cardiology, Lyon, France
6 Bichat Claude-Bernard hospital, Cardiology, Paris, France
7 Montpellier University Hospital, Infectious and tropical diseases, Montpellier, France 8 CHRU-Nancy, Cardiology, F-540 0 0 Nancy, France
a
r
t
i
c
l
e
i
n
f
o
Article history: Received 7 October 2020 Revised 20 October 2020 Accepted 28 October 2020 Available online 1 November 2020
Keywords: Infective endocarditis Referral bias Tertiary hospitals Prognostic factors Survival Selection bias
a
b
s
t
r
a
c
t
Thisarticle describes supplementary tables and figures as-sociatedwith the researchpaperentitled “Impactof refer-ral bias on prognostic studies outcomes: insights from a population-basedcohortstudyoninfectiveendocarditis”.The aforementioned paperisasecondaryanalysis ofdatafrom the EI 2008 cohort on infective endocarditis and aimedat characterisingreferralbias.Atotalof497patientsdiagnosed withdefiniteinfective endocarditisbetweenJanuary1stand
December31st2008wereincludedinEI2008.Datawere
col-lectedfrom hospitalmedical recordsbytrainedclinical re-search assistants. Patients were divided into three groups: admittedtoatertiaryhospital(groupT),admittedtoa non-tertiaryhospitalandreferredsecondarilytoatertiary hospi-tal(group NTT)oradmitted to anon-tertiaryhospital and
DOI of original article: 10.1016/j.annepidem.2020.09.008
∗ Corresponding author.
E-mail address: nelly.agrinier@univ-lorraine.fr (N. Agrinier). https://doi.org/10.1016/j.dib.2020.106478
2352-3409/© 2020 The Author(s). Published by Elsevier Inc. This is an open access article under the CC BY-NC-ND license ( http://creativecommons.org/licenses/by-nc-nd/4.0/ )
not referred (group NT). The pooled (NTT+T) group mim-icked studies recruiting patients in tertiary hospitals only. Twodifferentstartingpointswereconsideredforfollowup: dateoffirsthospitaladmissionanddateoffirstadmissionto atertiaryhospitalifany(hereinafterreferredtoas“referral time”).Referralbiasisatypeofselectionbiaswhichcan oc-curduetorecruitmentofpatientsintertiaryhospitalsonly (excludingthosewhoareadmittedtonon-tertiaryhospitals and not referred to tertiary hospitals). This bias may im-pact thedescriptionofpatients’characteristics,survival es-timates as well as prognosticfactors identification. Thesix tablespresentedinthispaperillustratehowpatients’ selec-tion (population-based sample[pooled(NT+NTT+T)group] versusrecruitmentintertiaryhospitalsonly[pooled(NTT+T) group]) might impact Hazards Ratios values for prognostic factors.CrudeandadjustedCoxregressionanalyseswerefirst performed toidentifyprognostic factors associatedwith 3-month and1-year mortalityinthe wholesampleusing in-clusion asthestartingpoint.Analyseswerethenperformed in the pooled (NTT+T) group first using inclusion as the starting pointandfinallyusingreferraltimeasthestarting point. Figures1 to3 illustrate howHR increasewith time for covariatesthat wereconsideredas time-varying covari-ates(covariate∗timeinteraction).
© 2020 The Author(s). Published by Elsevier Inc. ThisisanopenaccessarticleundertheCCBY-NC-ND license(http://creativecommons.org/licenses/by-nc-nd/4.0/ )
Specifications
Table
Subject Medicine
Specific subject area Epidemiology; Infectious Diseases
Type of data Tables and figures
How data were acquired Secondary analysis of data from the EI 2008 cohort on infective endocarditis
Data format Analysed
Parameters for data collection Patients presenting with a diagnosis of definite infective endocarditis (Duke criteria modified by Li) and admitted to a hospital between January 1 st 2008 and
December 31 st 2008 in one of the seven participating French regions were
included in the EI 2008 cohort.
All the patients included in EI 2008 were considered for our analyses. Description of data collection Baseline and follow-up data were collected from hospital medical records by
trained clinical research assistants and a standardized case report form was completed.
Vital status was collected from hospitals medical records, general practitioners’ records or civil registry one year after inclusion in the EI 2008 cohort.
Data source location Institution: CHRU Nancy
City/Town/Region: Nancy Country: France
Latitude and longitude for collected samples/data: 46.2276 ° N, 2.2137 ° E
Data accessibility The datasets generated during and/or analysed during the current study are not
publicly available due to restrictions pertaining to the French law, but are available from the corresponding author upon reasonable request.
Related research article Collonnaz M, Erpelding M-L, Alla F, Goehringer F, Delahaye F, Iung B, et al. Impact of referral bias on prognostic studies outcomes: insights from a population-based cohort study on infective endocarditis. Annals of Epidemiology [Internet]. 2020 Sep; Available from: https://doi.org/10.1016/j.annepidem.2020.09.008 [1]
M. Collonnaz, M.-L. Erpelding and F. Alla et al. / Data in Brief 33 (2020) 106478 3
Value
of
the
Data
•
Studies
recruiting
patients
in
tertiary
hospitals
only
are
subject
to
referral
bias.
The
results
presented
in
the
tables
are
part
of
a
comprehensive
analysis
of
the
impact
of
this
bias.
They
illustrate
how
referral
bias
can
impact
the
assessment
of
the
prognostic
value
of
factors
as-sociated
with
3-month
and
1-year
mortality
from
infective
endocarditis.
•
Practitioners
involved
in
infective
endocarditis
management
as
well
as
public
health
re-searchers
and
epidemiologists
may
benefit
from
these
data.
In
addition,
any
researcher
con-sidering
an
observational
study
of
a
rare
disease
prone
to
be
managed
in
non-tertiary
hospi-tals
at
some
point
may
benefit
from
these
data.
•
These
data
may
be
useful
for
researchers
aiming
at
characterising
the
impact
of
referral
bias
in
studies
on
infective
endocarditis
or
on
other
rare
diseases.
They
can
also
be
useful
for
future
research
on
infective
endocarditis
as
we
highlighted
the
importance
on
a
population-based
recruitment
of
patients.
1.
Data
Description
The
tables
are
supplementary
data
associated
with
the
research
paper
entitled
“Impact
of
referral
bias
on
prognostic
studies
outcomes:
insights
from
a
population-based
cohort
study
on
infective
endocarditis”
[1]
.
The
aforementioned
paper
is
a
secondary
analysis
of
data
from
the
EI
2008
cohort
and
aimed
at
characterising
referral
bias.
Tables
1
to
3
refer
to
the
identification
of
prognostic
factors
associated
with
3-month
mortal-ity
from
infective
endocarditis
(IE).
Tables
4
to
6
refer
to
the
identification
of
prognostic
factors
associated
with
to
1-year
mortality.
Tables
1
and
4
present
absolute
frequency,
crude
and
adjusted
Hazards
Ratios
(HR)
when
using
the
whole
sample
of
patients
(pooled
(NT
+
NTT
+
T)
group)
and
using
the
date
of
inclusion
(date
of
first
admission
to
hospital
for
IE)
as
the
starting
point
for
analyses.
Tables
2
and
5
present
absolute
frequency,
crude
and
adjusted
HRs
obtained
when
perform-ing
analyses
on
a
sample
of
patients
recruited
in
tertiary
hospitals
only
(pooled
(NTT
+
T)
group)
using
date
of
inclusion
as
the
starting
point.
Tables
3
and
6
present
absolute
frequency,
crude
and
adjusted
HRs
obtained
when
recruiting
patients
in
tertiary
hospitals
only
(pooled
(NTT
+
T)
group)
using
referral
time
(the
date
of
first
admission
to
a
tertiary
hospital
if
any)
as
the
starting
point.
A
total
of
six
prognostic
factors
were
associated
with
3-month
mortality
(age
≥70,
Charlson
comorbidity
index
≥2,
Staphylococcal
IE,
septic
shock,
cerebral
embolism,
and
serum
creatinine
level
≥18
μ
mol/L).
The
prognostic
factors
did
not
differ
across
groups;
however,
the
values
of
HRs
associated
with
these
prognostic
factors
were
influenced
by
sample
and
starting
point
se-lection.
When
using
the
date
of
inclusion
as
the
starting
point,
a
total
of
nine
prognostic
factors
were
associated
with
1-year
mortality
in
the
whole
sample
and
in
the
pooled
(NTT
+
T)
group
(age
≥70,
Charlson
comorbidity
index
≥2
∗time,
high
blood
pressure
∗time,
heart
failure
∗time,
Staphylococcal
IE,
valve
perforation,
septic
shock,
cerebral
embolism,
and
serum
creatinine
level
≥180
μ
mol/L).
When
using
referral
time
as
the
starting
point,
heart
failure
and
valve
perforation
were
no
longer
identified
as
prognostic
factors.
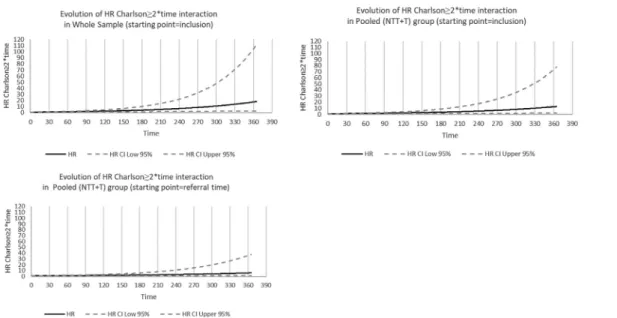
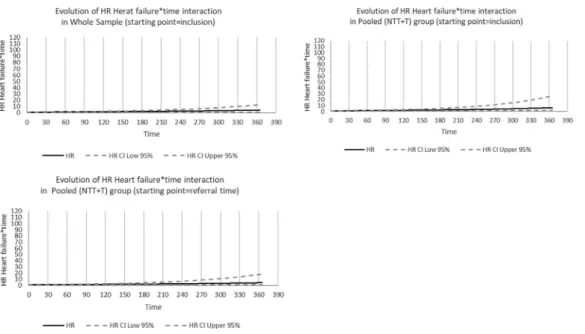
Figs.
1
to
3
represent
the
evolution
of
Hazard
Ratios
with
time
(in
days)
for
the
three
co-variates
(Charlson
comorbidity
index
≥2,
high
blood
pressure
and
heart
failure)
that
did
not
meet
the
proportional
hazard
assumption
and
were
included
in
1-year
survival
models
as
time-varying
covariates
(considering
covariate
∗time
interaction).
Figs.
1
to
3
show
how
HR
for
these
covariates
increased
with
time.
For
example,
for
Charlson
comorbidity
index
≥2,
the
risk
of
death
from
IE
in
the
whole
sample
was
multiplied
by
1.27
[1.09–1.47]
after
one
month
and
by
1.61
[1.20–2.17]
after
two
months.
Noteworthy,
95%
confidence
intervals
width
also
increased
M. Collonnaz, M.-L. Erpelding and F. Alla et al. / Dat a in Brief 33 (2020) 10 6 4 7 8 Table 1
Factors associated with 3-month mortality in the whole sample (pooled (NT + NTT + T) group) (Starting point = inclusion)
Whole sample (N = 460)
Crude association Adjusted association ∗
n HR 95% CI p HR 95% CI p Socio-demographic Age < 0.001 < 0.001 < 70 280 ref - ref - ≥70 180 2.212 1.495-3.274 2.350 1.535-3.597 Sex 0.226 Female 117 ref - Male 343 0.771 0.505-1.175 Medical history
Charlson Comorbidity index < 0.001 0.009
< 2 248 ref - ref -
≥ 2 212 2.196 1.466-3.288 1.760 1.150-2.695
High blood pressure 0.006
No 242 ref -
Yes 218 1.741 1.172-2.587
Injection drug use 0.242
No 435 ref -
Yes 25 0.504 0.160-1.588
Underlying heart disease (HD) 0.491
No previously known HD 236 ref -
Previously known HD without prosthetic valve 125 0.818 0.505-1.326
Prosthetic valve 99 1.148 0.714-1.847
Previous IE 0.119
No 430 ref -
Yes 30 0.401 0.127-1.264
Cardiac implantable electronic device 0.464
No 399 ref -
Yes 61 1.221 0.716-2.082
M. Collonnaz, M.-L. Erpelding and F. Alla et al. / Dat a in Brief 33 (2020) 10 6 4 7 8 Table 1 ( continued ) Whole sample (N = 460)
Crude association Adjusted association ∗
n HR 95% CI p HR 95% CI p
IE profile
Clinical characteristics
Suspected source of infection 0.071
Community 344 ref -
Healthcare-related, acquired in hospital 103 1.510 0.982-2.323 Healthcare-related, not acquired in hospital 13 2.096 0.845-5.201
Left heart endocarditis 0.390
No 90 ref - Yes 370 1.257 0.747-2.115 Fever 0.586 No 65 ref - Yes 395 1.175 0.657-2.103 Heart failure 0.043 No 303 ref - Yes 157 1.499 1.013-2.218 Microbiological characteristics Staphylococcal IE < 0.001 0.010 No 293 ref - ref - Yes 167 2.500 1.691-3.697 1.695 1.132-2.539 Echocardiographic characteristics Vegetation 0.625 No vegetation 59 ref - ≤15mm 204 0.856 0.459-1.597 > 15mm 117 1.176 0.613-2.254
Unknown size of vegetation 80 0.997 0.488-2.034
Perforation 0.445
No 375 ref -
Yes 85 0.812 0.476-1.385
M. Collonnaz, M.-L. Erpelding and F. Alla et al. / Dat a in Brief 33 (2020) 10 6 4 7 8 Table 1 ( continued ) Whole sample (N = 460)
Crude association Adjusted association ∗
n HR 95% CI p HR 95% CI p IE complications Cardiac abscess ∗∗ 0.048 No 361 ref - Yes 99 1.677 1.005-2.799 Septic shock ∗∗ < 0.001 < 0.001 No 385 ref - ref - Yes 75 5.463 3.647-8.183 3.873 2.4 80-6.04 9 Cerebral haemorrhage ∗∗ 0.002 No 427 ref - Yes 33 2.584 1.414-4.724 Cerebral embolism ∗∗ < 0.001 < 0.001 No 363 ref - ref - Yes 97 2.619 1.721-3.988 2.490 1.556-3.884 Vascular phenomena 0.083 No 242 ref - Yes 218 1.412 0.956-2.085 Immunologic phenomena 0.893 No 405 ref - Yes 55 0.960 0.525-1.752
Persistent sepsis despite treatment 0.085
No 410 ref -
Yes 50 1.599 0.938-2.727
Serum creatinine level ≥180 μmol/L < 0.001 < 0.001
No 327 ref - ref -
Yes 133 4.857 3.254-7.248 3.160 2.081-4.797
Crude and adjusted Cox regressions were performed.
∗Stepwise selection, sle = 0.20, sls = 0.05
M. Collonnaz, M.-L. Erpelding and F. Alla et al. / Dat a in Brief 33 (2020) 10 6 4 7 8 Table 2
Factors associated with 3-month mortality in patients who were managed in a tertiary hospital (Pooled (NTT + T) group) (Starting point = inclusion) Pooled (NTT + T) group (N = 404)
Crude association Adjusted association + Adjusted association ∗
n HR 95% CI p HR 95% CI p HR 95% CI p
Socio-demographic
Age 0.001 < 0.001 < 0.001
< 70 256 ref - ref - ref -
≥ 70 148 2.085 1.361-3.193 2.368 1.494-3.755 2.368 1.494-3.755
Sex 0.391
Female 99 ref -
Male 305 0.813 0.507-1.304
Medical history
Charlson Comorbidity index 0.002 0.020 0.020
< 2 226 ref - ref - ref -
≥ 2 178 2.011 1.303-3.105 1.712 1.087-2.699 1.712 1.087-2.699
High blood pressure 0.005
No 222 ref -
Yes 182 1.851 1.202-2.852
Injection drug use 0.362
No 381 ref -
Yes 23 0.585 0.185-1.851
Underlying heart disease (HD) 0.379
No previously known HD 208 ref -
Previously known HD without prosthetic valve 106 0.747 0.433-1.291
Prosthetic valve 90 1.157 0.695-1.926
Previous IE 0.182
No 376 ref -
Yes 28 0.457 0.14 4-1.4 45
Cardiac implantable electronic device 0.531
No 347 ref -
Yes 57 1.201 0.677-2.130
M. Collonnaz, M.-L. Erpelding and F. Alla et al. / Dat a in Brief 33 (2020) 10 6 4 7 8 Table 2 ( continued ) Pooled (NTT + T) group (N = 404)
Crude association Adjusted association + Adjusted association ∗
n HR 95% CI p HR 95% CI p HR 95% CI p
IE profile
Clinical characteristics
Suspected source of infection 0.100
Community 300 ref -
Healthcare-related, acquired in hospital 93 1.541 0.967-2.457 Healthcare-related, not acquired in hospital 11 2.061 0.747-5.687
Left heart endocarditis 0.384
No 79 ref - Yes 325 1.290 0.727-2.288 Fever 0.361 No 54 ref - Yes 350 1.380 0.692-2.754 Heart failure 0.088 No 262 ref - Yes 142 1.452 0.946-2.229 Microbiological characteristics Staphylococcal IE < 0.001 0.006 0.006
No 259 ref - ref - ref -
Yes 145 2.733 1.777-4.204 1.863 1.191-2.914 1.863 1.191-2.914 Echocardiographic characteristics Vegetation 0.495 No vegetation 52 ref - ≤15mm 173 0.965 0.476-1.958 > 15mm 104 1.414 0.685-2.922 Unknown size of vegetation 75 1.045 0.470-2.326
Perforation 0.396
No 324 ref -
Yes 80 0.780 0.440-1.384
M. Collonnaz, M.-L. Erpelding and F. Alla et al. / Dat a in Brief 33 (2020) 10 6 4 7 8 Table 2 ( continued ) Pooled (NTT + T) group (N = 404)
Crude association Adjusted association + Adjusted association ∗
n HR 95% CI p HR 95% CI p HR 95% CI p IE complications Cardiac abscess ∗∗ 0.022 No 309 ref - Yes 95 1.869 1.094-3.193 Septic shock ∗∗ < 0.001 < 0.001 < 0.001
No 340 ref - ref - ref -
Yes 64 5.288 3.387-8.254 3.622 2.209-5.937 3.622 2.209-5.937
Cerebral haemorrhage ∗∗ 0.001
No 375 ref -
Yes 29 2.941 1.559-5.548
Cerebral embolism ∗∗ < 0.001 < 0.001 < 0.001
No 315 ref - ref - ref -
Yes 89 2.618 1.662-4.125 2.563 1.567-4.190 2.563 1.567-4.190 Vascular phenomena 0.193 No 210 ref - Yes 194 1.328 0.866-2.034 Immunologic phenomena 0.711 No 353 ref - Yes 51 1.123 0.610-2.067
Persistent sepsis despite treatment 0.219
No 358 ref -
Yes 46 1.449 0.803-2.615
Serum creatinine level ≥180 μmol/L < 0.001 < 0.001 < 0.001
No 285 ref - ref - ref -
Yes 119 4.533 2.928-7.019 3.048 1.935-4.799 3.048 1.935-4.799
Crude and adjusted Cox regressions were performed.
∗Stepwise selection, sle = 0.20, sls = 0.05
+ Covariates resulting from the selection process in the whole sample were forced into the model
M. Collonnaz, M.-L. Erpelding and F. Alla et al. / Dat a in Brief 33 (2020) 10 6 4 7 8 Table 3
Factors associated with 3-month mortality in patients who were managed in a tertiary hospital (Pooled (NTT + T) group) (Starting point = referral time) Pooled (NTT + T) group (N = 410)
Crude association Adjusted association + Adjusted association ∗
n HR 95% CI p HR 95% CI p HR 95% CI p
Socio-demographic
Age 0.001 < 0.001 < 0.001
< 70 261 ref - ref - ref -
≥ 70 149 2.108 1.376-3.228 2.316 1.463-3.666 2.316 1.463-3.666
Sex
Female 100 ref - 0.335
Male 310 0.793 0.494-1.271
Medical history
Charlson Comorbidity index 0.001 0.029 0.029
< 2 230 ref - ref - ref -
≥ 2 180 2.038 1.320-3.145 1.662 1.054-2.621 1.662 1.054-2.621
High blood pressure 0.005
No 225 ref -
Yes 185 1.857 1.206-2.861
Injection drug use 0.359
No 386 ref -
Yes 24 0.583 0.184-1.845
Underlying heart disease (HD) 0.399
No previously known HD 212 ref -
Previously known HD without prosthetic valve 107 0.762 0.441-1.316
Prosthetic valve 91 1.168 0.701-1.945
Previous IE 0.196
No 382 ref -
Yes 28 0.467 0.148-1.479
Cardiac implantable electronic device 0.599
No 3511 ref -
Yes 59 1.166 0.658-2.069
M. Collonnaz, M.-L. Erpelding and F. Alla et al. / Dat a in Brief 33 (2020) 10 6 4 7 8 Table 3 ( continued ) Pooled (NTT + T) group (N = 410)
Crude association Adjusted association + Adjusted association ∗
n HR 95% CI p HR 95% CI p HR 95% CI p
IE profile
Clinical characteristics
Suspected source of infection 0.090
Community 304 ref -
Healthcare-related, acquired in hospital 95 1.559 0.978-2.486 Healthcare-related, not acquired in hospital 11 2.082 0.754-5.746
Left heart endocarditis 0.354
No 82 ref - Yes 328 1.311 0.739-2.336 Fever 0.374 No 55 ref - Yes 355 1.368 0.686-2.730 Heart failure 0.085 No 266 ref - Yes 144 1.458 0.950-2.239 Microbiological characteristics Staphylococcal IE < 0.001 0.007 0.007
No 263 ref - ref - ref -
Yes 147 2.732 1.776-4.202 1.854 1.186-2.899 1.854 1.186-2.899 Echocardiographic characteristics Vegetation 0.544 No vegetation 52 ref - ≤15mm 176 0.968 0.477-1.963 > 15mm 106 1.387 0.671-2.866 Unknown size of vegetation 76 1.036 0.465-2.306
Perforation 0.443
No 330 ref -
Yes 80 0.799 0.451-1.418
M. Collonnaz, M.-L. Erpelding and F. Alla et al. / Dat a in Brief 33 (2020) 10 6 4 7 8 Table 3 ( continued ) Pooled (NTT + T) group (N = 410)
Crude association Adjusted association + Adjusted association ∗
n HR 95% CI p HR 95% CI p HR 95% CI p IE complications Cardiac abscess ∗∗ 0.060 No 315 ref - Yes 95 1. 669 0.979-2.846 Septic shock ∗∗ < 0.001 < 0.001 < 0.001
No 345 ref . ref - ref -
Yes 65 5.057 3.239-7.894 3.462 2.119-5.657 3.462 2.119-5.657
Cerebral haemorrhage ∗∗ 0.001
No 381 ref -
Yes 29 2.830 1.500-5.336
Cerebral embolism ∗∗ < 0.001 < 0.001 < 0.001
No 321 ref - ref - ref -
Yes 89 2.579 1.638-4.061 2.518 1.544-4.105 2.518 1.544-4.105 Vascular phenomena 0.181 No 214 ref - Yes 196 1.338 0.874-2.051 Immunologic phenomena 0.674 No 359 ref - Yes 51 1.140 0.619-2.099
Persistent sepsis despite treatment 0.160
No 364 ref .
Yes 46 1.528 0.846-2.758
Serum creatinine level ≥180 μmol/L < 0.001 < 0.001 < 0.001
No 291 ref - ref - ref -
Yes 119 4.683 3.024-7.251 3.133 1.990-4.932 3.133 1.990-4.932
Crude and adjusted Cox regressions were performed.
∗Stepwise selection, sle = 0.20, sls = 0.05
+ Covariates resulting from the selection process in the whole sample were forced into the model ∗∗Time dependent covariate
M. Collonnaz, M.-L. Erpelding and F. Alla et al. / Dat a in Brief 33 (2020) 10 6 4 7 8 Table 4
Factors associated with 1-year mortality in the whole sample (pooled (NT + NTT + T) group) (Starting point = inclusion)
Whole sample (N = 466)
Crude association Adjusted association ∗
n HR 95% CI p HR 95% CI p Socio-demographic Age < 0.001 < 0.001 < 70 285 ref - ref - ≥70 181 2.495 1.764-3.529 2.402 1.653-3.489 Sex 0.103 Female 118 ref - Male 348 0.736 0.509-1.064 Medical history
Charlson Comorbidity index ∗∗∗ < 0.001 0.001
< 2 252 ref - ref -
≥ 2 214 1.011 1.006-1.016 1.008 1.003-1.013
High blood pressure ∗∗∗ < 0.001 0.006
No 245 ref - ref -
Yes 221 1.008 1.004-1.012 1.006 1.002-1.010
Injection drug use 0.079
No 440 ref -
Yes 26 0.358 0.114-1.125
Underlying heart disease (HD) 0.806
No previously known HD 240 ref -
Previously known HD without prosthetic valve 126 0.887 0.588-1.338
Prosthetic valve 100 1.029 0.667-1.587
Previous IE 0.078
No 436 ref -
Yes 30 0.408 0.151-1.105
Cardiac implantable electronic device 0.276
No 403 ref -
Yes 63 1.289 0.816-2.038
M. Collonnaz, M.-L. Erpelding and F. Alla et al. / Dat a in Brief 33 (2020) 10 6 4 7 8 Table 4 ( continued ) Whole sample (N = 466)
Crude association Adjusted association ∗
n HR 95% CI p HR 95% CI p
IE profile
Clinical characteristics
Suspected source of infection 0.033
Community 348 ref -
Healthcare-related, acquired in hospital 105 1.540 1.055-2.246 Healthcare-related, not acquired in hospital 13 2.010 0.879-4.599
Left heart endocarditis 0.471
No 93 ref - Yes 373 1.177 0.756-1.831 Fever 0.559 No 66 ref - Yes 400 1.164 0.699-1.937 Heart failure ∗∗∗ 0.001 0.027 No 307 ref - ref - Yes 159 1.006 1.002-1.009 1.004 1.0 0 0-1.0 07 Microbiological characteristics Staphylococcal IE < 0.001 0.004 No 297 ref - ref - Yes 169 2.179 1.548-3.067 1.679 1.177-2.395 Echocardiographic characteristics Vegetation 0.885 No vegetation 59 ref - ≤15mm 207 1.051 0.596-1.855 > 15mm 119 1.221 0.669-2.231
Unknown size of vegetation 81 1.099 0.573-2.106
Perforation 0.143 0.020
No 381 ref - ref -
Yes 85 0.690 0.420-1.134 0.545 0.327-0.909
M. Collonnaz, M.-L. Erpelding and F. Alla et al. / Dat a in Brief 33 (2020) 10 6 4 7 8 Table 4 ( continued ) Whole sample (N = 466)
Crude association Adjusted association ∗
n HR 95% CI p HR 95% CI p IE complications Cardiac abscess ∗∗ 0.283 No 367 ref - Yes 99 1.299 0.806-2.096 Septic shock ∗∗ < 0.001 < 0.001 No 390 ref - ref - Yes 76 4.129 2.840-6.003 3.360 2.211-5.104 Cerebral haemorrhage ∗∗ 0.015 No 433 ref - Yes 33 2.042 1.151-3.622 Cerebral embolism ∗∗ < 0.001 < 0.001 No 369 ref - ref - Yes 97 2.256 1.545-3.293 2.324 1.556-3.469 Vascular phenomena ∗∗∗ 0.182 No 246 ref - Yes 220 0.998 0.094-1.001 Immunologic phenomena 0.272 No 411 ref - Yes 55 0.717 0.396-1.298
Persistent sepsis despite treatment 0.091
No 416 ref -
Yes 50 1.521 0.936-2.474
Serum creatinine level ≥180 μmol/L < 0.001 < 0.001
No 333 ref - ref -
Yes 133 3.996 2.832-5.638 2.780 1.944-3.977
Crude and adjusted Cox regressions were performed.
∗Stepwise selection, sle = 0.20, sls = 0.05 ∗∗Time dependent covariate
M. Collonnaz, M.-L. Erpelding and F. Alla et al. / Dat a in Brief 33 (2020) 10 6 4 7 8 Table 5
Factors associated with 1-year mortality in patients who were managed in a tertiary hospital (Pooled (NTT + T) group) (Starting point = inclusion) Pooled (NTT + T) group (N = 410)
Crude association Adjusted association + Adjusted association ∗
n HR 95% CI p HR 95% CI p HR 95% CI p
Socio-demographic
Age < 0.001 < 0.001 < 0.001
< 70 261 ref - ref - ref -
≥ 70 149 2.253 1.543-3.290 2.193 1.460-3.293 2.193 1.460-3.293
Sex 0.271
Female 100 ref -
Male 310 0.791 0.521-1.200
Medical history
Charlson Comorbidity index ∗∗∗ 0.005 0.005
< 2 230 ref - < 0.001 ref - ref -
≥ 2 180 1.009 1.005-1.014 1.007 1.002-1.012 1.007 1.002-1.012
High blood pressure ∗∗∗ 0.007 0.007
No 225 ref - < 0.001 ref - ref -
Yes 185 1.008 1.004-1.013 1.006 1.002-1.011 1.006 1.002-1.011
Injection drug use 0.144
No 386 ref -
Yes 24 0.425 0.135-1.340
Underlying heart disease (HD) 0.664
No previously known HD 212 ref -
Previously known HD without prosthetic valve 107 0.862 0.541-1.373
Prosthetic valve 91 1.106 0.694-1.760
Previous IE 0.149
No 382 ref -
Yes 28 0.479 0.177-1.302
Cardiac implantable electronic device 0.341
No 351 ref -
Yes 59 1.272 0.775-2.088
M. Collonnaz, M.-L. Erpelding and F. Alla et al. / Dat a in Brief 33 (2020) 10 6 4 7 8 Table 5 ( continued ) Pooled (NTT + T) group (N = 410)
Crude association Adjusted association + Adjusted association ∗
n HR 95% CI p HR 95% CI p HR 95% CI p
IE profile
Clinical characteristics
Suspected source of infection 0.075
Community 304 ref -
Healthcare-related, acquired in hospital 95 1.484 0.978-2.253 Healthcare-related, not acquired in hospital 11 2.071 0.836-5.129
Left heart endocarditis 0.268
No 82 ref - Yes 328 1.331 0.802-2.208 Fever 0.362 No 55 ref - Yes 355 1.322 0.725-2.408 Heart failure ∗∗∗ < 0.001 0.017 0.017
No 266 ref - ref - ref -
Yes 144 1.007 1.003-1.011 1.005 1.001-1.009 1.005 1.001-1.009
Microbiological characteristics
Staphylococcal IE < 0.001 0.015 0.015
No 263 ref - ref - ref -
Yes 147 2.153 1.476-3.141 1.634 1.102-2.423 1.634 1.102-2.423 Echocardiographic characteristics Vegetation 0.607 No vegetation 52 ref - ≤15mm 176 1.221 0.633-2.358 > 15mm 106 1.523 0.768-3.022 Unknown size of vegetation 76 1.191 0.567-2.503
Perforation 0.178 0.047 0.047
No 330 ref - ref - ref -
Yes 80 0.694 0.408-1.181 0.574 0.332-0.992 0.574 0.332-0.992
M. Collonnaz, M.-L. Erpelding and F. Alla et al. / Dat a in Brief 33 (2020) 10 6 4 7 8 Table 5 ( continued ) Pooled (NTT + T) group (N = 410)
Crude association Adjusted association + Adjusted association ∗
n HR 95% CI p HR 95% CI p HR 95% CI p IE complications Cardiac abscess ∗∗ 0.116 No 315 ref - Yes 95 1.491 0.906-2.455 Septic shock ∗∗ < 0.001 < 0.001 < 0.001
No 345 ref - ref - ref -
Yes 65 3.962 2.610-6.013 2.991 1.874-4.773 2.991 1.874-4.773
Cerebral haemorrhage ∗∗ 0.005
No 381 ref -
Yes 29 2.386 1.308-4.352
Cerebral embolism ∗∗ < 0.001 < 0.001 < 0.001
No 321 ref - ref - ref -
Yes 89 2.184 1.443-3.307 2.266 1.452-3.535 2.266 1.452-3.535 Vascular phenomena ∗∗∗ 0.105 No 214 ref - Yes 196 0.997 0.993-1.001 Immunologic phenomena 0.624 No 359 ref - Yes 51 0.861 0.472-1.568
Persistent sepsis despite treatment 0.166
No 364 ref -
Yes 46 1.455 0.856-2.475
Serum creatinine level ≥180 μmol/L < 0.001 < 0.001 < 0.001
No 291 ref - ref - ref -
Yes 119 3.942 2.693-5.770 2.882 1.941-4.278 2.882 1.941-4.278
Crude and adjusted Cox regressions were performed.
∗Stepwise selection, sle = 0.20, sls = 0.05
+ Covariates resulting from the selection process in the whole sample were forced into the model ∗∗Time dependent covariate
M. Collonnaz, M.-L. Erpelding and F. Alla et al. / Dat a in Brief 33 (2020) 10 6 4 7 8 Table 6
Factors associated with 1-year mortality in patients who were managed in a tertiary hospital (Pooled (NTT + T) group) (Starting point = referral time) Pooled (NTT + T) group (N = 410)
Crude association Adjusted association + Adjusted association ∗
n HR 95% CI p HR 95% CI p HR 95% CI p
Socio-demographic
Age < 0.001 < 0.001 < 0.001
< 70 261 ref - ref - ref -
≥ 70 149 2.343 1.586-3.462 2.310 1.520-3.511 2.317 1.526-3.518
Sex 0.261
Female 100 ref -
Male 310 0.781 0.508-1.201
Medical history
Charlson Comorbidity index ∗∗∗ 0.003 0.036 0.022
< 2 230 ref - ref - ref -
≥ 2 180 1.008 1.003-1.013 1.005 1.0 0 0-1.010 1.006 1.001-1.011
High blood pressure ∗∗∗ 0.001 0.005 0.004
No 225 ref - ref - ref -
Yes 185 1.011 1.005-1.018 1.009 1.003-1.016 1.009 1.003-1.016
Injection drug use 0.201
No 386 ref -
Yes 24 0.473 0.150-1.491
Underlying heart disease (HD) 0.453
No previously known HD 212 ref -
Previously known HD without prosthetic valve 107 0.823 0.505-1.343
Prosthetic valve 91 1.180 0.738-1.887
Previous IE 0.193
No 382 ref -
Yes 28 0.515 0.190-1.400
Cardiac implantable electronic device 0.507
No 351 ref -
Yes 59 1.193 0.709-2.008
M. Collonnaz, M.-L. Erpelding and F. Alla et al. / Dat a in Brief 33 (2020) 10 6 4 7 8 Table 6 ( continued ) Pooled (NTT + T) group (N = 410)
Crude association Adjusted association + Adjusted association ∗
n HR 95% CI p HR 95% CI p HR 95% CI p
IE profile
Clinical characteristics
Suspected source of infection 0.039
Community 304 ref -
Healthcare-related, acquired in hospital 95 1.581 1.031-2.422 Healthcare-related, not acquired in hospital 11 2.239 0.902-5.558
Left heart endocarditis 0.324
No 82 ref - Yes 328 1.300 0.772-2.188 Fever 0.520 No 55 ref - Yes 355 1.219 0.667-2.226 Heart failure ∗∗∗ 0.006 0.081 No 266 ref - ref - Yes 144 1.006 1.002-1.011 1.004 1.0 0 0-1.0 08 Microbiological characteristics Staphylococcal IE < 0.001 0.020 0.017
No 263 ref - ref - ref -
Yes 147 2.225 1.508-3.283 1.618 1.079-2.426 1.633 1.092-2.443 Echocardiographic characteristics Vegetation 0.729 No vegetation 52 ref - ≤15mm 176 1.153 0.594-2.235 > 15mm 106 1.413 0.708-2.820 Unknown size of vegetation 76 1.131 0.534-2.394
Perforation 0.118 0.038
No 330 ref - ref -
Yes 80 0.638 0.363-1.121 0.543 0.305-0.966
M. Collonnaz, M.-L. Erpelding and F. Alla et al. / Dat a in Brief 33 (2020) 10 6 4 7 8 Table 6 ( continued ) Pooled (NTT + T) group (N = 410)
Crude association Adjusted association + Adjusted association ∗
n HR 95% CI p HR 95% CI p HR 95% CI p IE complications Cardiac abscess ∗∗ 0.132 No 315 ref - Yes 95 1.469 0.891-2.422 Septic shock ∗∗ < 0.001 < 0.001 < 0.001
No 345 ref - ref - ref -
Yes 65 4.086 2.679-6.233 2.847 1.754-4.621 2.766 1.721-4.445
Cerebral haemorrhage ∗∗ 0.003
No 381 ref -
Yes 29 2.494 1.364-4.558
Cerebral embolism ∗∗ < 0.001 < 0.001 < 0.001
No 321 ref - ref - ref -
Yes 89 2.336 1.536-3.555 2.499 1.581-3.949 2.551 1.615-4.029 Vascular phenomena ∗∗∗ 0.168 No 214 ref - Yes 196 0.997 0.993-1.001 Immunologic phenomena 0.810 No 359 ref - Yes 51 0.929 0.509-1.697
Persistent sepsis despite treatment 0.171
No 364 ref -
Yes 46 1.466 0.848-2.536
Serum creatinine level ≥180 μmol/L < 0.001 < 0.001 < 0.001
No 291 ref - ref - ref -
Yes 119 4.113 2.776-6.095 3.085 2.053-4.634 3.055 2.031-4.594
Crude and adjusted Cox regressions were performed.
∗Stepwise selection, sle = 0.20, sls = 0.05
+ Covariates resulting from the selection process in the whole sample were forced into the model ∗∗Time dependent covariate
M. Collonnaz, M.-L. Erpelding and F. Alla et al. / Dat a in Brief 33 (2020) 10 6 4 7 8
M. Collonnaz, M.-L. Erpelding and F. Alla et al. / Dat a in Brief 33 (2020) 10 6 4 7 8
M. Collonnaz, M.-L. Erpelding and F. Alla et al. / Dat a in Brief 33 (2020) 10 6 4 7 8
M. Collonnaz, M.-L. Erpelding and F. Alla et al. / Data in Brief 33 (2020) 106478 25
2.
Experimental
Design,
Materials
and
Methods
2.1.
The
EI
2008
cohort
2.1.1.
Background
We
used
data
from
EI
2008
,
a
one-year
prospective,
population
based,
cohort
study
of
pa-tients
with
IE
[2]
.
Inclusion
criteria
in
EI
2008
were:
being
over
18
years
old,
living
in
one
of
the
seven
participating
French
administrative
areas
(greater
Paris,
Lorraine,
Rhône-Alpes,
Franche-Comté,
Marne,
Ille-et-Villaine
and
Languedoc-
Roussillon),
and
being
admitted
to
hospital
for
IE
between
January
1st
2008
and
December
31
st2008.
Diagnosis
of
IE
was
adjudicated
by
a
team
of
infectious
diseases
professionals.
Definite
cases
of
IE
(Duke
criteria
modified
by
Li
[3]
)
were
included
in
the
cohort.
Patients
were
followed
during
one
year
after
inclusion.
Baseline
and
follow-up
data
were
collected
on
a
standardised
case
report
form
by
trained
clinical
research
as-sistants.
Information
on
patients’
characteristics,
IE
profiles,
treatment
and
complications
were
retrieved
from
hospital
medical
records.
Vital
status
was
assessed
from
hospital
medical
records,
general
practitioners’
records
or
civil
registry
office
1
year
after
inclusion,
and
date
of
death
was
collected
when
appropriate.
All
the
patients
enrolled
in
the
EI
2008
cohort
(497
patients
with
a
definite
diagnosis
of
IE)
were
considered
for
our
analyses.
2.1.2.
Data
collection
Patients
were
divided
into
three
groups:
patients
admitted
to
a
tertiary
hospital
(group
T),
patients
admitted
to
a
non-tertiary
hospital
and
secondarily
referred
to
a
tertiary
hospital
(group
NTT),
and
patients
admitted
to
a
non-tertiary
hospital
and
not
secondarily
referred
to
a
tertiary
hospital
(group
NT).
Baseline
data
consisted
of
sociodemographic
characteristics
(age
≥70,
sex)
and
medical
his-tory
data
(Charlson
comorbidity
index
≥2,
high
blood
pressure,
injection
drug
use,
underlying
heart
disease,
previous
IE
and
implantable
cardiac
device).
Data
on
IE
profile
and
IE
complica-tions
were
collected
during
follow-up
in
hospital
stay.
IE
profile
data
included
clinical
character-istics
(suspected
source
of
infection,
left
heart
endocarditis,
fever
and
heart
failure),
microbio-logical
characteristics
(Staphylococcal
IE),
and
echocardiographic
characteristics
(vegetation
and
perforation).
IE
complications
data
consisted
of
cardiac
abscess,
septic
shock,
cerebral
haemor-rhage,
cerebral
embolism,
vascular
phenomena,
immunologic
phenomena,
persistent
sepsis
de-spite
treatment,
and
serum
creatinine
level
≥180
μmol/L.
2.2.
Secondary
analysis
of
EI
2008
data
2.2.1.
Aim
of
the
study
We
used
data
from
the
EI
2008
cohort
to
provide
a
comprehensive
characterisation
of
referral
bias
[1]
.
Referral
bias
is
a
type
of
selection
bias
that
can
occur
in
studies
recruiting
patients
in
tertiary
hospitals
only
(mixing
patients
admitted
directly
to
tertiary
hospitals
and
those
referred
secondarily
to
tertiary
hospitals,
but
excluding
patients
admitted
to
non-tertiary
hospitals
and
not
referred).
Studies
on
rare
diseases
such
as
infective
endocarditis
are
particularly
prone
to
referral
bias
[4–6]
,
a
bias
which
may
threaten
the
validity
of
prognostic
studies’
results
[7]
.
2.2.2.
Data
analyses
The
whole
sample
(pooled
(NT
+
NTT
+
T)
group)
represented
a
population-based
recruitment
of
patients
with
IE.
The
pooled
(NTT
+
T)
group
was
used
to
mimic
prognostic
studies
recruiting
patients
in
tertiary
hospitals.
Two
different
starting
points
were
considered
for
the
follow-up:
inclusion
(corresponding
to
the
date
of
first
hospital
admission)
and
referral
time
(corresponding
to
the
date
of
first
admis-based
on
patients
recruited
in
tertiary
hospitals
only).
Survival
time
was
calculated
from
the
starting
point
to
the
date
of
death
or
to
the
date
of
last
follow-up.
All
variables
mentioned
in
data
collection
were
evaluated
for
their
potential
prognostic
im-pact.
Patients
with
missing
data
for
at
least
one
of
these
potential
prognostic
factors
were
ex-cluded
from
analyses
(after
checking
that
the
characteristics
of
excluded
patients
did
not
differ
significantly
from
those
of
included
patients).
One
patient
(patient
number
560)
was
excluded
from
analyses
due
to
a
negative
delay
between
hospital
admission
and
septic
shock
(covariate
introduced
in
Cox
analyses
as
a
time-dependent
covariate).
As
a
result,
a
total
of
466
patients
with
infective
endocarditis
were
included
in
the
Cox
analyses
(274
in
group
T
(58,8%),
136
in
group
NTT
(29,2%)
and
56
in
group
NT
(12,0%)).
Data
presented
in
tables
1
to
6
were
obtained
through
crude
and
adjusted
Cox
modelling
of
3-month
and
1-year
survival
from
IE.
For
both
3-months
and
1-year
survival,
analyses
were
performed
in
five
steps:
1/
In
the
pooled
(NT
+
NTT
+
T)
group,
i.e.
a
population-based
sample,
using
inclusion
as
the
starting
point,
a
stepwise
selection
(with
a
significance
level
for
entry
(sle)
set
at
0.20
and
a
significance
level
for
staying
in
the
model
(sls)
set
at
0.05)
was
performed
to
identify
prognostic
factors
2/
In
the
pooled
(NTT
+
T),
using
inclusion
as
the
starting
point,
covariates
identified
as
prog-nostic
factors
in
Step
1
were
forced
into
the
multivariable
model
to
identify
an
eventual
difference
in
significance
or
in
the
magnitude
of
HRs
3/
In
the
pooled
(NTT
+
T)
group,
using
inclusion
as
the
starting
point,
a
stepwise
selection
(sle
=
0.20
and
sls
=
0.05)
was
performed
to
naively
identify
prognostic
factors
4/
In
the
pooled
(NTT
+
T)
group,
using
referral
time
as
the
starting
point,
covariates
identified
as
prognostic
factors
in
Step
1
were
forced
into
the
multivariable
model
to
identify
an
eventual
difference
in
the
magnitude
or
significance
of
their
effect
5/
In
the
pooled
(NTT
+
T)
group,
using
referral
time
as
the
starting
point,
a
stepwise
selection
(sle
=
0.20
and
sls
=
0.05)
was
performed
to
identify
prognostic
factors
using
a
design
prone
to
referral
bias.
Cox
models
assumptions
(Log-linearity
assumption
and
proportional
hazard
assumption)
were
checked.
In
1-year
Cox
analyses,
high
blood
pressure,
Charlson
comorbidity
index,
heart
failure,
and
vascular
phenomena
did
not
meet
the
proportional
hazard
assumption
and
were
considered
as
time-varying
covariates
(covariate
∗time
interaction).
IE
complications
occurring
during
the
hospital
stay
(septic
shock,
cardiac
abscess,
cerebral
embolism,
and
cerebral
haem-orrhage)
were
introduced
in
the
models
as
time-dependent
covariates.
Statistical
analyses
were
performed
using
SAS
9.4
(SAS
Institute,
Inc.,
Cary,
NC)
software.
Ethics
Statement
EI
2008
was
conducted
in
accordance
with
the
Declaration
of
Helsinki.
Patients
were
in-formed
of
the
study
but
their
written
individual
consent
was
not
required.
EI
2008
was
au-thorized
by
the
Commission
Nationale
de
l’Informatique
et
des
Libertés
(CNIL-DR-2010-219)
and
registered
in
ClinicalTrials.gov
(NCT03295045).
Declaration
of
Competing
Interest
The
authors
declare
that
they
have
no
known
competing
financial
interests
or
personal
rela-tionships
which
have,
or
could
be
perceived
to
have,
influenced
the
work
reported
in
this
article.
Data
Availability
M. Collonnaz, M.-L. Erpelding and F. Alla et al. / Data in Brief 33 (2020) 106478 27
Acknowledgments
We
thank
all
contributors
of
the
AEPEI
Study
Group
on
Infective
Endocarditis.
References
[1] M Collonnaz, M-L Erpelding, F Alla, F Goehringer, F Delahaye, B Iung, et al., Impact of referral bias on prognostic studies outcomes: insights from a population-based cohort study on infective endocarditis, Ann. Epidemiol. [Internet] (2020 Sep) Available from: https://doi.org/10.1016/j.annepidem.2020.09.008 .
[2] C Selton-Suty , M Célard , V Le Moing , T Doco-Lecompte , C Chirouze , B Iung , et al. , Preeminence of Staphylococcus aureus in infective endocarditis: a 1-year population-based survey, Clin Infect Dis 54 (May(9)) (2012) 1230–1239 . [3] JS Li , DJ Sexton , N Mick , R Nettles , VG Fowler , T Ryan , et al. , Proposed modifications to the Duke criteria for the
diagnosis of infective endocarditis, Clin Infect Dis 30 (April(4)) (20 0 0) 633–638 .
[4] JM Steckelberg , MS Rouse , WR Wilson , LJ Melton , DM Ilstrup , Influence of referral bias on the apparent clinical spectrum of infective endocarditis, Am. J. Med. 88 (Jun 1(6)) (1990) 582–588 .
[5] N Fernández-Hidalgo , B Almirante , P Tornos , MT González-Alujas , AM Planes , MN Larrosa , et al. , Prognosis of left- -sided infective endocarditis in patients transferred to a tertiary-care hospital—prospective analysis of referral bias and influence of inadequate antimicrobial treatment, Clin. Microbiol. Infect. 17 (May 1(5)) (2011) 769–775 . [6] ZA Kanafani , SS Kanj , CH Cabell , E Cecchi , A de Oliveira Ramos , T Lejko-Zupanc , et al. , Revisiting the effect of re-
ferral bias on the clinical spectrum of infective endocarditis in adults, Eur J Clin Microbiol Infect Dis 29 (10) (2010) 1203–1210 .
[7] K Rothman , S Greenland , T Lash , Validity in epidemiologic studies, Modern Epidemiology, 3rd ed., Lippincott Williams and Wilkins;, 2008 .