HAL Id: hal-03207245
https://hal.archives-ouvertes.fr/hal-03207245
Submitted on 24 Apr 2021
HAL is a multi-disciplinary open access
archive for the deposit and dissemination of
sci-entific research documents, whether they are
pub-lished or not. The documents may come from
teaching and research institutions in France or
abroad, or from public or private research centers.
L’archive ouverte pluridisciplinaire HAL, est
destinée au dépôt et à la diffusion de documents
scientifiques de niveau recherche, publiés ou non,
émanant des établissements d’enseignement et de
recherche français ou étrangers, des laboratoires
publics ou privés.
remote oceans, based on data from the Maritime
Aerosol Network
A. Smirnov, A. Sayer, B. Holben, N. Hsu, S. Sakerin, A. Macke, N. Nelson, Y.
Courcoux, T. Smyth, P. Croot, et al.
To cite this version:
A. Smirnov, A. Sayer, B. Holben, N. Hsu, S. Sakerin, et al.. Effect of wind speed on aerosol optical
depth over remote oceans, based on data from the Maritime Aerosol Network. Atmospheric
Measure-ment Techniques, European Geosciences Union, 2012, 5 (2), pp.377-388. �10.5194/amt-5-377-2012�.
�hal-03207245�
Atmos. Meas. Tech., 5, 377–388, 2012 www.atmos-meas-tech.net/5/377/2012/ doi:10.5194/amt-5-377-2012
© Author(s) 2012. CC Attribution 3.0 License.
Atmospheric
Measurement
Techniques
Effect of wind speed on aerosol optical depth over remote oceans,
based on data from the Maritime Aerosol Network
A. Smirnov1,2, A. M. Sayer2,3, B. N. Holben2, N. C. Hsu2, S. M. Sakerin4, A. Macke5, N. B. Nelson6, Y. Courcoux7, T. J. Smyth8, P. Croot9, P. K. Quinn10, J. Sciare11, S. K. Gulev12, S. Piketh13, R. Losno14, S. Kinne15, and
V. F. Radionov16
1Sigma Space Corporation, Lanham, Maryland, USA
2NASA Goddard Space Flight Center, Greenbelt, Maryland, USA
3Goddard Earth Science Technology and Research – GESTAR, Columbia, Maryland, USA 4Institute of Atmospheric Optics, Tomsk, Russia
5Leibniz Institute for Tropospheric Research, Leipzig, Germany 6University of California, Santa Barbara, California, USA 7Universit´e de la R´eunion, Saint Denis de la R´eunion, France 8Plymouth Marine Laboratory, Plymouth, UK
9Leibniz Institute of Marine Sciences, Kiel, Germany 10NOAA PMEL, Seattle, Washington, USA
11Laboratoire des Sciences du Climat et de l’Environnement, Gif-sur-Yvette, France 12P. P. Shirshov Institute of Oceanology, Moscow, Russia
13University of the Witwatersrand, Johannesburg, South Africa 14Universit´e de Paris7 et Universit´e de Paris 12, Creteil, France
15Institute for Meteorology, University of Hamburg, Hamburg, Germany 16Arctic and Antarctic Research Institute, Saint Petersburg, Russia
Correspondence to: A. Smirnov (alexander.smirnov-1@nasa.gov)
Received: 22 November 2011 – Published in Atmos. Meas. Tech. Discuss.: 5 December 2011 Revised: 3 February 2012 – Accepted: 6 February 2012 – Published: 17 February 2012
Abstract. The Maritime Aerosol Network (MAN) has been
collecting data over the oceans since November 2006. The MAN archive provides a valuable resource for aerosol stud-ies in maritime environments. In the current paper we inves-tigate correlations between ship-borne aerosol optical depth (AOD) and near-surface wind speed, either measured (on-board or from satellite) or modeled (NCEP). According to our analysis, wind speed influences columnar aerosol optical depth, although the slope of the linear regression between AOD and wind speed is not steep (∼0.004–0.005), even for strong winds over 10 m s−1. The relationships show signif-icant scatter (correlation coefficients typically in the range 0.3–0.5); the majority of this scatter can be explained by the uncertainty on the input data. The various wind speed sources considered yield similar patterns. Results are in good agreement with the majority of previously published relationships between surface wind speed and ship-based or
satellite-based AOD measurements. The basic relationships are similar for all the wind speed sources considered; how-ever, the gradient of the relationship varies by around a factor of two depending on the wind data used.
1 Introduction
The World Ocean is the largest source of natural aerosol. Accurate estimation of sea-spray aerosol production, evolu-tion and removal processes is important for understanding the Earth’s radiation budget, aerosol-cloud interactions, and visibility changes (Latham and Smith, 1990; O’Dowd et al., 1999; Haywood et al., 1999; de Leeuw et al., 2000). The wind speed is the major driver behind the production of nat-ural marine aerosol (Lewis and Schwartz, 2004). The ma-rine aerosol concentration and size distribution are strongly
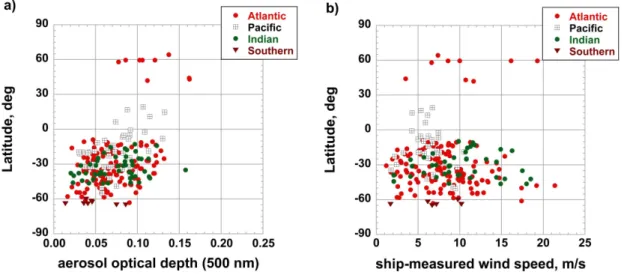
Fig. 1. Latitudinal dependence of AOD series acquired at least 200 km from the nearest landmass (a), and AOD dependence on ship-based wind speed (b) during the February–April 2008 cruise of the R/V Polarstern.
dependent on wind speed (Blanchard and Woodcock, 1980; Gathman, 1982; Lovett, 1978), however, the dependence of columnar aerosol optical depth (AOD) on wind speed is more difficult to detect and quantify, because of scores of differ-ent factors influencing AOD (Smirnov et al., 1995). Estab-lishing correct relationships between AOD and near-surface wind speed will help tune global aerosol transport models (Jaegle et al., 2011; Madry et al., 2011; Fan and Toon, 2011), atmospheric correction in ocean-color studies (Zibordi et al., 2011), validate AODs retrieved from satellite measurements (Kahn et al., 2010; Kleidman et al., 2012), and understand biogeochemical cycles (Meskhidze and Nenes, 2010).
Recently an increased interest in aerosol optical depth over the oceans and its dependence on wind speed manifested itself in a number of publications. Satellite-derived and coast or island acquired AODs have been studied by Mulc-ahy et al. (2008), Glantz et al. (2009), Lehahn et al. (2010), Huang et al. (2010), O’Dowd et al. (2010), Kiliyanpilakkil and Meskhidze (2011), Grandey et al. (2011), Adames et al. (2011), and Sayer et al. (2012). Power-law and linear rela-tionships between AOD and wind speed were established al-though sampling issues, uncertainties in retrieval algorithms, and/or influence of the chosen island locations gave an indi-cation that the problem is far from being solved and there is not yet consensus.
Satellite-based measurements are undoubtedly the only tool (at least at present) for global aerosol optical depth cov-erage. However because of existing satellite retrieval biases (Smirnov et al., 2006, 2011) the ground (ocean)-based truth is needed to correct or constrain them. For example, in the southern latitudes (south of 40◦) the sunphotometer AODs are low compared with satellite retrievals (Smirnov et al., 2006, 2011). This discrepancy can be explained, at least
partly, by uncertainties in foam formation and its latitudinal distribution (Anguelova and Webster, 2006), by a process of quality control that excludes some residual cloud contami-nation (Zhang and Reid, 2010), by the accuracy of radiative transfer models used (Melin et al., 2010), and by more ac-curate accounting for surface reflectance effects in satellite retrievals (Sayer et al., 2010).
Therefore it is useful to utilize the available archive of ship-based AOD measurements over the oceans ac-quired within the framework of Maritime Aerosol Network (Smirnov et al., 2009), and analyze AOD in conjunction with information on near-surface wind speed from vari-ous sources: measured onboard, simulated by the National Center for Environmental Prediction (NCEP), and estimated from measurements taken by the Advanced Microwave Scan-ning Radiometer (AMSR-E) aboard Aqua satellite.
2 Data sets used in this study
MAN accumulated more than 2500 days of ship-based AOD measurements over a period of several years (Smirnov et al., 2009, 2011). MAN deploys hand held Microtops II sun-photometers (Morys et al., 2001) and utilizes calibration and data processing procedures traceable to AERONET (Holben et al., 1998, 2001). The estimated uncertainty of the opti-cal depth in each channel does not exceed ±0.02 (Knobel-spiesse et al., 2004), primarily due to inter-calibration against AERONET reference CIMEL instruments that are accurate to within ∼0.01 in the visible and near-infrared (Eck et al., 1999). Thus MAN provides high-quality AODs with known uncertainty. A public domain web-based archive dedicated
A. Smirnov et al.: Effect of wind speed on aerosol optical depth over remote oceans 379
Fig. 2. Latitudinal dependence of AOD daily averages used in this study (a), and latitudinal dependence of corresponding daily averaged ship-based wind speed (b).
Fig. 3. Differences between NCEP and ship-based wind speed as a function of ship-based wind speed (a) and wind speed frequency of occurrences (%) for each subset (b).
to the network activity can be found at: http://aeronet.gsfc. nasa.gov/new web/maritime aerosol network.html.
The ship-based meteorological data collected onboard were provided by the cruise PIs. Meteorological measure-ments were made with the standard equipment at least hourly. Then linear interpolation was applied to match in time sun-photometer measurements.
The National Center for Environmental Prediction (NCEP) wind speed data used was 1◦by 1◦horizontal reso-lution output every 6 h (Derber et al., 1991). In our analysis, for each measured AOD the NCEP near-surface (10 m) wind speed data points were linearly interpolated in space and time to provide the “instantaneous” wind speed. Repeating
this procedure backwards in time, we additionally computed wind speeds averaged over the 24 h period prior to each AOD measurement.
The Advanced Microwave Scanning Radiometer-Earth Observing System (AMSR-E) instrument on the NASA Earth Observing System (EOS) Aqua satellite provides near-surface wind speed (Wentz and Meissner, 2007). These data are provided at a spatial resolution of 25 km, sepa-rately for daytime and nighttime overpasses. In this study, the data point which the MAN measurement lies within was used. Because the AMSR-E sampling is spatially incom-plete, some MAN data lacked a corresponding AMSR-E wind speed retrieval.
Fig. 4. Scatter density histograms of AOD at 500 nm (series) (a–e) and Angstrom parameter (f) versus the surface wind speed.
The influence of wind speed on AOD in the whole atmo-spheric column is a very difficult problem. A link between optical turbidity and particle generation by wind is not easy to detect, since it can be masked by the background aerosol (of continental origin in coastal areas, for example). Accord-ingly, surface generation effects can be clearly noticed only when measurements are taken in a reasonably transparent at-mosphere. Ideally a relationship between spectral aerosol optical depth and wind speed needs to be ascertained in the same air mass in order to minimize the influence of other meteorological parameters on optical properties, or when
all meteorological parameters are simply the same over the range of wind speeds considered. Discriminating between air masses permits a more rigorous analysis of the link be-tween wind speed and optical depth (Smirnov et al., 1995). The correlations between AOD and wind speed in maritime tropical air masses were found to be significantly larger than those obtained in a study of the same Pacific Ocean data (Villevalde et al., 1994), where no air mass discrimination was made. This means that the correlation coefficient in-creased when the data were characterized by more uniform atmospheric conditions.
A. Smirnov et al.: Effect of wind speed on aerosol optical depth over remote oceans 381
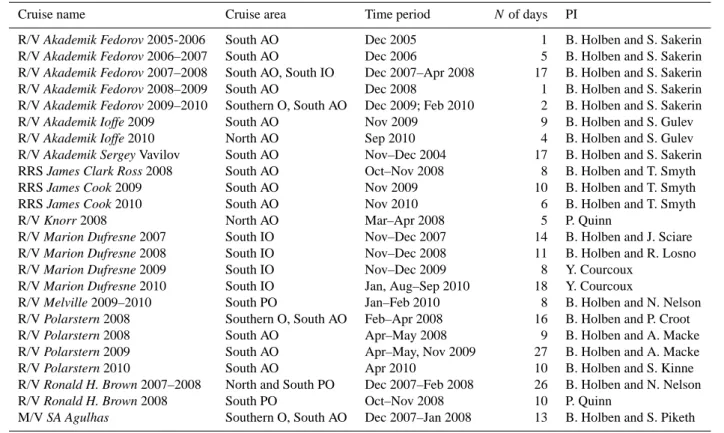
Table 1. List of cruises, cruise areas, and number of measurement days used in our analysis.
Cruise name Cruise area Time period Nof days PI
R/V Akademik Fedorov 2005-2006 South AO Dec 2005 1 B. Holben and S. Sakerin R/V Akademik Fedorov 2006–2007 South AO Dec 2006 5 B. Holben and S. Sakerin R/V Akademik Fedorov 2007–2008 South AO, South IO Dec 2007–Apr 2008 17 B. Holben and S. Sakerin R/V Akademik Fedorov 2008–2009 South AO Dec 2008 1 B. Holben and S. Sakerin R/V Akademik Fedorov 2009–2010 Southern O, South AO Dec 2009; Feb 2010 2 B. Holben and S. Sakerin R/V Akademik Ioffe 2009 South AO Nov 2009 9 B. Holben and S. Gulev R/V Akademik Ioffe 2010 North AO Sep 2010 4 B. Holben and S. Gulev R/V Akademik Sergey Vavilov South AO Nov–Dec 2004 17 B. Holben and S. Sakerin RRS James Clark Ross 2008 South AO Oct–Nov 2008 8 B. Holben and T. Smyth RRS James Cook 2009 South AO Nov 2009 10 B. Holben and T. Smyth RRS James Cook 2010 South AO Nov 2010 6 B. Holben and T. Smyth
R/V Knorr 2008 North AO Mar–Apr 2008 5 P. Quinn
R/V Marion Dufresne 2007 South IO Nov–Dec 2007 14 B. Holben and J. Sciare R/V Marion Dufresne 2008 South IO Nov–Dec 2008 11 B. Holben and R. Losno R/V Marion Dufresne 2009 South IO Nov–Dec 2009 8 Y. Courcoux
R/V Marion Dufresne 2010 South IO Jan, Aug–Sep 2010 18 Y. Courcoux
R/V Melville 2009–2010 South PO Jan–Feb 2010 8 B. Holben and N. Nelson R/V Polarstern 2008 Southern O, South AO Feb–Apr 2008 16 B. Holben and P. Croot R/V Polarstern 2008 South AO Apr–May 2008 9 B. Holben and A. Macke R/V Polarstern 2009 South AO Apr–May, Nov 2009 27 B. Holben and A. Macke R/V Polarstern 2010 South AO Apr 2010 10 B. Holben and S. Kinne R/V Ronald H. Brown 2007–2008 North and South PO Dec 2007–Feb 2008 26 B. Holben and N. Nelson R/V Ronald H. Brown 2008 South PO Oct–Nov 2008 10 P. Quinn
M/V SA Agulhas Southern O, South AO Dec 2007–Jan 2008 13 B. Holben and S. Piketh
In other words, the relationship between AOD and wind speed depends on many factors we simply do not know or cannot fully account for (at least empirically). A good exam-ple is presented in Fig. 1a and b. The R/V Polarstern cruise considered took place in the winter of 2008 in the South Atlantic and Southern Ocean (Dr. Peter Croot was a PI for AOD measurements). Figure 1a shows the latitudinal depen-dence of AOD series (a series can have one or more mea-surements points, typically five or more, made with a gap of under 2 min; see Smirnov et al., 2009 for details) acquired at least 200 km from the nearest landmass, and Fig. 1b presents a dependence on ship-based wind speed. It is clear that there is no obvious relationship between AOD and wind speed for the subset considered. AODs are quite low while the wind speed ranges from 3 to 14 m s−1. Additional consideration
of the subset acquired within 39◦–65◦S did not produce any correlation either.
Therefore in our analysis we decided to deploy the follow-ing strategy. Because all factors influencfollow-ing the dependence of AOD on wind speed cannot be accounted for, we sim-ply considered only data presumably not influenced by ur-ban/industrial continental sources, dust outbreaks, biomass burning, or glaciers and pack ice. In the Northern Atlantic we limited the area to the latitudinal belt between 40◦–60◦N; in the Southern Atlantic we considered data acquired to the South of 10◦S; in the Indian Ocean data set included only
A. Smirnov et al.: Effect of wind speed on aerosol optical depth over remote oceans 383
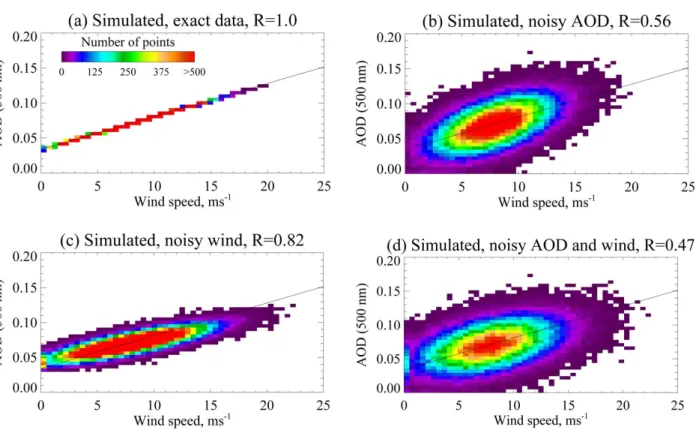
Fig. 7. Scatter density histogram between simulated noise-free wind speed and noise-free AOD (a), noisy AOD and noise-free wind speed (b), noisy wind speed and noise-free AOD (c) and noisy wind speeds and noisy AOD at 500 nm (d). Points were generated assuming the steady-state relationship in Table 3, τa(500 nm) = 0.0047 × w + 0.034 (shown in black), and then adding Gaussian noise of amplitude 2 m s−1to the
winds and 0.02 to the AOD.
cruises South of 9◦S. An additional restriction imposed on the data set was exclusion of points taken closer than two de-grees from the nearest landmass. Among the selected cruises, we excluded one (presented in Fig. 1), which showed no relationship between AOD and wind speed. For any other individual cruise considered, the slope of the AOD scatter-plot versus wind speed was found to be at least 0.002 s m−1. This “cherry-picking” is justified by the ultimate goal of find-ing the most robust possible dependence of AOD on wind speed over the oceans. Table 1 presents final dataset used for our analysis. Overall we considered 239 measurement days. Figure 2a shows AOD daily averages as a function of lati-tude, and Fig. 2b presents corresponding daily averages of the ship-based wind speed.
The NCEP wind speed data were interpolated in space and time to match the AOD measurement series. In addi-tion to the “instantaneous” wind speeds (wind speeds at the times matching the AOD series), we used wind speeds aver-aged over the 24 h prior to each AOD measurement, and also the subset of “steady-state” wind speeds (defined similar to Madry et al., 2011, i.e., standard deviation for the daily aver-aged wind speed should not exceed 2 m s−1for wind speeds less than 10 m s−1, or 3 m s−1for wind speeds greater than 10 m s−1). NCEP data were compared with the ship-based meteorological information for cruises considered, and this
is presented in Fig. 3a. The relative negative offset of NCEP is evident, although it is not critical for our study. About 66 % of the differences are within 2 m s−1. The “series” and “daily” wind speed differences are comparable. Figure 3b shows histograms of wind speeds used in our further anal-ysis. High winds (greater than 10 m s−1) account for over
20 % in each subset considered.
3 Results
Figures 4 and 5, and Table 2, illustrate regressions between aerosol optical depth, Angstrom parameter (negative of the logarithmic gradient of AOD with wavelength, over the vis-ible spectrum) and wind speed. More than 1100 series from 239 days of aerosol optical depth measurements contributed to the statistics presented. Overall we can conclude that the relationship between AOD and wind speed is linear, but cor-relations are not strong (non-linear cor-relationships were con-sidered, but did not result in stronger correlations). Even for the case of “steady-state” winds, correlations coefficients do not increase significantly. These values, although not high, are statistically significant at a 99 % confidence level. Re-sults obtained for the “daily” and “series” datasets are com-parable. Averaging AOD over a day removes some noise,
Table 2. Regression statistics of spectral optical parameters versus wind speed.
Relationship Data source a b R∗ Data source a b R∗
τa(440 nm) = a × w(ship)+ b series 0.0020 0.062 0.23 daily average 0.0022 0.061 0.29
τa(500 nm) = a × w(ship)+ b 0.0023 0.052 0.28 0.0024 0.052 0.33
τa(675 nm) = a × w(ship)+ b 0.0029 0.038 0.38 0.0031 0.035 0.47
τa(870 nm) = a × w(ship)+ b 0.0027 0.039 0.37 0.0030 0.037 0.46
τa(440 nm) = a × w(NCEP)+ b series 0.0034 0.052 0.31 daily average 0.0035 0.052 0.35
τa(500 nm) = a × w(NCEP)+ b 0.0037 0.044 0.35 0.0036 0.045 0.39
τa(675 nm) = a × w(NCEP)+ b 0.0043 0.029 0.44 0.0043 0.028 0.50
τa(870 nm) = a × w(NCEP)+ b 0.0042 0.030 0.45 0.0043 0.028 0.52
τa(440 nm) = a × w(<24h>,NCEP)+ b series 0.0042 0.044 0.35 daily average 0.0040 0.047 0.38
τa(500 nm) = a × w(<24h>,NCEP)+ b 0.0043 0.037 0.39 0.0041 0.039 0.41
τa(675 nm) = a × w(<24h>,NCEP)+ b 0.0049 0.023 0.47 0.0048 0.022 0.53
τa(870 nm) = a × w(<24h>,NCEP)+ b 0.0049 0.023 0.48 0.0049 0.022 0.55
τa(440 nm) = a × w(steady−state,NCEP)+ b series 0.0045 0041 0.40 daily average 0.0044 0.042 0.44
τa(500 nm) = a × w(steady−state,NCEP)+ b 0.0047 0.034 0.43 0.0045 0.035 0.47
τa(675 nm) = a × w(steady−state,NCEP)+ b 0.0052 0.021 0.50 0.0051 0.019 0.56
τa(870 nm) = a × w(steady−state,NCEP)+ b 0.0051 0.021 0.51 0.0052 0.019 0.58
τa(440 nm) = a × w(AMSR)+ b series 0.0033 0.056 0.28 daily average 0.0040 0.050 0.38
τa(500 nm) = a × w(AMSR)+ b 0.0036 0.047 0.33 0.0040 0.043 0.40
τa(675 nm) = a × w(AMSR)+ b 0.0041 0.034 0.40 0.0046 0.028 0.50
τa(870 nm) = a × w(AMSR)+ b 0.0036 0.038 0.37 0.0045 0.029 0.50
α= a × w(ship)+ b series −0.036 0.706 0.35 daily average −0.035 0.732 0.36
α= a × w(NCEP)+ b −0.051 0.789 0.39 −0.048 0.813 0.38
α= a × w(<24h>,NCEP)+ b −0.059 0.867 0.41 −0.054 0.875 0.41
α= a × w(steady−state,NCEP)+ b −0.059 0.863 0.42 −0.053 0.864 0.40
α= a × w(AMSR)+ b −0.038 0.648 0.31 −0.042 0.747 0.34
∗R– is a linear correlation coefficient.
associated in part with uncertainties in the AOD and wind speed, and in part with natural variability, and makes corre-lation coefficients slightly higher (by less than 0.1). Various wind data sources and wind speed subsets yielded very simi-lar results. As expected Angstrom parameter decreases with wind speed. An influx of large particles is responsible, at least in part, for this anticorrelation.
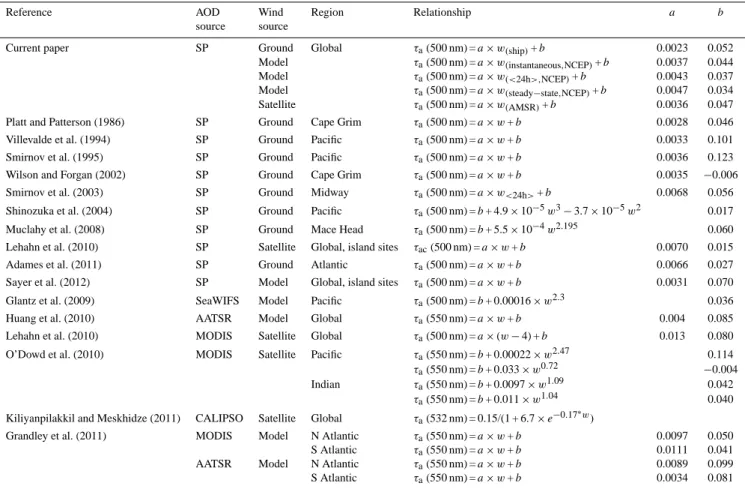
The slope of the linear regression of AOD versus wind speed lies in the range 0.002–0.005 for the various wavelengths, cruises, and wind datasets considered. As ex-pected (because the wind speed’s history is important) the dataset that uses wind speed averaged within previous 24 h period and “steady-state” wind dataset yielded higher slopes. Table 3 presents regression statistics compiled from vari-ous publications. Our results are consistent with the major-ity of previously reported results for ship-based and island-based measurements, although being different from Mulc-ahy et al. (2008). We would like to note that additional consideration of stricter “steady-state” wind conditions (with standard deviation less than 1 m s−1 within previous 24 h) did not change the slope at 500 nm, but slightly increased it to 0.0058 at 870 nm. Some of the satellite-derived AODs yielded steeper slopes, although we believe these to be an ar-tifact of the satellite-derived AOD overestimation (Smirnov et al., 2006, 2011).
In Fig. 6 the relationship between AOD and NCEP wind averaged within previous 24 h (“current study”) is compared to other studies. The diversity between different relation-ships established in the literature is evident. However, over the range 0–10 m s−1, the typical change in AOD is
simi-lar in most parameterizations (∼0.04 at 500 nm), and consis-tent with the ship-borne measurements from this study. The main differences between studies are linked to the baseline AOD for low-wind conditions, and some nonlinearities at high wind speeds. In the former case, this may be partially explained by local aerosol sources or satellite retrieval bi-ases, specific to each individual study’s dataset. In the latter case, this may often be linked to a paucity of data for high wind speeds, such that the determination of the form of the relationship is less well-defined (although as mentioned pre-viously, over 20 % of the MAN AODs are for wind speeds of 10 m s−1or greater). Further, data from coastal sites may be more strongly affected by enhanced foam from breaking waves at high wind speeds, and satellite biases (Sayer et al., 2010; Smirnov et al., 2006, 2011) may be more extreme in such cases. These effects would not be expected to influence the MAN AODs in the same way.
To investigate the extent to which uncertainties in the AOD and wind speed contribute to the low correlations, a numer-ical simulation was performed, based on the “steady-state”
A. Smirnov et al.: Effect of wind speed on aerosol optical depth over remote oceans 385
Table 3. Regression statistics of aerosol optical depth versus wind speed.
Reference AOD Wind Region Relationship a b
source source
Current paper SP Ground Global τa(500 nm) = a × w(ship)+ b 0.0023 0.052
Model τa(500 nm) = a × w(instantaneous,NCEP)+ b 0.0037 0.044
Model τa(500 nm) = a × w(<24h>,NCEP)+ b 0.0043 0.037
Model τa(500 nm) = a × w(steady−state,NCEP)+ b 0.0047 0.034
Satellite τa(500 nm) = a × w(AMSR)+ b 0.0036 0.047
Platt and Patterson (1986) SP Ground Cape Grim τa(500 nm) = a × w + b 0.0028 0.046
Villevalde et al. (1994) SP Ground Pacific τa(500 nm) = a × w + b 0.0033 0.101
Smirnov et al. (1995) SP Ground Pacific τa(500 nm) = a × w + b 0.0036 0.123
Wilson and Forgan (2002) SP Ground Cape Grim τa(500 nm) = a × w + b 0.0035 −0.006
Smirnov et al. (2003) SP Ground Midway τa(500 nm) = a × w<24h>+ b 0.0068 0.056
Shinozuka et al. (2004) SP Ground Pacific τa(500 nm) = b + 4.9 × 10⁻⁵w3−3.7 × 10⁻⁵w2 0.017
Muclahy et al. (2008) SP Ground Mace Head τa(500 nm) = b + 5.5 × 10⁻⁴w2.195 0.060
Lehahn et al. (2010) SP Satellite Global, island sites τac(500 nm) = a × w + b 0.0070 0.015
Adames et al. (2011) SP Ground Atlantic τa(500 nm) = a × w + b 0.0066 0.027
Sayer et al. (2012) SP Model Global, island sites τa(500 nm) = a × w + b 0.0031 0.070
Glantz et al. (2009) SeaWIFS Model Pacific τa(500 nm) = b + 0.00016 × w2.3 0.036
Huang et al. (2010) AATSR Model Global τa(550 nm) = a × w + b 0.004 0.085
Lehahn et al. (2010) MODIS Satellite Global τa(500 nm) = a × (w − 4) + b 0.013 0.080
O’Dowd et al. (2010) MODIS Satellite Pacific τa(550 nm) = b + 0.00022 × w2.47 0.114
τa(550 nm) = b + 0.033 × w0.72 −0.004
Indian τa(550 nm) = b + 0.0097 × w1.09 0.042
τa(550 nm) = b + 0.011 × w1.04 0.040
Kiliyanpilakkil and Meskhidze (2011) CALIPSO Satellite Global τa(532 nm) = 0.15/(1 + 6.7 × e−0.17∗w)
Grandley et al. (2011) MODIS Model N Atlantic τa(550 nm) = a × w + b 0.0097 0.050
S Atlantic τa(550 nm) = a × w + b 0.0111 0.041
AATSR Model N Atlantic τa(550 nm) = a × w + b 0.0089 0.099
S Atlantic τa(550 nm) = a × w + b 0.0034 0.081
relationship in Table 3, τa (500 nm) = 0.0047 × w + 0.034.
First, a 50 000-member Gaussian distribution of wind speeds with mean 7.93 m s−1 and standard deviation 2.96 m s−1 (corresponding to the “steady-state” wind distribution in Fig. 3), with any resulting negative wind speeds removed, was generated. The sample size gives statistics robust to two significant figures. This was then used to calculate the AOD, assuming the aforementioned wind speed/AOD relationship was a perfect predictor.
Next, the wind and AOD distributions were perturbed by adding Gaussian noise (zero mean in both cases, standard deviation 2 m s−1for wind speed, and 0.02 for AOD). These uncertainties are reasonably representative of the uncertainty in the input data (e.g., Knobelspiesse et al., 2004, Wallcraft et al., 2009; Sayer et al., 2012). Perturbed negative wind speeds or AODs were then set to zero, as would likely be used as the minimum value to report in such an AOD or wind dataset.
The resulting distributions of data are shown in Fig. 7. Correlating the noisy wind speeds with the “true” simulated AODs give R = 0.82 (Fig. 7c); correlating true wind speeds with noisy AODs gives R = 0.56 (Fig. 7b); and correlating noisy wind speeds with noisy AODs gives R = 0.47 (Fig. 7d).
This last number is similar to the correlations observed in this study, suggesting the principle factor decreasing corre-lation from unity for the MAN and wind data studied here are uncertainties in the input data (rather than other meteoro-logical effects), and that the noise on the AOD is more criti-cal for this purpose. Halving the magnitude of the Gaussian noise used for the perturbations increases this last correlation to 0.76, indicating the effect of noise on the correlations could be much reduced with more precise input data.
Performing a linear least-squares fit to the perturbed noisy data gives the relationship τa(500 nm) = 0.0031 × w + 0.047,
i.e., an increase of the intercept and suppression of the gra-dient as compared to the true underlying relationship. This result is consistent with the observation from this study that with increasing levels of temporal averaging to decrease noise (instantaneous to daily or steady-state NCEP data), gra-dients become stronger and intercepts smaller, and suggests that use of only instantaneous data for such analyses will re-sult in an overestimate of the baseline maritime AOD, and underestimate of the response to changes in the wind speed.
4 Conclusions
Our analysis of the Maritime Aerosol Network data showed a linear relationship between aerosol optical depth over the oceans and wind speed for a wind speed range 0–15 m s−1. There is no indication of a non-linear power-law or expo-nential relationship between those quantities for any of the wind datasets (ship-based, NCEP, satellite-based) consid-ered. However, the gradient of the relationship varies by around a factor of two depending on the wind data used. This highlights that the derivation of such relationships is sensitive to not only the AOD data source, but also the wind data source, which may explain some of the variation shown within the literature.
Various wind speed subsets, instantaneous and daily aver-aged AODs yielded similar regression statistics which proves the robustness of our conclusions. It is noteworthy that, un-like in Smirnov et al. (2003) the wind speed range consid-ered here was significantly wider – up to 15 m s−1for NCEP and AMSR-E, and up to 20 m s−1for winds measured on the ship.
Our findings are consistent with the previously reported re-sults, only differing significantly from Mulcahy et al. (2008) and O’Dowd et al. (2010) for high wind speeds (>10 m s−1). However, we expect that the future release of the MODIS Collection 6, which takes near-surface wind speed into account when determining ocean surface reflectance, will change the conclusions reported by O’Dowd et al. (2010) in terms of reducing the wind-speed dependence in the re-trieved AOD (Mishchenko and Geogdzhayev, 2007; Kleid-man et al., 2012). The relationship by Mulcahy et al. (2008) overestimates aerosol optical depth, predicting AOD ∼ 0.27 at wind speed 15 m s−1, possibly due to the breaking waves
at the coastal site and only 14 measurement days contributing to the overall statistics.
As found in previous studies, there is considerable scat-ter in plots comparing AOD and wind speed, leading to cor-relations typically of order 0.3–0.5. Our results show that the known uncertainties in the AOD and wind data used would be sufficient to degrade the observed correlation be-tween variables, which were perfectly correlated in truth, to around 0.5. This noise also affected the coefficients of fit, de-creasing the gradient as compared with the “true” case. Thus, it is plausible that, over the remote ocean, the true strength of correlation between maritime AOD and wind speed, and the magnitude of the response, could be significantly stronger than observed in these studies.
Acknowledgements. The authors thank Hal Maring (NASA
Headquarters) for his support of AERONET. The authors thank Kirk Knobelspiesse (Columbia University and NASA GISS) and anonymous reviewer for constructive comments. Measurements onboard R/V Marion-Dufresne were supported by the French Polar Institute (IPEV). NCEP Reanalysis data provided by the NOAA/OAR/ESRL PSD, Boulder, Colorado, USA, from their Web site at http://www.esrl.noaa.gov/psd/. AMSR-E data are
produced by Remote Sensing Systems and sponsored by the NASA Earth Science MEaSUREs DISCOVER Project and the AMSR-E Science Team. Data are available at www.remss.com. Gert Konig-Langlo from Alfred Wegener Institute for Polar and Marine Research (Bremerhaven, Germany) is acknowledged for providing the meteorological data from R/V Polarstern. British Oceanographic Data Centre is acknowledged for providing AMT19 and 20 meteorological data (the data were supplied to BODC by Chris Barnard, Gareth Knights and Jon Seddon).
Edited by: A. Kokhanovsky
References
Adames, A. F., Reynolds, M., Smirnov, A., Covert, D. S., and Ack-erman, T. P.: Comparison of MODIS ocean aerosol retrievals with ship-based sun photometer measurements from the “Around the America’s” expedition, J. Geophys. Res., 116, D16303, doi:10.1029/ 2010JD015440, 2011.
Anguelova, M. D. and Webster, F.: Whitecap coverage from satellite measurements: A first step toward modeling the vari-ability of oceanic whitecaps, J. Geophys. Res., 111, C03017, doi:10.1029/2005JC003158, 2006.
Blanchard, D. C. and Woodcock, A. H.: The production, concentra-tion and vertical distribuconcentra-tion of the sea-slat aerosol, Ann. N. Y. Acad. Sci., 338, 330–347, 1980.
de Leeuw, G., Neele, F. P., Hill, M., Smith, M. H., and Vignati, E.: Production of sea spray aerosol in the surf zone, J. Geophys. Res., 105, 29397–29409, doi:10.1029/2000JD900549, 2000. Derber, J. C., Parrish, D. F., and Lord, S.: The new global
oper-ational analysis system at the Noper-ational Meteorological Center, Weather Forecast., 6, 538–547, 1991.
Eck, T. F., Holben, B. N., Reid, J. S., Dubovik, O., Smirnov, A., O’Neill, N. T., Slutsker, I., and Kinne, S.: Wavelength depen-dence of the optical depth of biomass burning, urban, and desert dust aerosol, J. Geophys. Res., 104, 31333–31350, 1999. Fan, T. and Toon, O. B.: Modeling sea-salt aerosol in a coupled
climate and sectional microphysical model: mass, optical depth and number concentration, Atmos. Chem. Phys., 11, 4587–4610, doi:10.5194/acp-11-4587-2011, 2011.
Gathman, S. G.: Optical properties of the marine aerosol as pre-dicted by the Navy aerosol model, Opt. Eng., 22, 57–62, 1983. Glantz, P., Nilsson, E. D., and von Hoyningen-Huene, W.:
Estimat-ing a relationship between aerosol optical thickness and surface wind speed over the ocean, Atmos. Res., 92, 58–68, 2009. Grandey, B. S., Stier, P., Wagner, T. M., Grainger, R. G., and
Hodges, K. I.: The effect of extratropical cyclones on satellite-retrieved aerosol properties over ocean, Geophys. Res. Lett., 38, L13805, doi:10.1029/2011GL047703, 2011.
Haywood, J., Ramaswamy, V., and Soden, B.: Tropospheric aerosol climate forcing in clear-sky satellite observation over the oceans, Science, 283, 1299–1303, 1999.
Holben B. N., Eck, T. F., Slutsker, I., Tanre, D., Buis, J. P., Set-zer, A., Vermote, E., Reagan, J. A., Kaufman, Y., Nakajima, T., Lavenu, F., Jankowiak, I., and Smirnov, A.: AERONET – A fed-erated instrument network and data archive for aerosol character-ization, Remote Sens. Environ., 66, 1–16, 1998.
A. Smirnov et al.: Effect of wind speed on aerosol optical depth over remote oceans 387
Holben, B. N., Tanre, D., Smirnov, A., Eck, T. F., Slutsker, I., Abuhassan, N., Newcomb, W. W., Schafer, J., Chatenet, B., Lav-enue, F., Kaufman, Y. J., Van de Castle, J., Setzer, A., Markham, B., Clark, D., Frouin, R., Halthore, R., Karnieli, A., O’Neill, N. T., Pietras, C., Pinker, R. T., Voss, K., and Zibordi, Z.: An emerg-ing ground-based aerosol climatology: Aerosol optical depth from AERONET, J. Geophys. Res., 106, 12067–12097, 2001. Huang, H., Thomas, G. E., and Grainger, R. G.: Relationship
be-tween wind speed and aerosol optical depth over remote ocean, Atmos. Chem. Phys., 10, 5943–5950, doi:10.5194/acp-10-5943-2010, 2010.
Jaegle, L., Quinn, P. K., Bates, T., Alexander, B., and Lin, J.-T.: Global distribution of sea salt aerosols: new constraints from in situ and remote sensing observations, Atmos. Chem. Phys., 11, 3137–3157, doi:10.5194/acp-11-3137-2011, 2011.
Kahn, R. A., Gaitley, B. J., Garay, M. J., Diner, D. J., Eck, T. F., Smirnov, A., and Holben, B. N.: Multiangle Imaging SpectroRa-diometer global aerosol product assessment by comparison with the Aerosol Robotic Network, J. Geophys. Res., 115, D23209, doi:10.1029/2010JD014601, 2010.
Kiliyanpilakkil, V. P. and Meskhidze, N.: Deriving the effect of wind speed on clean maritime aerosol optical properties using the A-Train satellites, Atmos. Chem. Phys., 11, 11401–11413, doi:10.5194/acp-11-11401-2011, 2011.
Kleidman, R. G., Smirnov, A., Levy, R. C., Mattoo, S., and Tanre, D.: Evaluation and wind speed dependence of MODIS aerosol retrievals over open ocean, IEEE T. Geosci. Remote, 50, 429– 435, doi:10.1109/TGRS.2011.2162073, 2012.
Knobelspiesse, K. D., Pietras, C., Fargion, G. S., Wang, M. H., Frouin, R., Miller, M. A., Subramaniam, S., and Balch, W. M.: Maritime aerosol optical thickness measured by handheld sun-photometers, Remote Sens. Environ., 93, 87–106, 2004. Latham, J. and Smith, M. H.: Effect on global warming of
wind-dependent aerosol generation at the ocean surface, Nature, 347, 372–373, 1990.
Lehahn, Y., Koren, I., Boss, E., Ben-Ami, Y., and Altaratz, O.: Es-timating the maritime component of aerosol optical depth and its dependency on surface wind speed using satellite data, At-mos. Chem. Phys., 10, 6711–6720, doi:10.5194/acp-10-6711-2010, 2010.
Lewis, E. R. and Schwartz, S. E.: Sea Salt Aerosol Production: Mechanisms, Methods, Measurements, and Models – A Criti-cal Review, GeophysiCriti-cal monograph 152, American Geophysi-cal Union, Washington, DC, 413 pp., 2004.
Lovett, R. F.: Quantitative measurement of airborne sea-salt in the North Atlantic, Tellus, 30, 358–363, 1978.
Madry, W. L., Toon, O. B., and O’Dowd, C. D.: Modeled opti-cal thickness of sea salt aerosol, J. Geophys. Res., 116, D08211, doi:10.1029/2010JD014691, 2011.
Melin, F., Clerici, M., Zibordi, G., Holben, B. N., and Smirnov, A.: Validation of SeaWiFS and MODIS aerosol products with glob-ally distributed AERONET data, Remote Sens. Environ., 114, 230–250, 2010.
Meskhidze, N. and Nenes, A.: Effects of ocean ecosystem on ma-rine aerosol-cloud interaction, Adv. Meteorol., 2010, 239808, doi:10.1155/2010/239808, 2010.
Mishchenko, M. I. and Geogdzhayev, I.V.: Satellite remote sensing reveals regional tropospheric aerosol trends, Opt. Express, 15, 7423–7438, 2007.
Morys, M., Mims, F. M., Hagerup, S., Anderson, S. E., Baker, A., Kia, J., and Walkup, T.: Design, calibration, and performance of MICROTOPS II handheld ozone monitor and Sun photometer, J. Geophys. Res., 106, 14573–14582, 2001.
Mulcahy, J. P., O’Dowd, C. D., Jennings, S. G., and Ceburnis, D.: Significant enhancement of aerosol optical depth in ma-rine air under wind conditions, Geophys. Res. Lett., 35, L16810, doi:10.1029/2008GL034303, 2008.
O’Dowd, C., Scannell, C., Mulcahy, J., and Jennings, S. G.: Wind speed influences on marine aerosol optical depth, Adv. Meteo-rol., 2010, 830846, doi:10.1155/2010/830846, 2010.
O’Dowd, C. D., Lowe, J. A., and Smith, M. H.: Coupling sea-salt and sulphate interactions and its impact on cloud droplet concentration predications, Geophys. Res. Lett., 26, 1311–1314, doi:10.1029/1999GL900231, 1999.
Sayer, A., Thomas, G. E., and Grainger, R. G.: A sea surface re-flectance model for ATSR and application to aerosol retrievals, Atmos. Meas. Tech., 3, 813–838, doi:10.5194/amt-3-813-2010, 2010.
Sayer, A. M., Smirnov, A., Hsu, N. C., and Holben, B. N.: A pure marine aerosol model, for use in remote sensing applications, J. Geophys. Res., doi:10.1029/2011JD016689, in press, 2012. Shinozuka, Y., Clarke, A. D., Howell, S. G., Kapustin, V. N., and
Huebert, B. J.: Sea-salt vertical profiles over the Southern and tropical Pacific oceans: Microphysics, optical properties, spa-tial variability, and variations with wind speed, J. Geophys. Res., 109, D24201, doi:10.1029/2004JD004975, 2004.
Smirnov, A., Villevalde, Y., O’Neill, N. T., Royer, A., and Tarussov, A.: Aerosol optical depth over the oceans: Analysis in terms of synoptic air mass types, J. Geophys. Res., 100, 16639–16650, 1995.
Smirnov, A., Holben, B. N., Eck, T. F., Dubovik, O., and Slutsker, I.: Effect of wind speed on columnar aerosol opti-cal properties at Midway Island, J. Geophys. Res., 108, 4802, doi:10.1029/2003JD003879, 2003.
Smirnov, A., Holben, B. N., Sakerin, S. M., Kabanov, D. M., Slutsker, I., Chin, M., Diehl, T. L., Remer, L. A., Kahn, R. A., Ignatov, A., Liu, L., Mishchenko, M., Eck, T. F., Kucsera, T. L., Giles, D. M., and Kopelevich, O. V.: Ship-based aerosol opti-cal depth measurements in the Atlantic Ocean, comparison with satellite retrievals and GOCART model, Geophys. Res. Lett., 33, L14817, doi:10.1029/2006GL026051, 2006.
Smirnov, A., Holben, B. N., Slutsker, I., Giles, D. M., McClain, C. R., Eck, T. F., Sakerin, S. M., Macke, A., Croot, P., Zibordi, G., Quinn, P. K., Sciare, J., Kinne, S., Harvey, M., Smyth, T. J., Piketh, S., Zielinski, T., Proshutinsky, A., Goes, J. I., Nelson, N. B., Larouche, P., Radionov, V. F., Goloub, P., Moorthy, K. K., Matarrese, R., Robertson, E. J., and Jourdin, F.: Maritime Aerosol Network as a component of Aerosol Robotic Network, J. Geophys. Res., 114, D06204, doi:10.1029/2008JD011257, 2009. Smirnov, A., Holben, B. N., Giles, D. M., Slutsker, I., O’Neill, N. T., Eck, T. F., Macke, A., Croot, P., Courcoux, Y., Sakerin, S. M., Smyth, T. J., Zielinski, T., Zibordi, G., Goes, J. I., Harvey, M. J., Quinn, P. K., Nelson, N. B., Radionov, V. F., Duarte, C. M., Losno, R., Sciare, J., Voss, K. J., Kinne, S., Nalli, N. R., Joseph, E., Krishna Moorthy, K., Covert, D. S., Gulev, S. K., Milinevsky, G., Larouche, P., Belanger, S., Horne, E., Chin, M., Remer, L. A., Kahn, R. A., Reid, J. S., Schulz, M., Heald, C. L., Zhang, J., Lapina, K., Kleidman, R. G., Griesfeller, J., Gaitley, B. J., Tan,
Q., and Diehl, T. L.: Maritime aerosol network as a component of AERONET – first results and comparison with global aerosol models and satellite retrievals, Atmos. Meas. Tech., 4, 583–597, doi:10.5194/amt-4-583-2011, 2011.
Villevalde, Yu. V., Smirnov, A. V., O’Neill, N. T., Smyshlyaev, S. P., and Yakovlev, V. V.: Measurement of aerosol optical depth in the Pacific Ocean and the North Atlantic, J. Geophys. Res., 99, 20983–20988, doi:10.1029/94JD01618, 1994.
Wallcraft, A.J., Kara, A. B., Barron, C. N., Metzger, E. J., Pauley, R. L., and Bourassa, M. A.: Comparisons of monthly mean 10 m wind speeds from satellites and NWP prod-ucts over the global ocean, J. Geophys. Res., 114, D16109, doi:10.1029/2008JD011696, 2009.
Wentz, F. J. and Meissner, T.: Algorithm Theoretical Basis Docu-ment for AMSR-E Ocean Algorithms, RSS Tech Report 051707, 2007.
Zhang, J. and Reid, J. S.: A decadal regional and global trend analysis of the aerosol optical depth using a data-assimilation grade over-water MODIS and Level 2 MISR aerosol products, Atmos. Chem. Phys., 10, 10949-10963, doi:10.5194/acp-10-10949-2010, 2010.
Zibordi, G., Berthon, J.-F., M´elin, F., and D’Alimonte, D.: Cross-site consistent in situ measurements for satellite ocean color ap-plications: The BiOMaP radiometric dataset, Remote Sens. Env., 115, 2104–2115, 2011.